
Figure 2. Duration of abstinence by frequency of urges to smoke: mean urges over time and best fit linear regression line with 95% confidence intervals.
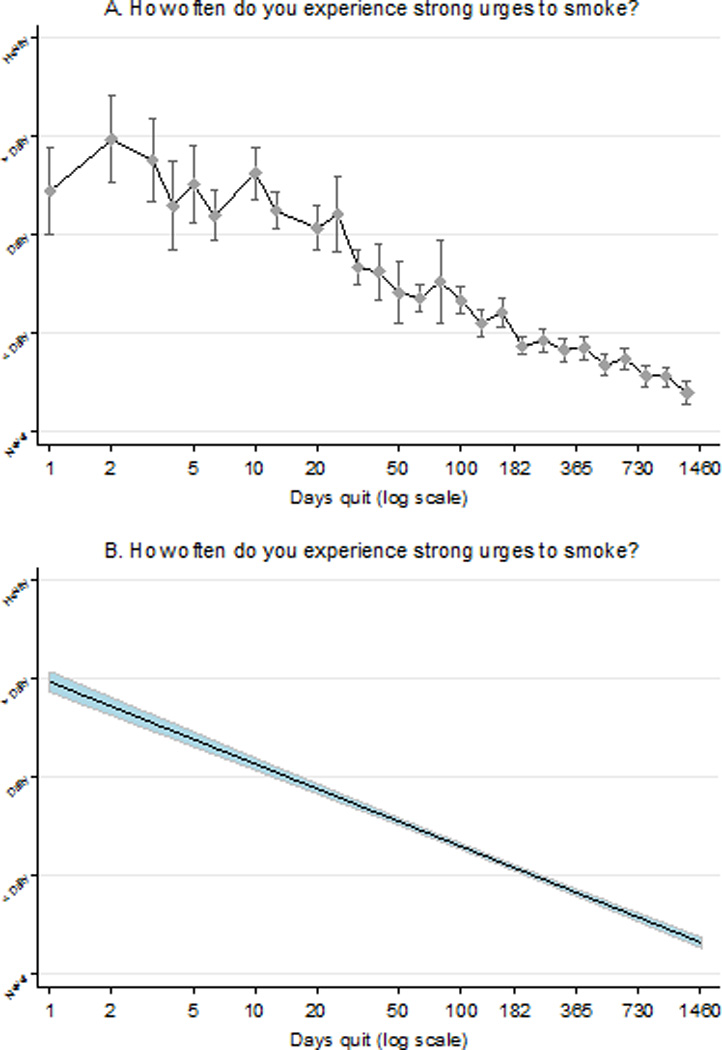
Note: To ensure a sufficient number of participants at each data point in the later stages of quitting for the first graph, the transformed number of days quit variable was rounded to one decimal place. Three data points (days quit [log10] 0.9, 1.2, & 3.1) had fewer than 20 participants and, therefore, for the purposes of this graph only, were recoded into the category below.