

Abstract
Deregulation of transcription factor (TF) networks is emerging as a major pathogenic event in many human cancers (Darnell, 2002 [1]; Libermann and Zerbini, 2006 [2]; Laoukili et al., 2007 [3]). Small molecule intervention is an attractive avenue to understand TF regulatory mechanisms in healthy and disease state, as well as for exploiting these targets therapeutically (Koehler et al., 2003 [4]; Berg, 2008 [5]; Koehler, 2010 [6]). However, because of their physico-chemical properties, TF targeting has been proven to be difficult (Verdine and Walensky, 2007 [7]). The TF FOXM1 is an important mitotic player (Wonsey and Follettie, 2005 [8]; Laoukili et al., 2005 [9]; McDonald, 2005 [10]) also implicated in cancer progression (Laoukili et al., 2007 [3]; Teh, 2011 [11]; Koo, 2012 [12]) and drug resistance development (Kwok et al., 2010 [13]; Carr et al., [14]). Therefore, its inhibition is an attractive goal for cancer therapy. Here, we describe a computational biology approach, by giving detailed insights into methodologies and technical results, which was used to analyze the transcriptional RNA-Seq data presented in our previous work (Gormally et al., 2014 [20]). Our Bioinformatics analysis shed light on the cellular effect of a novel FOXM1 inhibitor (FDI-6) newly identified through a biophysical screen. The data for this report is available at the public GEO repository (accession numberhttp://www.ncbi.nlm.nih.gov/geo/query/acc.cgi?acc=GSE58626).
Keywords: Small molecule inhibition, RNA-Seq, Genomics, Transcription, FOXM1
| Specifications | |
|---|---|
| Subject area | Biology |
| More specific subject area | Biological sciences, Chemical biology, Cancer |
| Type of data | Tables, figures with plots and graphs |
| How data was acquired | Sequencing done with the Illumina HiSeq 2000 instrument, total of 12 genomic libraries for different treatment time |
| Data format | Raw data: fastq files |
| Experimental factors | MCF-7 cells grown in Dulbecco's Modified Eagle Media (Sigma) and supplemented with 10% fetal bovine serum (Sigma) were treated with 40 μM of FDI-6 compound for 3, 6 or 9 h. |
| Experimental features | RNA for each treatment was extracted using the RNeasy Plus Mini Kit (Qiagen) and libraries prepared with the Illumina TruSeq RNA sample prep kit |
| Data source location | Cancer Research UK, Cambridge Institute, Cambridge, UK |
| Data accessibility | Data available in the public GEO repositoryhttp://www.ncbi.nlm.nih.gov/geo/query/acc.cgi?acc=GSE58626 |
Value of the data
-
•
This data allows characterizing the effect of a novel FOXM1 inhibitor on the cellular transcriptional program.
-
•
This data includes replicates and different treatment time points, also providing temporal resolution for elucidating earlier and later responses.
-
•
The RNA-Seq data is validated with external information obtained from previous studies, such as microarray [8] and ChIP-Seq [15], therefore providing an integrated view of the treatment effects.
-
•
This analysis allows the understanding of compound action into cellular context.
Experimental design
Compound identification
The FDI-6 compound was identified in preliminary experiments [20] through fluorescence polarization assay [16]. Setup runs of the fluorescence polarization (FP) assay were performed in 96-well plates and read on PHERAStar (BMG Labtech) with a 488/520 FP filter. The screening assay was scaled down successively to 384- and 1536-well plate formats and read on a ViewLux high-throughput charge-coupled device (CCD) imager (Perkin-Elmer, Wellesley, MA).
RNA-Seq experiment
MCF-7 cells grown in Dulbecco's Modified Eagle Media (Sigma) and supplemented with 10% fetal bovine serum (Sigma) were treated with 40 μM of FDI-6 compound for 3, 6 or 9 h. RNA for each treatment was extracted using the RNeasy Plus Mini Kit (Qiagen) and libraries prepared with the Illumina TruSeq RNA sample prep kit. Sequencing was performed using the MiSeq instrument (Illumina) for a total of ~ 102 million (M) of reads for the pulled 12 libraries.
Materials and methods
RNA-Seq processing
Fastq files containing 100 single-end reads, ranging from 6.7 M to 12.6 M reads, were processed with trim-galore (http://www.bioinformatics.babraham.ac.uk/projects/trim_galore/) to perform adapter trimming and low-quality reads filtering. The filtered reads were then aligned to the human genome (hg19) with tophat, and transcripts were assigned to gene and counted using htseq-count (http://www-huber.embl.de/users/anders/HTSeq/doc/overview.html). See Table 1 for summary statistics.
Table 1.
Summary statistics of sequencing analysis of the RNA-Seq libraries. The columns show (from left to right): treatment time and replicate number; number of aligned reads; total number of reads after quality filtering; percentage of aligned reads; number of reads assigned uniquely by htseq-count; and percentage of assigned reads out of the aligned ones.
| Library | # Aligned reads (tophat2) | # Reads | % Reads aligned | # Reads assigned (htseq-count) | % Reads assigned |
|---|---|---|---|---|---|
| 0 h #1 | 12′212′116 | 12′569′461 | 97.2 | 10′132′961 | 83.0 |
| 0 h #2 | 7′635′001 | 7′909′304 | 96.5 | 6′161′473 | 80.7 |
| 0 h #3 | 7′021′389 | 7′269′544 | 96.6 | 5′753′279 | 81.9 |
| 3 h #1 | 10′122′474 | 10′503′420 | 96.4 | 8′377′551 | 82.8 |
| 3 h #2 | 5′941′461 | 6′245′837 | 95.1 | 4′891′124 | 82.3 |
| 3 h #3 | 10′431′708 | 10′793′766 | 96.6 | 8′497′623 | 81.5 |
| 6 h #1 | 7′036′437 | 7′304′692 | 96.3 | 5′590′755 | 79.5 |
| 6 h #2 | 6′935′146 | 7′190′738 | 96.4 | 5′519′191 | 79.6 |
| 6 h #3 | 7′314′462 | 7′580′633 | 96.5 | 5′845′352 | 79.9 |
| 9 h #1 | 9′719′183 | 10′033′596 | 96.9 | 7′917′493 | 81.5 |
| 9 h #2 | 6′525′440 | 6′756′659 | 96.6 | 5′250′375 | 80.5 |
| 9 h #3 | 7′594′156 | 7′939′613 | 95.6 | 6′124′675 | 80.6 |
Reproducibility analysis
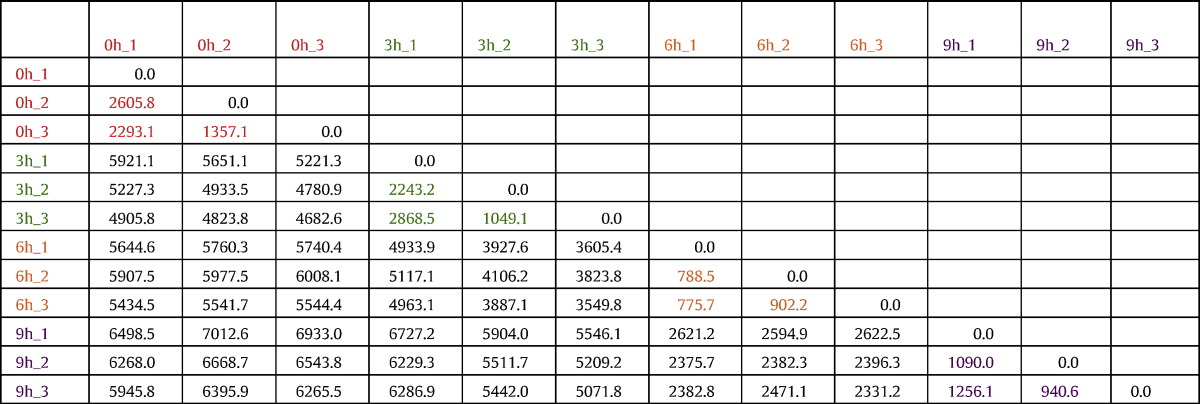
We performed hierarchical clustering of the 12 libraries by using the hclust function of the stats package in R (http://www.r-project.org/) with default parameters. The three replicates of each time point, untreated, 3, 6 and 9 h of treatment clustered closely together (Fig. 1A). The Euclidean distance between each library pair shows that replicates of the same time point have the lower distance, whereas conditions that are more far apart, such as untreated and 9 hour treatment, have the highest distance values (Table 2). Multidimensional scaling (MDS) plotting was obtained through the plotMDS function of the limma package in Bioconductor [17]. In this implementation, the plot is adapted to display expression values such that the dimensions selected are the ones that better separate the data points in terms of their log fold change. We observed good separation of different conditions and high reproducibility of replicates (Fig. 1B). Further, the treatment data points are separated from the untreated along the leading log fold change dimension.
Fig. 1.

Reproducibility analysis of the RNA-Seq data. (A) Hierarchical clustering of gene expression profiles, showing the similarity of different treatment times. See Table 2 for details of Euclidian distance between paired libraries. h = hours. (B) Multidimensional scaling plot of different time points. Color legend is reported in the upper left corner of the plot. hrs = hours; dim = dimension; logFC = logarithm of fold change. (C) Differential expression between untreated libraries. Each comparison is run between one library and the other two (e.g. in “Rep 1 vs Rep 2 & 3” replicate 1 indicates first replicate versus the other two (second and third) replicates pulled together). up = up-regulated; down = down-regulated; both = up- and down-regulated; Rep = replicate.
Table 2.
Euclidean distance between each pair of libraries. Replicates of different treatment time are shown with the same colors: red, green, orange and purple for 0, 3, 6 and 9 h, respectively. The distance between each replicate pair is shown with the same color-coding. The matrix shows that pairs belonging to the same treatment time have lower distance (i.e., they are more similar) than pair of libraries belonging to different times.
Differential expression analysis
Data were normalized and analyzed for differential expression using the package edgeR of Bioconductor. The function exactTest was used pairwise to assess differential expression (logarithm of fold change, logFC) and significance (false discovery rate, FDR) between any two conditions. To have an empirical estimation of the variability within our replicates and to help interpret the results of differential expression, we run differential expression between replicates of the untreated conditions. This analysis shows that on average we should expect around 165 up- and down-regulated genes as a result of the intrinsic biological variability (Fig. 1C). The results of the differential expression analysis between different time points showed that several genes were differentially expressed compared to untreated (Fig. 2B). Also, many genes showed further changes at later time points, e.g. between 3 and 6 h, suggesting that the compound may induce delayed responses or that secondary effects may occur after the initial ones. Because of this consideration and since we were primarily interested in the direct effect of the compound rather than in secondary effects, we selected 3 hour treatment as the comparison time point for following analysis: 1953 and 1550 genes were significantly (FDR ≤ 0.05) up- and down-regulated, respectively (Fig. 2A). Gene ontology (GO) enrichment analysis performed by the DAVID web-tool [18] showed that down-regulated genes are involved in mitosis and mitotic regulation, as suggested by the enriched ontology terms mitotic cell cycle (FDR = 10− 21), microtubule cytoskeleton (FDR = 10− 14), spindle (FDR = 10− 13) and cell division (FDR = 10− 12). Up-regulated genes are involved in biosynthetic process (FDR = 10− 15), positive regulation of transcription (FDR = 10− 12) and apoptosis (FDR = 10− 10). Venn diagram analysis performed on strongly differentially expressed genes, i.e. with FDR < 0.01 and abs(logFC) > 1, showed that not only further changes are observable at later time points (Fig. 2B), but strong changes are also due to different sets of genes (Fig. 2C).
Fig. 2.

Differential expression and time clustering analysis. (A) Global differential expression map of RNA-Seq after 3 h treatment versus untreated. Y-axis: logarithm of fold change (logFC); X-axis: logarithm of counts per million of reads (logCPM). Red dots: up-regulated genes (n = 1951); green dots: down-regulated genes (n = 1552). FDR = false discovery rate. (B) Number of genes differentially expressed for each couple of time points. Up = upregulated in second time points compared to first one; down = downregulated in second time point compared to first one; both = some of up and down categories. Abbreviations as in Fig. 1C. (C) Venn diagrams showing the overlap of differentially expressed genes at the different time points. hrs = hours. (D) Temporal cluster analysis grouping genes that show similar changes in expression after FDI-6 treatment, original profiles. (E) Same as D, standardized profiles.
Temporal clustering
The clustering of temporal profiles of gene expression was done using the R package Mfuzz [19], which performs soft clustering of genes based on their expression values using the fuzzy c-means algorithm. We first selected only the 1552 genes having a substantial change in either one of the time points (i.e., abs(logFC) > 0.75); we then run the fuzzy c-means algorithm with parameters 9 and 1.35, respectively the number of clusters and the fuzzification parameter. The original temporal profiles used for clustering are reported in Fig. 3D, whereas the profiles in Fig. 3E are standardized such that the average expression value for each gene in the different time points is 0 and the standard deviation is 1. Many patterns displayed a transient (clusters 1, 5) or delayed (clusters 2, 7, 9) up- or down-regulation, suggesting the complexity of the cellular response to treatment and highlighting again the variable transcriptional regulation across different time points observed in Fig. 2B, C. In Table S1 each one of the 12,873 genes has been assigned to a temporal pattern by calculating the maximal similarity (Pearson correlation coefficient) to the average profile of each of the 9 clusters previously identified on the 1552 strongly changing genes.
Fig. 3.

Cross validation with independent data sets. (A) Barplots showing the percentage of differentially expressed gene sets with a transcription factor occupancy in the promoter region (2 kb upstream of tss). Plots are shown for the closely related forkhead transcription factors FOXM1, FOXA1, FOXA2, FOXP2 as well as the transcriptional activator GATA1. For each plot, from left to right, bars represent down-regulated (down), up-regulated (up), and not differentially expressed (not de) gene sets. (B) Barplot showing the percentage of genes in the different temporal clusters with a FOXM1 peak in the promoter region. (C) Barplot showing the fraction of genes that were up- and down-regulated by FDI-6 and were commonly differentially expressed in an existing microarray data set of FOXM1 siRNA knockdown. Error bars indicate s.e.m.
Cross validation with other data sets
For the promoter occupancy, we collected all peak files available at the website of the ENCODE project [15] (www.encodeproject.org) for all members of the FOX (Forkhead box) proteins plus GATA1 as an out-group. Peak files were previously calculated by the consortium using the peak caller MACS on ChiPseq experiments done in duplicates, under standardized conditions. Our analysis consisted of these steps: 1) we took only peaks in common between the two duplicates by calculating the intersection of peaks with bedtools; 2) for each gene, we identified the promoter region as the genomic region 2000 bases upstream and 100 bases downstream of the transcription start site (TSS); 3) we counted peaks inside the promoter regions; 4) we calculated the proportion of genes having at least one peak in the promoter region, dividing the genes in down-regulated (down), up-regulated (up) and not differentially expressed (not de); 5) we divided the three proportions for each group by the value of the genes not differentially expressed ('not de'), such that the 'not de' group has the reference value of 1; 6) the normalized proportion values of all data sets relative to the same transcription factor were averaged. For all the above steps, we considered as differentially expressed genes with FDR < 0.01 and logFC > 0.3 (or < 0.3) at 3 h. P-values were determined using the non-parametric chi-squared test for proportions (function prop.test in the R package stats). The data showed that FDI-6 treatment was specifically and strongly enriched (~ 19 folds, p < 1e− 16) in correspondence of FOXM1 binding sites (Fig. 3A) and not other transcription factor members of the FOX family or GATA1. Further, this enrichment was specific for genes belonging to the temporal cluster number 5 (Fig. 3B), which was also the one strongly enriched in mitotic genes (FDR = 3e− 19 for the GO term mitosis).
For the comparison to FOXM1 knockdown (KD), we compared the RNA-Seq data to the Affymetrix expression array data downloaded from GEO (accession number http://www.ncbi.nlm.nih.gov/geo/query/acc.cgi?acc=GSE2222) [8]. In this study, BT-20 breast cancer cells were exposed to a mock transfection, GFP siRNA, or FOXM1 siRNA. Each condition was performed in triplicate, and RNA was collected after 48 h. We considered the categories “up_drug” and “down_drug” as the genes up- (logFC > 0.5) and down-regulated (logFC < − 0.5) after 3 h treatment with FDI-6, as measured by RNA-Seq. The categories “up_kd” and “down_kd” refer to genes up- (logFC > 0.5) and down-regulated (logFC <− 0.5) upon FOXM1 KD. “cluster5_down” and “cluster5_up” refer to genes down-regulated (logFC < − 0.5) belonging to cluster 5 from the temporal clustering analysis. P-values were determined as explained above (function prop. test). This comparison revealed a tendency for genes down-regulated by siRNA FOXM1 to be similarly down-regulated by the compound (p = 6e10− 5), whereas no significant association (p > 0.05) was observed between the genes up-regulated by the two treatments. The trend is even more pronounced within the subset of genes in cluster 5, which are 3.7-fold (p = 2e10− 5) enriched for genes down-regulated by siRNA FOXM1 (Fig. 3C).
Acknowledgments
We would like to thank professor Balasubramanian for support and discussions. This work was funded by the Wellcome Trust Senior Investigator Award, the core funding from Cancer Research UK, the intramural research programme of the National Center for Advancing Translational Sciences and the Molecular Libraries Initiative of the National Institutes of Health Common Fund (grant U54MH084681). M.V.G. is supported by a Churchill Scholarship and an NIH OxCam Fellowship. Sequencing was provided by the Genomics core facility of the Cancer Research UK, Cambridge Institute.
Footnotes
Supplementary data to this article can be found online at http://dx.doi.org/10.1016/j.gdata.2014.10.012.
Appendix A. Supplementary data
Genes differential expression.
References
- 1.Darnell J.E. Transcription factors as targets for cancer therapy. Nat. Rev. Cancer. 2002;2:740–749. doi: 10.1038/nrc906. [DOI] [PubMed] [Google Scholar]
- 2.Libermann T.A., Zerbini L.F. Targeting transcription factors for cancer gene therapy. Curr. Gene Ther. 2006;6:17–33. doi: 10.2174/156652306775515501. [DOI] [PubMed] [Google Scholar]
- 3.Laoukili J., Stahl M., Medema R.H. FoxM1: at the crossroads of ageing and cancer. Biochim. Biophys. Acta (BBA) - Mol. Basis Dis. 2007;1775:92–102. doi: 10.1016/j.bbcan.2006.08.006. [DOI] [PubMed] [Google Scholar]
- 4.Koehler A.N., Shamji A.F., Schreiber S.L. Discovery of an inhibitor of a transcription factor using small molecule microarrays and diversity-oriented synthesis. J. Am. Chem. Soc. 2003;125:8420–8421. doi: 10.1021/ja0352698. [DOI] [PubMed] [Google Scholar]
- 5.Berg T. Inhibition of transcription factors with small organic molecules. Curr. Opin. Chem. Biol. 2008;12:464–471. doi: 10.1016/j.cbpa.2008.07.023. [DOI] [PubMed] [Google Scholar]
- 6.Koehler A.N. A complex task? Direct modulation of transcription factors with small molecules. Curr. Opin. Chem. Biol. 2010;14:331–340. doi: 10.1016/j.cbpa.2010.03.022. [DOI] [PMC free article] [PubMed] [Google Scholar]
- 7.Verdine G.L., Walensky L.D. The challenge of drugging undruggable targets in cancer: lessons learned from targeting BCL-2 family members. Clin. Cancer Res. 2007;13:7264–7270. doi: 10.1158/1078-0432.CCR-07-2184. [DOI] [PubMed] [Google Scholar]
- 8.Wonsey D.R., Follettie M.T. Loss of the forkhead transcription factor FoxM1 causes centrosome amplification and mitotic catastrophe. Cancer Res. 2005;65:5181–5189. doi: 10.1158/0008-5472.CAN-04-4059. [DOI] [PubMed] [Google Scholar]
- 9.Laoukili J. FoxM1 is required for execution of the mitotic programme and chromosome stability. Nat. Cell Biol. 2005;7:126–136. doi: 10.1038/ncb1217. [DOI] [PubMed] [Google Scholar]
- 10.McDonald D. FoxM1 dances with mitosis. Nat. Cell Biol. 2005;7:108–110. doi: 10.1038/ncb0205-108. [DOI] [PubMed] [Google Scholar]
- 11.Teh M.T. In: Stem Cells and Cancer Stem Cells: Therapeutic Applications in Disease and Injury. Hayat M.A., editor. Vol. 3. Springer Verlag; 2011. [Google Scholar]
- 12.Koo C.-Y., Muir K.W., Lam E.W.F. FOXM1: from cancer initiation to progression and treatment. BBA - Gene Regul. Mech. 2012;1819:28–37. doi: 10.1016/j.bbagrm.2011.09.004. [DOI] [PubMed] [Google Scholar]
- 13.Kwok J.M.-M. FOXM1 confers acquired cisplatin resistance in breast cancer cells. Mol. Cancer Res. 2010;8:24–34. doi: 10.1158/1541-7786.MCR-09-0432. [DOI] [PMC free article] [PubMed] [Google Scholar]
- 14.Carr J.R., Park H.J., Wang Z., Kiefer M.M., Raychaudhuri P. FoxM1 mediates resistance to herceptin and paclitaxel. Cancer Res. 2010;70:5054–5063. doi: 10.1158/0008-5472.CAN-10-0545. [DOI] [PMC free article] [PubMed] [Google Scholar]
- 15.Consortium E.P. The, ENCODE (ENCyclopedia of DNA elements) project. Science. 2004;306:636–640. doi: 10.1126/science.1105136. [DOI] [PubMed] [Google Scholar]
- 16.Jameson D.M., Ross J.A. Fluorescence polarization/anisotropy in diagnostics and imaging. Chem. Rev. 2010;110:2685–2708. doi: 10.1021/cr900267p. [DOI] [PMC free article] [PubMed] [Google Scholar]
- 17.Gentleman R.C. Bioconductor: open software development for computational biology and bioinformatics. Genome Biol. 2004;5(10):R80. doi: 10.1186/gb-2004-5-10-r80. [DOI] [PMC free article] [PubMed] [Google Scholar]
- 18.Huang D.W., Sherman B.T., Lempicki R.A. Systematic and integrative analysis of large gene lists using DAVID Bioinformatics Resources. Nat. Protoc. 2009;4(1):44–57. doi: 10.1038/nprot.2008.211. [DOI] [PubMed] [Google Scholar]
- 19.Kumar L., Futschik E.M. Mfuzz: a software package for soft clustering of microarray data. Bioinformation. 2007;2:5–7. doi: 10.6026/97320630002005. [DOI] [PMC free article] [PubMed] [Google Scholar]
- 20.Gormally M.V. Suppression of the FOXM1 transcriptional program via novel small molecule inhibition. Nat. Commun. 2014;5:5165. doi: 10.1038/ncomms6165. [DOI] [PMC free article] [PubMed] [Google Scholar]
Associated Data
This section collects any data citations, data availability statements, or supplementary materials included in this article.
Supplementary Materials
Genes differential expression.