

Abstract
The concept of cancer stem cells (CSCs) claims that colorectal carcinomas (CRCs), like normal colorectal epithelium, are organized hierarchically and contain a subpopulation of qualitatively distinct cancer cells. The expression of distinctive surface markers or of certain enzymes is a prerequisite for the isolation and characterization of the CSC population. With respect to CRCs, putative CSCs can be identified by leucine-rich-repeat-containing G-protein-coupled receptor 5 (Lgr5, also known as G-protein-coupled receptor 49, Gpr49). However, the precise function of the intestinal stem cell marker Lgr5 in CRCs remains largely unknown. We silenced LGR5 expression in SW480 CRC cells via lentiviral shRNA constructs. This led to the depletion of a morphologically distinct subpopulation of SW480 CRC cells. Microarray gene expression profiling revealed a down-regulation of NOTCH signaling upon LGR5 silencing that could be confirmed by immunohistochemistry. Furthermore, we induced inflammation-driven colon tumors in Lgr5-EGFP-IRES-Cre-ERT2 mice via administration of azoxymethane and dextrane sodium sulfate. The induced tumors were flow-sorted into fractions of epithelial cells that expressed high or low levels of Lgr5 and were characterized using gene expression profiling. Lgr5 high tumor cells showed higher levels of several stem cell-associated genes and higher Wnt signaling than Lgr5 low tumor cells and Lgr5 high normal stem cells. Here we provide a thorough description of our two gene expression datasets including quality control checks uploaded to Gene Expression Omnibus database (data accession number: GSE46200). The analysis and interpretation of our gene expression data and related results have been published recently by Hirsch and colleagues in Carcinogenesis in 2014.
Keywords: Colorectal cancer, Lgr5, Expression profiling
| Specifications | |
|---|---|
| Organism/cell line/tissue | SW480 human colorectal cancer cell line/B6.129P2-Lgr5tm1(cre/ERT2)Cle/J mice |
| Sex | Male/male or female |
| Sequencer or array type | Agilent-026652 Whole Human Genome Microarray 4x44K v2 (GPL13497)/Agilent-014868 Whole Mouse Genome Microarray 4x44K G4122F (GPL7202) |
| Data format | Raw |
| Experimental factors | LGR5 status (shLGR5 versus control, Lgr5 high versus low) |
| Experimental features | LGR5 status dependent transcriptome profiling of colorectal cancer cells |
| Consent | N/A |
| Sample source location | Bethesda, MD, USA |
Direct link to deposited data
Experimental design, materials and methods
Experimental design
We aimed to characterize the transcriptome of CRC cells as a function of LGR5 expression. Therefore, we silenced the expression of LGR5 in SW480 CRC cells via shRNA. SW480 is composed of two morphologically distinct subpopulations, i.e., spheres and adherent cells. LGR5 silencing resulted in a loss of spheres. To analyze the underlying molecular mechanisms, we then analyzed changes in gene expression by microarrays comparing shLGR5 with control cells and adherent cells with spheres. Furthermore, we performed gene expression analyses of ex vivo isolated colon tumors flow-sorted into an Lgr5 high and an Lgr5 low fraction. We exposed Lgr5-EGFP-IRES-Cre-ERT2 mice, which harbor one EGFP-tagged Lgr5 allele, to azoxymethane/dextrane sodium sulfate (AOM/DSS) to induce inflammation-driven colon tumors. Single cell suspensions were prepared from normal mouse colons and AOM/DSS-induced mouse colon tumors and flow-sorted into Lgr5 high and low cells based on GFP expression (Fig. 1). The flow-sorted cell fractions were then characterized using gene expression profiling.
Fig. 1.
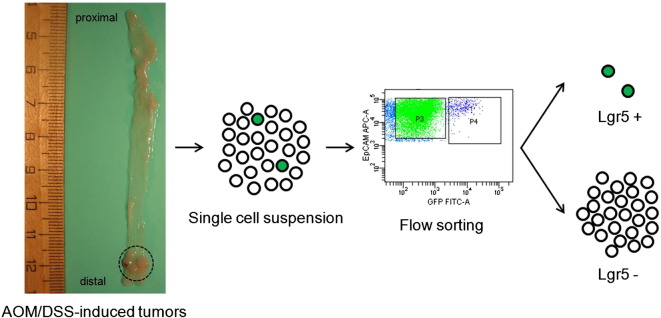
Workflow of flow sorting AOM/DSS-induced mouse colon tumors for Lgr5. Colon tumor region is circled.
Lentiviral transduction of SW480 CRC cells
Lentiviral shRNA transduction of SW480 cells was done using high-titer lentivirus (Clone ID: V3LHS_635055, Open Biosystems, Thermo Fisher Scientific, Lafayette, CO) according to the manufacturer's instructions. Knockdown efficiency was confirmed by real-time qRT-PCR.
Microarray gene expression profiling of SW480 CRC cells
Total RNA was isolated from SW480 shLGR5 and control cells, and from SW480 spheres and adherent cells using the RNeasy Mini Kit (Qiagen, Hilden, Germany) including DNase I treatment (RNase-Free DNase Set, Qiagen). RNA concentration and purity were measured by spectrophotometry (NanoDrop 1000 Spectrophotometer, NanoDrop products, Wilmington, DE). RNA integrity was assessed by 2100 Bioanalyzer (RNA 6000 Nano LabChip Kit, Agilent Technologies, Inc., Santa Clara, CA). For all samples a RNA integrity number greater than eight could be achieved. Appropriate LGR5 status was confirmed by real-time qRT-PCR. Total RNA was labeled using the Quick Amp Labeling Kit, one-color (Agilent) and subsequently hybridized on Human GE 4x44K v2 Microarrays (Agilent) according to the manufacturer's protocol version 6.5. Briefly, 700 ng of total RNA was reverse transcribed and Cy3-labeled cRNA was prepared using a T7 RNA polymerase. Concentration, purity and dye incorporation of Cy3-labeled cRNA were measured by NanoDrop. Labeled cRNA yield and specific activity both were above the cut-off values defined by Agilent for all labeled samples. Slides were scanned with microarray scanner G2565BA (Agilent). Images were analyzed and data were quality controlled using Feature Extraction software version 10.7.1.1 (Agilent). Quality control (QC) metrics were within the “good” range for all hybridized samples based on QC criteria defined by Agilent. Three independent experiments were performed for each cell fraction using separately cultured cells for each experiment.
Mouse model of carcinogen-induced inflammation-driven colon tumorigenesis
Heterozygous Lgr5-EGFP-IRES-CreERT2 mice [strain B6.129P2-Lgr5tm1(cre/ERT2)Cle/J, henceforth referred to as ‘Lgr5-EGFP mice’] were ordered from Jackson Laboratory (Bar Harbor, ME) [1]. All mice were bred and housed in a pathogen-free environment and used in experiments in accordance with institutional guidelines at the Center for Cancer Research, National Cancer Institute, National Institutes of Health. All experimental procedures conducted in this study were approved by the Animal Care and Use Committee of the National Institutes of Health. To induce colon tumors, Lgr5-EGFP-IRES-CreERT2 mice aged two to four months were injected with AOM (12.5 μg/g body weight; A5486, Sigma, St. Louis, MO) twice and subjected to three cycles of DSS (2.5% w/v; MW = 36,000–50,000, MP Biomedicals, Solon, OH) in the drinking water [2], [3]. Tumor growth was monitored by colonoscopies. About 100 days after the first AOM injection, mice were sacrificed.
Preparation of single cell suspensions and flow sorting of normal mouse colons and mouse colon tumors
Freshly isolated mouse colon tissue (normal or tumor) was washed in ice-cold PBS. Cleaned tissue was minced into 15 ml of collagenase solution [RPMI with collagenase D (5 mg/ml; Roche Applied Science, Indianapolis, IN), FBS (5% v/v) and DNase I (1 μg/ml; Sigma, St. Louis, MO)] using two scalpels and incubated on a platform shaker at 37 °C for one hour. During the incubation period, tissue was gently pipetted up and down at least 10 times every 15 min to release as many cells as possible from the minced tissue pieces. Next, tissue and media mixture was passed over a 70-μm followed by a 40-μm cell strainer (both BD Falcon™, BD Biosciences, San Jose, CA). To minimize cell death and alteration in gene expression, we immediately continued with staining for flow cytometry. After the removal of collagenase solution, cells were incubated in Fc blocking solution [PBS with FBS (2% v/v), CD16/CD32 (2% v/v; BD Pharmingen™, BD Biosciences) and donkey serum (5% v/v; Sigma)] on ice for 20 min. Fc blocking solution was then removed and cells were stained with Anti-EpCAM rat monoclonal antibody conjugated to allophycocyanin [1:400 dilution in PBS with FBS (2% v/v) to a total volume of 600 μl for normal mouse colons and 400 to 800 μl for mouse colon tumors depending on tumor size; clone G8.8, eBioscience, San Diego, CA] on ice for 30 min. Cells were then washed and resuspended in 0.5 ml to 1.5 ml (depending on pellet size) of PBS with FBS (2% v/v). To exclude dead cells, 7-AAD (BD Pharmingen™, BD Biosciences) was added shortly before starting the sorting process. Lgr5-EGFP high/EpCAM high/7-AAD negative cells and Lgr5-EGFP low/EpCAM high/7-AAD negative cells were flow-sorted using a FACSAria II system (BD Biosciences). After sorting, cells were collected in RPMI with HEPES (50 mM) and FBS (50% v/v), and we immediately continued with DNA and RNA isolation. Data was analyzed using both FACSDiva software version 6.0 (BD Biosciences) and FlowJo software version 9.5.2 (Tree Star Inc., Ashland, OR).
RNA amplification and microarray gene expression profiling of flow-sorted normal mouse colons and mouse colon tumors
RNA was isolated from flow-sorted normal mouse colons and mouse colon tumors without delay using the DNA/RNA AllPrep Micro Kit (Qiagen) according to the manufacturer's instructions. We confirmed by real-time qRT-PCR that GFP high flow-sorted cells had significantly higher Lgr5 expression levels than GFP low flow-sorted cells. Isolated RNA was amplified together with spike-ins (1 μl of a 1:50,000 dilution per reaction, One-Color RNA Spike-In Kit, Agilent) using the Ovation Pico WTA System (NuGEN Technologies, Inc., San Carlos, CA). Amplified cDNA was purified using the QIAquick PCR Purification Kit (Qiagen) before concentration and purity were measured by NanoDrop. Two μg of amplified cDNA were labeled using the BioPrime® Total Genomic Labeling Module (Invitrogen, Life Technologies, Carlsbad, CA). Concentration, purity and dye incorporation of Alexa Fluor® 3 labeled cDNA were measured by NanoDrop. Labeled cDNA yield and specific activity were both within the expectations for all labeled samples. Subsequently, 4 μg of Alexa Fluor® 3 labeled target was hybridized on Whole Mouse Genome Microarrays 4x44K (Agilent) according to NuGEN's Agilent Solution Application Note #1. Scanning, image analysis and data quality control were done as for SW480 CRC cells. QC metrics were within the expectations for all hybridized samples. Fifteen independent experiments were performed using seven individual mice for normal colons and eight for tumors.
Microarray gene expression analysis
Log2 intensities were normalized to the 75% percentile according to the manufacturer's protocol (Agilent). Only probes with intensities higher than 50 were used for the analysis. Unsupervised hierarchical clustering with Euclidean distance and Ward method was performed with Genomics Suite™ software (Partek Incorporated, St. Louis, MO). The corresponding functional annotation of differentially expressed genes and their affiliation with specific genetic pathways was interrogated using Ingenuity Pathway Analysis software (Ingenuity Systems, Redwood City, CA). Microarray gene expression data have been deposited in Gene Expression Omnibus database (data accession number: GSE46200).
Discussion
Here, we provide information about two gene expression datasets of CRC stem-like cells defined by LGR5 expression. These two datasets have been analyzed and interpreted in a study published recently [4]. In the first dataset LGR5 was silenced in human SW480 CRC cells actively via shRNA and gene expression differences of shLGR5 cells were analyzed compared with the original cell population. Given that LGR5 silencing resulted in a loss of spheres, we additionally compared adherent cells with spheres. Spheres expressed higher levels of several stem cell-associated genes including LGR5, SOX2, ALDH1A1 and SMOC2, and the NOTCH signaling pathway was up-regulated (Fig. 2). Conversely, the NOTCH signaling pathway was down-regulated in shLGR5 cells, which could be confirmed immunohistochemically using an antibody against cleaved NOTCH1. The second dataset catalogs gene expression of Lgr5 high tumor stem-like cells from murine colon tumors on a single mouse level. We induced colon tumors in Lgr5-EGFP-IRES-Cre-ERT2 mice via administration of AOM and DSS. Resulting tumors were flow-sorted into Lgr5 high and Lgr5 low fractions. Our approach without pooling of samples required an RNA amplification step prior to gene expression profiling. Reassuringly, stem cell-specific genes including Lgr5 and Smoc2 were up-regulated in Lgr5 high cells. Both principal component analysis and hierarchical clustering showed a clear separation of Lgr5 high and low tumor cells, which was less obvious in normal cells (Fig. 3). Furthermore, the Wnt signaling pathway was up-regulated within the Lgr5 high tumor cell fraction.
Fig. 2.

Ingenuity pathway analysis reveals an up-regulation of the NOTCH pathway in LGR5 high SW480 spheres compared to LGR5 low SW480 adherent cells. Red, genes up-regulated in LGR5 high spheres; green, genes down-regulated in LGR5 high spheres. The intensity of the color is correlated with fold change. All color labeled genes show a > threefold differential expression and pass a threshold of FDR < 0.05.
Fig. 3.
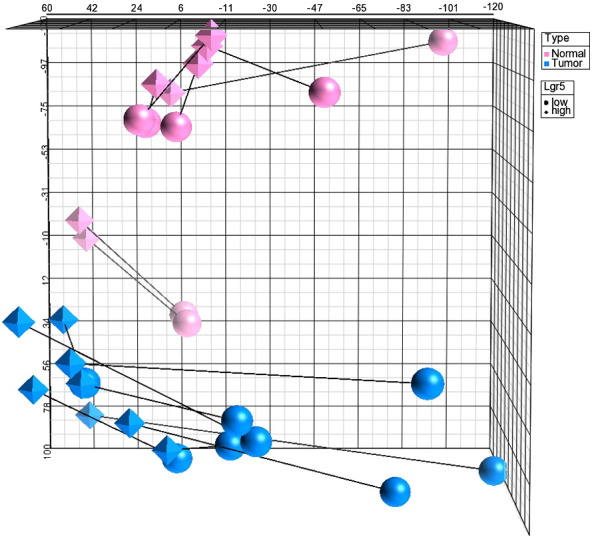
Principal component analysis shows a well separation between normal colons and AOM/DSS-induced tumors. Also, there is a well separation between Lgr5 high and low tumor cells. The separation between Lgr5 high and low normal colon cells is less pronounced. Paired Lgr5 high and low samples are linked by lines.
Acknowledgments
The authors thank Buddy Chen for IT-related support. Daniela Hirsch was supported by fellowships of the German Academic Exchange Service. This study was supported by the Intramural Research Program, National Institutes of Health, National Cancer Institute.
Contributor Information
Thomas Ried, Email: riedt@mail.nih.gov.
Timo Gaiser, Email: timo.gaiser@umm.de.
References
- 1.Barker N. Identification of stem cells in small intestine and colon by marker gene Lgr5. Nature. 2007;449:1003–1007. doi: 10.1038/nature06196. [DOI] [PubMed] [Google Scholar]
- 2.Neufert C. An inducible mouse model of colon carcinogenesis for the analysis of sporadic and inflammation-driven tumor progression. Nat. Protoc. 2007;2:1998–2004. doi: 10.1038/nprot.2007.279. [DOI] [PubMed] [Google Scholar]
- 3.Bongers G. The cytomegalovirus-encoded chemokine receptor US28 promotes intestinal neoplasia in transgenic mice. J. Clin. Invest. 2010;120:3969–3978. doi: 10.1172/JCI42563. [DOI] [PMC free article] [PubMed] [Google Scholar]
- 4.Hirsch D. LGR5 positivity defines stem-like cells in colorectal cancer. Carcinogenesis. 2014;35:849–858. doi: 10.1093/carcin/bgt377. [DOI] [PMC free article] [PubMed] [Google Scholar]