Abstract
With the aim to identify microRNAs that may contribute to oral squamous cell carcinoma (OSCC) progression, we compared the microRNA expression profiles of two related cell lines that form tumors with differential aggressiveness. A panel of 28 microRNAs was found to be more than 1.5-fold altered, among which miR-146a was the most significantly changed (-4.6-fold). Loss of miR-146a expression was validated in human high-grade tumors, while normal oral mucosa retained expression, using fluorescence in situ hybridization on a tissue microarray. Restoration of miR-146a in SCC25 and UMSCC1 cells decreased in vitro invasive activity, suppressed tumor growth in vivo, and decreased the incidence of UMSCC1 lung metastasis. The transcription factor Sox2 was found to be a putative target of miR-146a. In conclusion, the loss or decrease of miR-146a is a new feature that is associated with more aggressive behavior in oral squamous carcinoma.
Keywords: oral cancer, microRNA, miR-146a, metastasis
1. Introduction
Cancer of oral cavity is one of the most common malignancies worldwide, with 640,000 new diagnoses and more than 200,000 deaths worldwide annually (1–3). About 40% of all oral cancers occur in the tongue, where tumors frequently remain undetected until advanced stage. Patients with tongue cancer have a poorer survival rate relative to other anatomic sites in the oral cavity. Oral squamous cell carcinoma (OSCC) is the most common histopathologic type. The propensity for aggressive invasion and metastasis in OSCC pose a great challenge for clinical management. Patients with OSCC often suffer from severe morbidity and mortality that accompanies surgical resection. Thus, it is imperative to better understand the molecular mechanisms that underlie the aggressive behavior of oral cancers.
While many protein factors have been found to play a role in cancer onset and progression, for the past decade, non-coding RNAs, such as microRNAs, have drawn a lot of attention as potential cancer diagnostics or therapeutic targets (4, 5). Mature microRNAs are single strand short RNA molecules, 17–26 nucleotides in length. They typically inhibit the translation and stability of their target mRNA via imperfect pairing. Due to the wide use of next generation sequencing technology, a large number of microRNAs have been identified. By so far, the miRBase database (http://www.miRbase.org) has registered 2588 mature human microRNAs. Over 50 microRNAs, including miR-21, miR-7, miR-124, miR-134, and miR-155, have been reported in OSCC in the form of either overexpression or underexpression (6–9). However, controversies remain regarding the functional consequences caused by the alteration of individual microRNAs.
The goal of this study was to discover microRNAs that may contribute to OSCC progression and identify underlying regulatory mechanisms related to specific microRNAs. To this end, microRNA expression profiles relevant to aggressive OSCC were obtained by comparing microRNA profiles obtained from human OSCC cells that form invasive and poorly differentiated tumors in vivo (SCC25/plus cells) to the parental counterpart that forms well differentiated tumors in orthotopic xenografts (Scc25/vec) (10). The most highly dysregulated microRNA, miR-146a, was validated with human clinical OSCC materials. Functional assays confirmed the role of miR-146a as a metastasis suppressor and the transcription factor Sox2 was found to be a new putative target of miR-146a. Our data support that the loss of miR-146a is a contributor to OSCC aggressive behavior.
2. Materials and methods
2.1 Molecular cloning and viral vector preparation
Several viral constructs were made to express miR-146a or luciferase in cancer cells. Lentiviral pLL3.7 vector (eGFP as a selection marker) and retroviral pBabe vector (puromycin resistant gene as a selection marker) were obtained from Addgene, Inc. (Cambridge, MA). Human genomic DNA sequence including miR-146a mature sequence and its flanking area of about 250bp was amplified by PCR and cloned via T/A cloning method. They were then further sub-cloned into pLL3.7 between XhoI and HpaI sites and pBabe between EcoRI and BamHI sites respectively. Luciferase II sequence were subcloned from vector pQuasluc2 (Addgene) into pBabe vector, designated as pBabe-luc2, which was later used for creating luciferase positive cell sublines. Procedure for viral packaging, including cell lines and plasmids, were carried out per instruction from the supplier. Supernatant from packaging procedure, after centrifugation and filtration with 45 micron filters, were snap frozen in liquid nitrogen and stored at −80°C for later use to infect target cells. Plasmid pmirGlo was bought from Promega Corpartion (Madison, WI). Predicted target sequence for miR-146a in Sox2 mRNA was identified by RNA22 web-based bioinformatics tool (11). Sequence CCATGGGTTCGGTGGTCAAGTC and a mutated form CGATCGGTTCGGTGGTCAAGTC were cloned between Pme I and SbfI sites on the reporter vector as instructed by the user manual.
2.2 Cell lines and human cancer tissues
Human oral squamous carcinoma cell lines SCC25 and UMSCC1 were originally obtained from Dr. James Rhinewald (Brigham & Women’s Hospital, Boston, MA) and Dr. Tom Carey (University of Michigan) and were cultured in DMEM/F12 and MEM (Life Technology, Carlsbad, CA), respectively, supplemented with fetal bovine serum 10%, penicillin 20 units/ml and streptomycin 20 μg/ml. Cells were maintained in an atmosphere of 5 % CO2 and saturated moisture at 37°C. Two sublines of SCC25 cells were generated using either an empty vector pcDNA3 (designated SCC25/vec cells) or a pcDNA3 vector containing a construct for the urinary type plasminogen activator receptor (PLAUR) (designated SCC25/plus cells) as described previously (12). SCC25/plus cells were further used to re-express miR-146a with the lentiviral vector pLL3.7 bearing miR-146a and designated as 25p/146a, and empty vector control was designated as 25p/vec cells. Cells were purified by flow cytometry cell sorting based on eGFP expression from the viral vector. Similarly we created from UMSCC1 cells vector control (1-puro) and miR-146a overexpressing (1-146a) cells with the pBabe retroviral system and puromycin selection. For in vivo bioluminescence imaging, UMSCC1 cells were also engineered to express luciferase II and empty vector or luciferase II and miR-146a, designated as S12-vec and S12-146a cells, respectively. Commercially available human oral cancer tissue microarray sections, 5μm thick, were obtained from US Biomax, Inc. (Rockville, MD). The array consisted of 50 tissue cores, including 40 oral squamous cell carcinoma tissues and 10 adjacent normal oral mucosa tissues. As indicated by the manufacturer, all tissues were collected under the proper ethical protocols. The collection and use of de-identified archived human tissues were approved by Institutional Review Board at University of Notre Dame.
2.3 microRNA microarray
Total RNA samples were prepared from SCC25/vec and SCC25/plus cells with Trizol reagent per instructions from the manufacturer. After quantification and quality assurance with Agilent bioanalyzer for purity and sample integrity (RIN 9.4 or above), duplicate samples were sent to Exiqon (Vedbaek, Denmark) for labeling using the miRCURY™ Hy3™/Hy5™ power labeling kit and were then hybridized on the miRCURY™ LNA Array (v.10.0). Probe design was based on miRbase version 10. The data obtained is normalized to a common reference, the pooling of all submitted samples.
2.4 Murine orthotopic xenograft
Athymic nude mice, 4–6 weeks of age, were purchased from Harlan Laboratories, Inc. (Indianapolis, IN) and randomly divided into groups of indicated sized as specified for orthotopic xenograft experiments The initial experiment used inbred Balb/c foxn1−/− male, control 5 mice, experimental (miR-146a manipulated cells) 6 mice. A second cohort used male outbred foxn1−/−nude mice, 5 mice each for both control and miR-146a group. All animal studies were approved by Animal Care and Usage Committees (ACUC) at University of Missouri-Columbia and University of Notre Dame. Inoculation of cancer cells was as described previously (10). Briefly cultured cells were collected and resuspended in PBS. While mice were anesthetized using 2.5% isoflurane, cells (1.2 × 10⁶cell in 30μl PBS) were injected using a 1-mL syringe and a 32-gauge needle (Becton Dickinson) into the lateral border of the tongue just anterior to the junction of the anterior 2/3 and posterior 1/3 of the tongue. Tumor growth was monitored by visual inspection and by bioluminescence imaging.
2.5 Fluorescence in situ hybridization
The expression of microRNA in cancer tissues was measured by fluorescence in situ hybridization (FISH) as described previously, with the use of tyramide signal amplification (TSA) system (13). Human miR-146a mature sequence is: UGAGAACUGAAUUCCAUGGGUU. Locked nuclear acid (LNA)-based probe sequence targeting miR-146a is AACCCATGGAATTCAGTTCTCA, 5′-DIG labeled. Negative controls used scrambled-miR LNA detection probe, 5′-DIG labeled, the probe sequence is: GTGTAACACGTCTATACGCCCA. Both were ordered from Exiqon, Inc. (Woburn, MA, USA). Mouse anti-digoxigenin and HRP-conjugated anti-digoxigenin antibodies were obtained from Roche Applied Science (Indianapolis, IN). TSA-Cyanine 5 kit (NEL705A) was from Perkin-Elmer (Waltham, MA). ProLong mounting media containing 4′, 6-diamidino-2-phenylindole (DAPI) was from Invitrogen (Carlsbad, CA). The entire FISH procedure includes pretreatment of the slides, pre-hybridization, hybridization, stringency wash and post-hybridization immunohistochemistry. Negative control slides were included and were treated equally but with scrambled probe or without any probe in hybridization step. Sealed sections were examined by Olympus DSU Spinning Disc microscope equipment with proper filter sets for DAPI and Cy5. Setting background level with negative controls, the presence of signal in more than 10% squamous epithelial cells was deemed positive.
2.6 Cell invasion assays
Transwell invasion assay was used for testing cell migration and invasion ability. Boyden chamber inserts (8μm pores) and Matrigel were bought from BD Bioscience (San Jose, CA). The chambers were prepared by thawing Matrigel at 4°C, and then 100μl of the thawed Matrigel were added to each insert. After incubating at room temperature for 1 h, unsolidified liquid was gently removed by pipette. Inserts were rinsed and briefly air dried. Cell suspensions were made at a final concentration of 500,000 cells/ ml. 750μl of conditioned medium was added to the well and 500 μl of prepared cells added to the insert. Plates were incubated at 37°C for 24 h, and stopped by using Diff-quick staining kit. Cells migrating to bottom side of the inserts were fixed, stained, and counted.
2.7 Histology and immunohistochemistry
Tumor and other tissues harvested from mice were fixed in 10% neutral buffered formalin for 24h, and then routinely processed into paraffin blocks. Sections were made at 5μm thick for hematoxylin and eosin staining and for immunohistochemistry. The later were performed with ImmPRESS® method according to instruction from Vector Lab (Burlingame, CA). Briefly, sections were first deparaffinized and rehydrated. Then sections were treated with citrate buffer (pH6.0) for antigen retrieval and 3% H2O2 for quenching endogenous peroxidase sequentially. Normal horse serum was used for non-specificity blocking, 30 min at room temperature. Monoclonal anti-human pan cytokeratin (AE1/AE3), 1:100 diluted, from Dako (Denver, CO) was incubated at 4°C overnight. Rabbit monoclonal anti-Sox2 (1: 800) and polyclonal anti-Ki67 (1:1000) were obtained from Abcam (Cambridge, MA). ImPRESS reagent with anti-mouse IgG or with anti-rabbit IgG (Vector Lab) was then applied and incubated at room temperature for 30 min. Phosphate buffer saline (PBS) wash was used in between all steps. After visualization with peroxidase substrate DAB, sections were counterstained with hematoxylin, cleared and mounted. Quantification of Sox2 and Ki67 staining results were performed with macros built on the nuclear IHC algorithm, which is part of the Image Analysis Tools in the Aperio ePathology system (Vista, CA). Percentages of all levels of positively stained tumor cells were reported for comparison between groups (14).
2.8 Quantitative PCR
Quantitative measurement of miR-146a expression level in cells used SYBR Green I (dye for double stranded DNA) method. The reverse transcription kit and primer set were bought from SABioscience/Qiagen (Valencia CA). Q-PCR for Sox2 gene and GAPDH used Taqman methods (5′ nuclease assays), primer and probe sets were bought from Integrated DNA technology and Life Technology respectively. All reactions were run Bio-Rad iQ5 or ABI StepOnePlus real time thermal cycler. Quantification was calculated with ΔΔCt method using control samples and the expression of house-keeping gene PGK for normalization.
2.9 Western blot analysis
Primary antibodies were obtained for TRAF6 (Satan Cruz Biotech) and Sox2 (R&D systems), β-actin and GAPDH (Sigma-Aldrich) antibodies were used for loading control. Briefly, cell lysates were prepared by incubation for 5 min on ice in RIPA buffer supplemented with proteinase inhibitor cocktail (Roche). Equal amount (usually 20 μg) of total protein per sample were loaded and separated by SDS-PAGE. After transferring onto PVDF membranes (Millipore), they were blocked with 10% skim dry milk. Incubated with appropriate antibodies were performed at 4°C overnight, followed by plenty wash and appropriate incubation with HRP-labeled secondary antibodies. The presence of protein band signals were detected using an ECL reagents kit (Thermo Pierce) and images were captured with GE LAS400 gel documentation system.
2.10 Luciferase Reporter Assay
Dual-Luciferase reporter assay kit was from Promega Corpartion (Maddision, WC). SCC1 oral cancer cells were transfected with miR-146a expressing vector plus pmirGlo empty vector, pmirGlo with Sox2 target sequence and pmirGlo with the mutated sequence respectively as indicated in Fig 6, using Noen® electroporation transfection system from Life Tech (Carlsbad, CA). 1×10⁶ cells per 10 μl volume per well were seeded and grown for 24 hours on 24-well plate after electroporation. Then media were removed. Cells were washed once with PBS, then added to each well was 100μl passive lysis buffer. Photon intensity was read out on 20/20 Luminometer (Promega). First read, i. e. firefly luciferase activity were made by mixing up 20 μl of lysis and 100 μl of LARII (luciferase assay substrate resuspended with luciferase assay buffer II) in a 1.5 ml microcentrifuge tube. After that, 100 μl of Stop &Glo reagent were added to each tube for a second readout from the activity of Renilla luciferase, which was used as normalizer.
Figure 6. Identification of Sox2 as a miR-146a target.
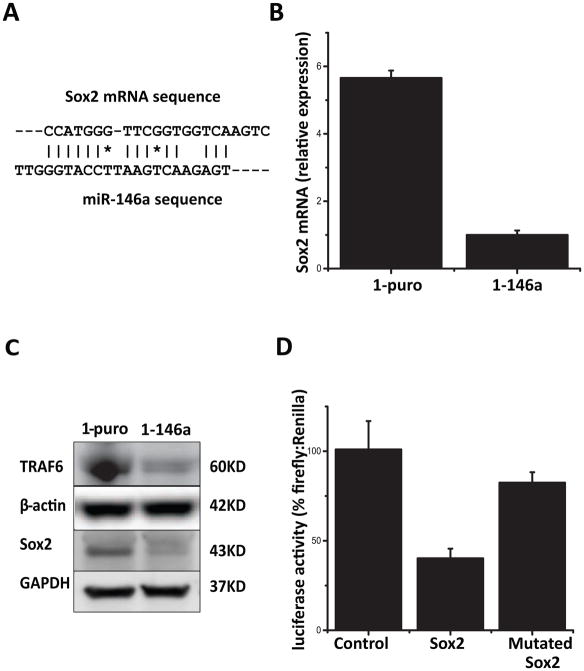
(A) A target sequence was found using RNA22 web-based bioinformatics tool in the coding area of Sox2 gene, with perfect pairing near the 3′ end instead of the canonical seed sequence. (B) Sox2 mRNA levels in UMSCC1 derived control cells (1-puro) and miR-146 restored cells (1-146a) as determined by qPCR, P<0.05. (C) Protein levels of TRAF6 and Sox2 were detected by Western blot in 1-puro and 1-146a cells. GAPDH and β-actin were included as loading controls. (D) Dual luciferase reporter assay (pmirGlo) was used to evaluate the effect of miR-146a expression on the activity of reporter gene fused with putative target sequence from Sox mRNA or its mutant form. Comparison was made between Sox2 group and control, P<0.05.
2.11 Bioluminescence imaging
Luciferase substrate D-Luciferin sodium salt was bought from Sigma-Aldrich (St Louis, MO). Tumor-bearing mice were administered via intraperitoneal injection with a dose of D-Luciferin 150mg/kg, using 1ml syringe attached to 25G needle. Images were taken 10 min after on IVIS Lumina from Xenogen/Caliper LifeScience (Hopkinton, MA). Bioluminescence imaging (BLI) analysis was performed with Living Image software (Xenogen) by measuring photon flux of the region of interest over time and presented as average radiance (p/s/cm2/sr).
2.12 Statistical analysis
Numeric data were organized with Microsoft Excel and presented as average ± standard deviation. Average comparison between groups was performed with unpaired two-sided Student’s t test. Frequency data comparison used Chi-square test. Statistical significance level was set at P value <0.05.
3. Results
3.1 Loss of miR-146a expression is associated with aggressive oral cancer
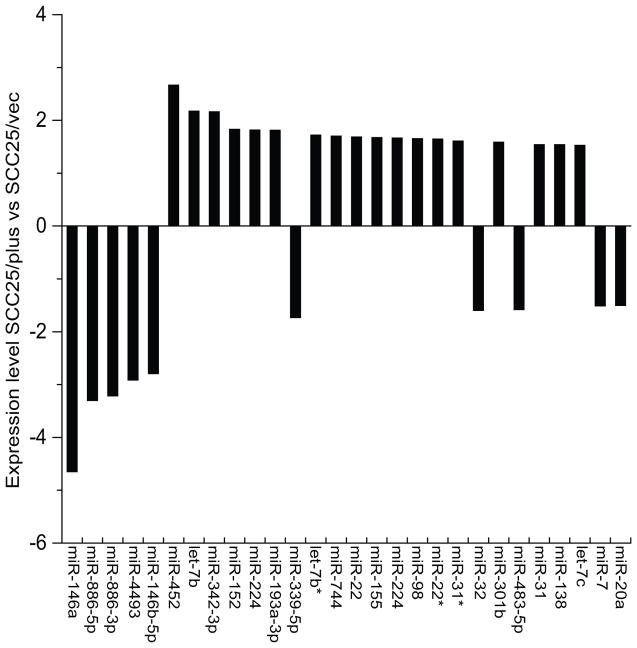
SCC25/plus cells behave highly aggressively in vitro and in vivo, relative to vector controls, forming poorly differentiated invasive tumors with perineural and vascular invasion (10, 15). The known involvement of microRNAs in cancer progression prompted us to search for microRNAs that contribute to oral cancer aggressiveness or metastasis. Using LNA-based microRNA microarray, we compared the global microRNA expression profiles of the aggressive SCC25/plus cells to the corresponding vector control line SCC25/vec, as described in Methods. A total of 28 microRNAs out of 255 detectable features were found to be differentially expressed >1.5 fold (Fig. 1). The most significantly altered microRNA was the downregulated microRNA miR-146a (-4.65-fold).
Figure 1. Comparative microRNA profile of oral cancer cell lines.
Expression profiles of SCC25/plus cells, which overexpress PLAUR and grow as invasive poorly differentiated tumors in vivo were compared to parental SCC25 cells (designated SCC25/vec). Total RNA samples were extracted from SCC25/vec and SCC25/plus cells and microRNA was performed in duplicate on Exiqon’s miRCURY LNA™ microRNA arrays (v.10.0). Expression level is presented as the log 2 ratio of SCC25/plus vs SCC25/vec cells.
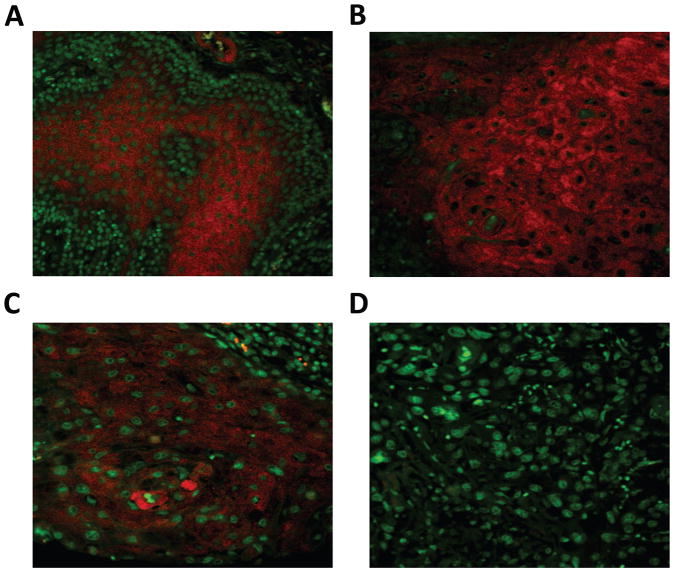
Focusing on the most significantly dysregulated microRNA, miR-146a, we examined expression with fluorescence in situ hybridization (FISH) in human oral cancer tissues under optimized conditions (13), using the powerful tyramide signal amplification system (Fig 2, Table 1). In this study, 8 out of 10 (80%) normal mucosal squamous epithelia are positive (Fig 2A); signals were located predominantly in the middle layer of spinous/prickle cells while basal cells lacked signal. Expression of miR-146a was inversely proportional to tumor grade (Fig. 2B–D). Cancer tissues with low-grade histology (well differentiated) were 92.9% positive for miR-146a expression, while high-grade poorly differentiated tumors were only 40.9% positive. A significant correlation between the positivity and histological grading was observed (P<0.05).
Figure 2. Fluorescence in situ hybridization (FISH) detection of miR-146a in human OSCC.
Tissue microarray sections containing 10 human normal oral mucosa cores and 50 oral squamous carcinoma (OSCC) cores were hybridized with LNA-based digoxigenin labeled miR-146a probe. Positive signal was amplified by tyramide signal amplification system (Cy5) and visualized with fluorescence microscopy. Shown are photomicrographs from (A) normal squamous epithelium, (B) OSCC histologic grade 1, (C) OSCC grade 2 and (D) OSCC grade 3. Magnification 400×, scale bar=20μm.
Table 1.
Expression of miR-146a in human oral cancer tissues
| Histological grading | I, I–II (low-grade) | II, II–III, III (high-grade) | Normal |
|---|---|---|---|
| miR-146a negative | 2 (7.1%) | 13 (59.1%) | 2 (20%) |
| miR-146a positive | 26 (92.9%) | 9 (40.9%) | 8 (80%) |
| Total | 28 | 22 | 10 |
As illustrated in Fig 2, FISH stains were performed on OSCC tissue microarray with LNA-based human mir-146a probe labeled with DIG at 5′ end. Positivity comparison between low-grade and high-grade groups (X2 test, P<0.05).
3.2 Restoration of mir-146a expression alters aggressive behavior in vitro and in vivo
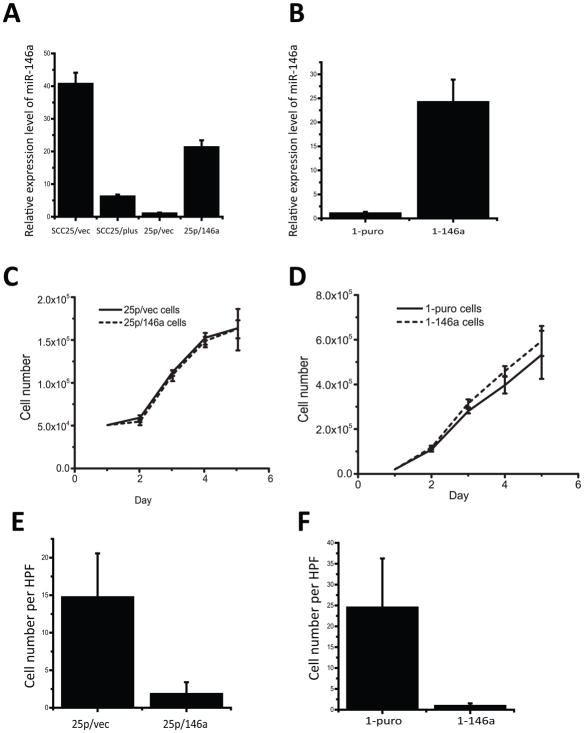
As analysis of human tumors validated the loss of miR-146a in specimens with high-grade histology, in vitro experiments were performed to assess the effect of miR-146a restoration on cell behavior. To this end, we generated a panel of sublines with manipulated miR-146a expression. Initially, loss of miR-146a expression in SCC25/plus was verified by quantitative PCR (relative to SCC25/vec; Fig 3A), demonstrating a 6.5-fold downregulation. Expression of miR-146a was restored in aggressive SCC25/plus cells, designated as 25p/146a relative to 25p/vec control cells (Fig. 3A) or in UMSCC1 cells, designated 1-146a relative to 1-puro control cells (Fig. 3B). Note that expression was restored to physiologic levels. No significant effects of miR-146a expression on proliferation were observed (Fig. 3C, D). However in transwell invasion assays, restoration of miR-146a expression significantly decreased invasive activity, with an 8.1 and 26.9-fold decrease in invasiveness in miR-146a-restored SCC25 cells (25p/146a; Fig. 3E) and UMSCC1 cells (1-146a; Fig. 3F), respectively.
Figure 3. Restoration of miR-146a expression inhibits oral cancer cell invasion.
(A) Quantitative PCR (pPCR) analysis of miR-146a expression validates loss of miR-146a in SCC25/plus relative to parental SCC25/vec cells. Using viral vectors, expression of miR-146a was restored to physiologic levels in SCC25/plus cells (designated 25p/146a), relative to vector controls (25p/vec). (B) Viral vectors were used to restore miR-146a expression in UMSCC1 cells (designated 1-146a) relative to vector controls (1-puro). Levels of miR-146a were assessed by qPCR. (*) p<0.05. (C), (D) Growth curves of (C) 25p/vec, 25p/146a and (D) 1-puro, 1-146a cells were obtained by daily counting. No statistically significant differences in proliferation were observed. (E), (F) Boyden chamber Matrigel invasion assays for cells derived from (E) SCC25/plus (25p/vec vs 25/146a) and (F) UMSCC1 cells (1-puro vs 1-146a). 250,000 cells in 500μl per well were added to the upper chamber and incubated for 24 h prior to stopping the assay using Diff-quick stain and enumeration of cells migrating to the lower chamber. The average cell numbers per high-power field (HPF) were compared. A significant decrease (p<.05) in invasion is observed in cells expressing miR-146a.
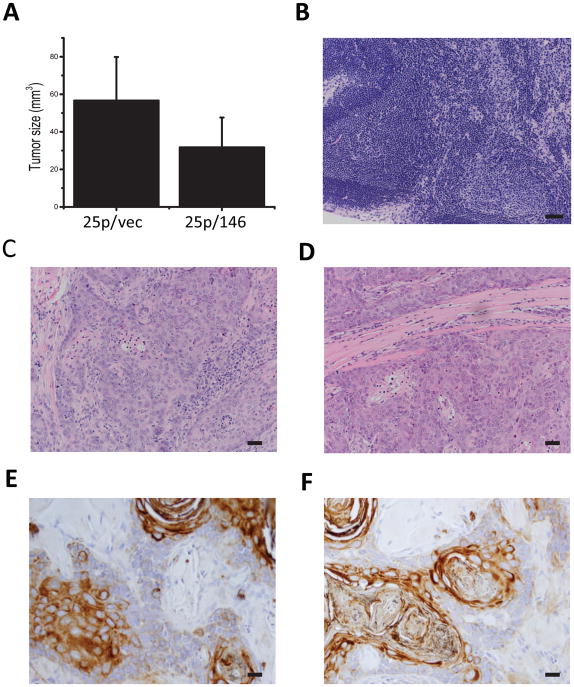
To examine the effect of miR-146a restoration on progression, we used an orthotopic xenograft model in which human oral cancer cells were injected in the tongues of nude mice (10). Initial experiments utilized miR-146a-restored SCC25 cells (25p/146a) or vector control cells (25p/vec). Mice were sacrificed 8 weeks after inoculation; tumor bearing tongues were resected and measured for tumor size. The average tumor size was significantly smaller in the miR-146a-restored group relative to the control group (Fig 4A, P<0.05). As previously reported using this cell line (10), no metastatic lesions were found in local lymph nodes (Fig. 4B) or in major organs such as lung and liver. There was also no obvious difference in the histological appearance of the xenograft tumors as evaluated by H&E (Figs. 4C, D) or cytokeratin staining (Fig 4E, F).
Figure 4. Restoration of miR-146a inhibits tumorigenicity in SCC25 xenografts.
Using an orthotopic xenograft model, the tumor forming ability of SCC25 derived 25p/vec and 25p/146a cells was tested by tongue injection. Cells (1.2×10⁶ cells in 30μl) were injected and tumor growth was monitored for 8 weeks prior to sacrifice and analysis. (A) Tumor volume (V) was calculated based on measured longest diameter (a) and the perpendicular (b) with calipers using formula: V=(a*b^2)/2. A significant difference in tumor volume was observed between tumors generated from 25p/vec and 25p/146a cells, P<0.05. (B) Hematoxylin & eosin (H&E) staining of a representative lymph node. Magnification 200×, scale bar=50μm. (C, D) H&E staining of primary tumor generated by (C) 25p/vec and (D) 25p/146a cells. Magnification 200×. (E, F) Immunohistochemical staining of pan-cytokeratin (AE1/AE3) on tumors derived from (E) 25p/vec and (F) 25p/146a cells. Magnification 400×, scale bar=20μm.
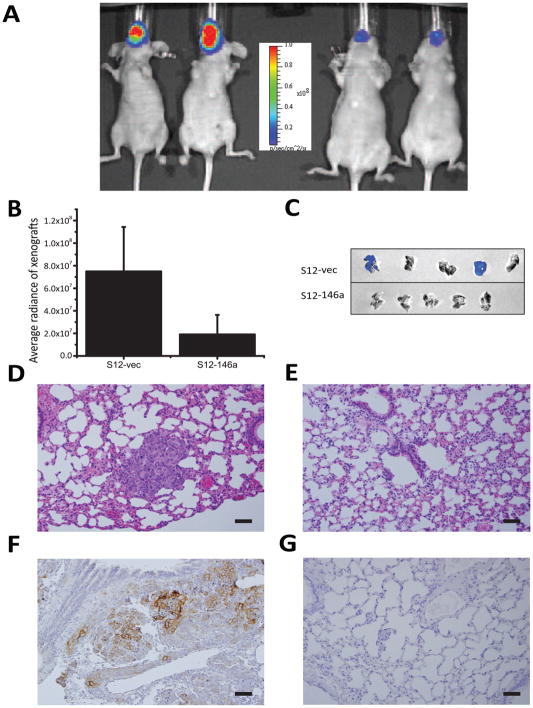
To confirm the effect of miR-146a restoration on tumor growth in vivo, additional experiments were performed using luciferase-expressing miR-146a-restored UMSCC1 cells (S12-146a) or vector controls (S12-vec). Cells were injected orthotopically into the tongue and mice were sacrificed at 5 weeks. Similar to results observed using SCC25 cells, tumors generated using mir-146a-restored UMSCC1 (S12-146a) cells were significantly smaller than tumors generated using the control S12 cells as measured by bioluminescence imaging (Fig 5A, B). While in vivo imaging did not detect lung metastasis, metastatic lung lesions were detected in 2/5 lungs in the control group by ex vivo imaging, with no lung metastasis detected in tumors generated using the miR-146a-restored cells (Fig. 5C). The metastatic lesions in control lungs were confirmed by microscopic examination with H&E staining (Fig. 5D) while lungs from S12-146a mice were negative (Fig. 5E). The presence of metastatic squamous carcinoma cells in the lungs of S12-vec animals was further confirmed by positive pan-cytokeratin (AE1/AE3) immunohistochemistry (Fig. 5F), while lungs of S12-146a mice were negative (Fig. 5G).
Figure 5. Restoration of miR-146a decreases tumorigenicity and metastasis in UMSCC1 xenografts.
Both a luciferase 2 reporter gene and miR-146a gene (or vector control) were engineered into UMSCC1 vector control (S12-vec) or miR-146a-restored cells (S12-146a) to enable the use of bioluminescence imaging for in vivo monitoring and quantitation of tumor growth. (A) Representative image of mice bearing the orthotopic xenograft imaged on IVIS Lumina (left panel - S12-vec; right panel - S12-146a). (B) Comparison of tumor size of S12-vec control cell derived tumor vs S12-146a tumors, quantified using bioluminescence images (BLI), p<0.05. (C) Lung metastasis identified by ex vivo BLI in 2/5 lungs in the control group (upper panel), 0/5 in the miR-146a-restored group (lower panel). (D, E) Hematoxylin & eosin staining of lung tissue from (D) S12-vec control or (E) S12-146a miR-restored mice. Note the presence of nests of tumor cells in control lungs (D). 200× magnification. (F, G) Immunohistochemical staining of pan-cytokeratin (AE1/AE3) in lungs of (F) S12-vec control or (G) S12-146a miR-restored mice. Cytokeratin staining demonstrates metastatic lesions in control lungs. Original magnification for microphotographs was 200×, scale bar=50μm.
3.3 Sox2 is a putative target for miR-146a
To identify potential novel mRNA targets of miR-146a, we performed cDNA microarray-based expression profiling on 1-puro and 1-146a cells (data not shown) and observed differential expression of Sox2. Using the web-based bioinformatic tool RNA22, a target site for miR-146a was found in the coding region of transcription factor Sox2 mRNA, with a 6 nucleotide match near the 3′ end (Fig 6A). Q-PCR was performed to verify that Sox2 mRNA indeed was downregulated in UMSCC1 derived 1-146a cells relative to the corresponding vector control cells (Fig 6B). These results were confirmed by Western blotting for Sox 2 as well as the known miR-146a target TRAF6 (Fig 6C).
To further verify that Sox2 is bona fide target for miR-146a, we utilized a luciferase reporter assay for testing the effects of the target sequence in Sox2 mRNA. The putative binding site from the Sox2 coding region was amplified by PCR and then sub-cloned into the dual reporter plasmid pmirGlo. When co-transfected into UMSCC1 cells along with the miR-146a expressing vector pBabe/146a, decreased reporter luciferase intensity was observed indicating that Sox2 is an effective target of miR-146a (Fig. 6D). Moreover, a mutated form of Sox2 reporter with a 2-nucleotides change in the putative miR-146a target sequence was not regulated by miR-146a (Fig 6D).
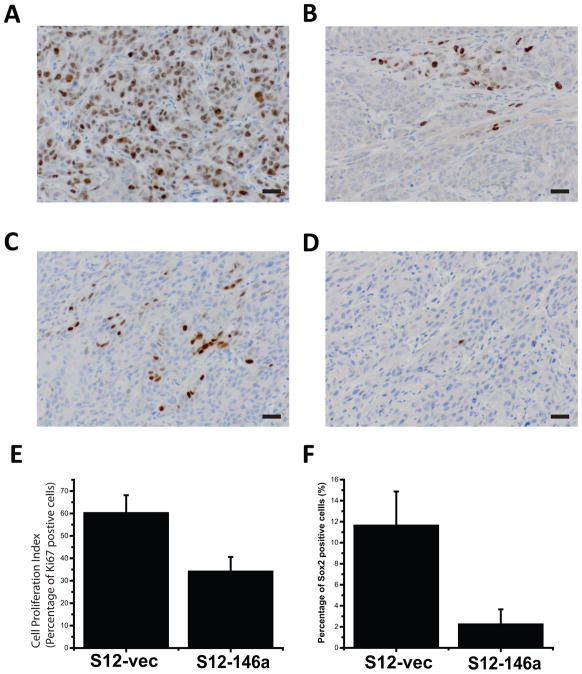
To validate differential Sox2 expression in tumors generated from miR-146a modified cells, immunohistochemical analysis of Sox2 was performed. Proliferation status, as assessed by Ki67 IHC, was also determined. The percentage of positively stained tumor cells was quantified with the Aperio ePathology system. Tumors from UMSCC1 miR-146a expressing cells exhibited lower levels of Sox2 staining and had a lower proliferation index relative to control (Fig. 7A–F). Both differences were statistically significant (P<0.05).
Figure 7. Expression Sox2 and cell proliferation in xenografts.
With immunohistochemistry and Aperio digital pathology image analysis tools, the expression levels of Sox2 and cell proliferation marker Ki67 in xenograft tumors were detected and quantified. (A) and (B) show representative fields of high and low percentage positive stain for Ki67, respectively. (C) and (D) show representative fields of high and low percentage positive stain for Sox2, respectively. Original magnification 400×, scale bar=20μm. (E) and (F) show quantitative comparison between control (n=5) and miR-146 overexpressing (n=5) groups in terms of Ki67 and Sox2 expression respectively. Both differences were statistically significant (P<0.05).
4. Discussion
Studying microRNAs in the context of specific disease or biological process continues to be of great value as many microRNAs have shown significant potential in diagnosis and therapy. Profiling microRNA expression in oral squamous cell carcinoma (OSCC) tissues has been reported in the literature, often with microarray or quantitative PCR-based methods (16, 17). A microRNA signature was found potentially useful for identifying leukoplakias at risk of malignant transformation (18). The current study was initiated with the assumption that specific microRNAs regulate oral cancer cell aggressive behavior and thereby contribute to metastasis in OSCC. Our strategy was to compare microRNA expression profiles from paired human OSCC cell lines previously demonstrated to form aggressive, invasive tumors in vivo (10), followed by FISH validation in a cohort of human tumors. While several differentially regulated microRNAs were observed, mir-146a is the most significantly altered. We chose to limit our study to this particular microRNA. Loss of miR-146a with increasing tumor grade was confirmed in the cohort of human tumors. Functional characterization demonstrated that restoring or increasing the expression of miR-146a inhibits invasion, tumorigenicity, and metastasis. Based on both in vitro and in vivo functional assays, our data support the classification of miR-146a as a metastasis suppressor microRNA.
Mir-146a was initially shown to be an inhibitor of TNF receptor-associated factor 6 (TRAF6) and IL-1 receptor-associated kinase 1 in the innate immune response and was found to be induced by NF-κB activation (19). Recently it was revealed that specific aspects of Treg suppressor function are mediated by miR-146a (20). It has also been associated with 5q syndrome (21). A more conclusive study with a miR-146a knockout mouse model showed that miR-146a has critical roles in inflammation, myeloid cell proliferation, and oncogenic transformation (22). The relationship between mir-146a expression and cancer metastasis was first noted in breast cancer and later similar findings appeared in other cancers as well (23–25). The involvement of miR-146a has also been reported in the onset and progression of multiple types of cancers, including breast, esophageal, and prostate cancer. There are a few, but contradicting, reports in oral cancer. A recent study reported that a G to C polymorphism (rs2910164) in pre-miR-146a was prevalent in OSCC patients with lymph node metastasis (26). In contrast, analysis of clinical OSCC specimens with and without metastasis identified loss of miR-146a in association with progression to metastatic tumors (27). Polymorphism within the genomic sequence for the pre-mir-146a regulatory area has been reported to be associated with several cancers (26, 28–30). The G to C polymorphism (rs2910164) in pre-mir-146a was not found in our cell lines. Histological grade is well-characterized predictor of oral cancer outcome (31). Using fluorescent in situ hybridization on microarrayed OSCC tissues, our study confirmed a statistically significant loss of mir-146a expression in less differentiated (high-grade) oral cancer. Further study with a larger cohort of well-annotated specimens is needed for additional insights on the role of miR-146a in oral cancer. However the localization pattern and positivity in relation to differentiation status support the idea that the loss of miR-146a is associated with the development of more aggressive oral cancer.
Multifaceted cellular changes result from microRNA modulation, due to their numerous potential mRNA targets. Canonical theory contends that microRNAs impose their function by pairing up with their mRNA targets in the 3′ UTR via nucleotides 2–8, designated as the ‘seed sequence’. The use of bioinformatic tools to identify seed sequence-based microRNA targets predicts hundreds to thousands of mRNA targets for a single microRNA, many of which cannot be experimentally verified. On the other hand, a subset of biologically relevant microRNA recognition elements do not contain a canonical seed sequence and may not even be located in the coding region (32, 33). Protein coding areas have been reported as potential microRNA targeting sites for transcription factors. For example, miR-134 targets Sox2 in the coding region (32). The global changes in putative miR-146a targets predicted by popular algorithms have not been observed in the tissues of knockout mice (22). A powerful strategy in identifying microRNA targets is to pull down all the miRNA/mRNA complexes by labeled synthetic microRNA and use deep sequencing to identify differential mRNA (34).
In the current study, we identified Sox2 mRNA as a potential new target of miR-146a. Both qPCR and Western blot validated the downregulation of Sox2 in miR-146a overexpressing cells and dual luciferase reporter assays confirmed the target sequence. Immunohistochemistry results also revealed that xenograft tumors from cells with higher miR-146a expression had lower expression of Sox2 and lower proliferation index as well, supporting an inhibitory effort by miR-146a on Sox2 in regulation. Sox2 is a member of the SOX (SRY-related high mobility group box) family and was initially described in the context of embryonic stem cell pluripotency. It was also one of four transcription factors used in making induced pluripotent stem cells (35). Sox2 expression is closely related to poor prognosis in oral tongue squamous cell carcinoma (36). Silencing Sox2 induced mesenchymal-epithelial transition (37), which is quite consistent with the localization of miR-146a within the layers of normal stratified squamous epithelium in oral mucosa. More recent studies show that Sox2 overexpression is associated with invasion and metastasis in esophagus squamous cell carcinoma and promotes laryngeal cancer progression (38, 39). Our data demonstrating that Sox2 is a mir-146a target provide a novel mechanism by which loss of miR-146a may enhance OSCC progression to metastasis. It should be noted that other microRNAs, such as miR-124 and miR-134, have also been found to be involved in oral cancer progression (8, 9). Additional research using a large cohort of clinical materials is needed to ascertain which microRNAs or panel of microRNAs are the dominant regulators of oral cancer progression.
In conclusion, we have identified in oral squamous cell carcinoma that the loss or decrease of miR-146a is associated with more aggressive behavior. Re-expression of miR-146a inhibits oral cancer cell aggressiveness in vitro and in vivo. Modulation of Sox2 and its downstream targets by miR-146a was suggested as a novel mechanism for regulation of tumor progression and metastasis.
Highlights.
Decrease of miR-146a expression was found associated with the aggressiveness of oral cancer.
Restoration of miR-146a in cancer cells decreased in vitro invasive activity and suppressed tumor growth and metastasis.
Transcription factor Sox2 was found to be a putative target of miR-146a.
Acknowledgments
This work was partially supported by NIH/NCI RO1CA085870 to M. S. Stack. We thank all members in Stack lab for academic discussion and technical assistance.
Footnotes
Disclosure statement
The authors have nothing to disclose.
Publisher's Disclaimer: This is a PDF file of an unedited manuscript that has been accepted for publication. As a service to our customers we are providing this early version of the manuscript. The manuscript will undergo copyediting, typesetting, and review of the resulting proof before it is published in its final citable form. Please note that during the production process errors may be discovered which could affect the content, and all legal disclaimers that apply to the journal pertain.
References
- 1.Jiang R, Shi Z, Johnson JJ, Liu Y, Stack MS. Kallikrein-5 promotes cleavage of desmoglein-1 and loss of cell-cell cohesion in oral squamous cell carcinoma. J Biol Chem. 2011;286(11):9127–9135. doi: 10.1074/jbc.M110.191361. [DOI] [PMC free article] [PubMed] [Google Scholar]
- 2.Jemal A, Bray F, Center MM, Ferlay J, Ward E, Forman D. Global cancer statistics. CA Cancer J Clin. 2011;61(2):69–90. doi: 10.3322/caac.20107. [DOI] [PubMed] [Google Scholar]
- 3.Johnson J, Shi Z, Liu Y, Stack MS. Inhibitors of NF-kappaB reverse cellular invasion and target gene upregulation in an experimental model of aggressive oral squamous cell carcinoma. Oral Oncol. 2014;50(5):468–477. doi: 10.1016/j.oraloncology.2014.02.004. [DOI] [PMC free article] [PubMed] [Google Scholar]
- 4.Valastyan S, Weinberg RA. Assaying microRNA loss-of-function phenotypes in mammalian cells: emerging tools and their potential therapeutic utility. RNA Biol. 2009;6(5):541–545. doi: 10.4161/rna.6.5.10081. [DOI] [PubMed] [Google Scholar]
- 5.Farazi TA, Hoell JI, Morozov P, Tuschl T. MicroRNAs in Human Cancer. Adv Exp Med Biol. 2013;774:1–20. doi: 10.1007/978-94-007-5590-1_1. [DOI] [PMC free article] [PubMed] [Google Scholar]
- 6.Chen D, Cabay RJ, Jin Y, Wang A, Lu Y, Shah-Khan M, et al. MicroRNA Deregulations in Head and Neck Squamous Cell Carcinomas. Journal of oral & maxillofacial research. 2013;4(1):e2. doi: 10.5037/jomr.2013.4102. [DOI] [PMC free article] [PubMed] [Google Scholar]
- 7.Liu X, Chen Z, Yu J, Xia J, Zhou X. MicroRNA profiling and head and neck cancer. Comparative and functional genomics. 2009:837514. doi: 10.1155/2009/837514. [DOI] [PMC free article] [PubMed] [Google Scholar]
- 8.Hunt S, Jones AV, Hinsley EE, Whawell SA, Lambert DW. MicroRNA-124 suppresses oral squamous cell carcinoma motility by targeting ITGB1. FEBS Lett. 2011;585(1):187–192. doi: 10.1016/j.febslet.2010.11.038. [DOI] [PubMed] [Google Scholar]
- 9.Liu CJ, Shen WG, Peng SY, Cheng HW, Kao SY, Lin SC, et al. miR-134 induces oncogenicity and metastasis in head and neck carcinoma through targeting WWOX gene. Int J Cancer. 2013 doi: 10.1002/ijc.28358. [DOI] [PubMed] [Google Scholar]
- 10.Ghosh S, Koblinski J, Johnson J, Liu Y, Ericsson A, Davis JW, et al. Urinary-type plasminogen activator receptor/alpha 3 beta 1 integrin signaling, altered gene expression, and oral tumor progression. Mol Cancer Res. 2010;8(2):145–158. doi: 10.1158/1541-7786.MCR-09-0045. [DOI] [PMC free article] [PubMed] [Google Scholar]
- 11.Loher P, Rigoutsos I. Interactive exploration of RNA22 microRNA target predictions. Bioinformatics. 2012;28(24):3322–3323. doi: 10.1093/bioinformatics/bts615. [DOI] [PubMed] [Google Scholar]
- 12.Shi Z, Liu Y, Johnson JJ, Stack MS. Urinary-type plasminogen activator receptor (uPAR) modulates oral cancer cell behavior with alteration in p130cas. Mol Cell Biochem. 2011;357(1–2):151–161. doi: 10.1007/s11010-011-0885-3. [DOI] [PubMed] [Google Scholar]
- 13.Shi Z, Johnson JJ, Stack MS. Fluorescence In Situ Hybridization for MicroRNA Detection in Archived Oral Cancer Tissues. J Oncol. 2012;2012:903581. doi: 10.1155/2012/903581. [DOI] [PMC free article] [PubMed] [Google Scholar]
- 14.Rexhepaj E, Brennan DJ, Holloway P, Kay EW, McCann AH, Landberg G, et al. Novel image analysis approach for quantifying expression of nuclear proteins assessed by immunohistochemistry: application to measurement of oestrogen and progesterone receptor levels in breast cancer. Breast Cancer Res. 2010(5):R89. doi: 10.1186/bcr2187. [DOI] [PMC free article] [PubMed] [Google Scholar]
- 15.Shi Z, Liu Y, Johnson JJ, Stack MS. Urinary-type plasminogen activator receptor (uPAR) modulates oral cancer cell behavior with alteration in p130cas. Mol Cell Biochem. 2011 doi: 10.1007/s11010-011-0885-3. [DOI] [PubMed] [Google Scholar]
- 16.Soga D, Yoshiba S, Shiogama S, Miyazaki H, Kondo S, Shintani S. microRNA expression profiles in oral squamous cell carcinoma. Oncol Rep. 2013;30(2):579–583. doi: 10.3892/or.2013.2488. [DOI] [PubMed] [Google Scholar]
- 17.Chang SS, Jiang WW, Smith I, Poeta LM, Begum S, Glazer C, et al. MicroRNA alterations in head and neck squamous cell carcinoma. Int J Cancer. 2008;123(12):2791–2797. doi: 10.1002/ijc.23831. [DOI] [PMC free article] [PubMed] [Google Scholar]
- 18.Cervigne NK, Reis PP, Machado J, Sadikovic B, Bradley G, Galloni NN, et al. Identification of a microRNA signature associated with progression of leukoplakia to oral carcinoma. Hum Mol Genet. 2009;18(24):4818–4829. doi: 10.1093/hmg/ddp446. [DOI] [PubMed] [Google Scholar]
- 19.Taganov KD, Boldin MP, Chang KJ, Baltimore D. NF-kappaB-dependent induction of microRNA miR-146, an inhibitor targeted to signaling proteins of innate immune responses. Proc Natl Acad Sci U S A. 2006;103(33):12481–12486. doi: 10.1073/pnas.0605298103. [DOI] [PMC free article] [PubMed] [Google Scholar]
- 20.Lu LF, Boldin MP, Chaudhry A, Lin LL, Taganov KD, Hanada T, et al. Function of miR-146a in controlling Treg cell-mediated regulation of Th1 responses. Cell. 2010;142(6):914–929. doi: 10.1016/j.cell.2010.08.012. [DOI] [PMC free article] [PubMed] [Google Scholar]
- 21.Starczynowski DT, Kuchenbauer F, Argiropoulos B, Sung S, Morin R, Muranyi A, et al. Identification of miR-145 and miR-146a as mediators of the 5q- syndrome phenotype. Nat Med. 2010;16(1):49–58. doi: 10.1038/nm.2054. [DOI] [PubMed] [Google Scholar]
- 22.Boldin MP, Taganov KD, Rao DS, Yang L, Zhao JL, Kalwani M, et al. miR-146a is a significant brake on autoimmunity, myeloproliferation, and cancer in mice. J Exp Med. 2011;208(6):1189–1201. doi: 10.1084/jem.20101823. [DOI] [PMC free article] [PubMed] [Google Scholar]
- 23.Edmonds MD, Hurst DR, Vaidya KS, Stafford LJ, Chen D, Welch DR. Breast cancer metastasis suppressor 1 coordinately regulates metastasis-associated microRNA expression. Int J Cancer. 2009;125(8):1778–1785. doi: 10.1002/ijc.24616. [DOI] [PMC free article] [PubMed] [Google Scholar]
- 24.Hurst DR, Edmonds MD, Scott GK, Benz CC, Vaidya KS, Welch DR. Breast cancer metastasis suppressor 1 up-regulates miR-146, which suppresses breast cancer metastasis. Cancer Res. 2009;69(4):1279–1283. doi: 10.1158/0008-5472.CAN-08-3559. [DOI] [PMC free article] [PubMed] [Google Scholar]
- 25.Li Y, Vandenboom TG, 2nd, Wang Z, Kong D, Ali S, Philip PA, et al. miR-146a suppresses invasion of pancreatic cancer cells. Cancer Res. 2010;70(4):1486–1495. doi: 10.1158/0008-5472.CAN-09-2792. [DOI] [PMC free article] [PubMed] [Google Scholar]
- 26.Hung PS, Chang KW, Kao SY, Chu TH, Liu CJ, Lin SC. Association between the rs2910164 polymorphism in pre-mir-146a and oral carcinoma progression. Oral Oncol. 2012;48(5):404–408. doi: 10.1016/j.oraloncology.2011.11.019. [DOI] [PubMed] [Google Scholar]
- 27.Scapoli L, Palmieri A, Lo Muzio L, Pezzetti F, Rubini C, Girardi A, et al. MicroRNA expression profiling of oral carcinoma identifies new markers of tumor progression. Int J Immunopathol Pharmacol. 2010;23(4):1229–1234. doi: 10.1177/039463201002300427. [DOI] [PubMed] [Google Scholar]
- 28.Chen HF, Hu TT, Zheng XY, Li MQ, Luo MH, Yao YX, et al. Association between miR-146a rs2910164 polymorphism and autoimmune diseases susceptibility: A meta-analysis. Gene. 2013 doi: 10.1016/j.gene.2013.03.073. [DOI] [PubMed] [Google Scholar]
- 29.Wu D, Wang F, Dai WQ, He L, Lu J, Xu L, et al. The miR-146a rs2910164 G > C Polymorphism and Susceptibility to Digestive Cancer in Chinese. Asian Pac J Cancer Prev. 2013;14(1):399–403. doi: 10.7314/apjcp.2013.14.1.399. [DOI] [PubMed] [Google Scholar]
- 30.Wei WJ, Wang YL, Li DS, Wang Y, Wang XF, Zhu YX, et al. Association between the rs2910164 polymorphism in pre-Mir-146a sequence and thyroid carcinogenesis. PLoS One. 2013;8(2):e56638. doi: 10.1371/journal.pone.0056638. [DOI] [PMC free article] [PubMed] [Google Scholar]
- 31.Kademani D, Bell RB, Bagheri S, Holmgren E, Dierks E, Potter B, et al. Prognostic factors in intraoral squamous cell carcinoma: the influence of histologic grade. J Oral Maxillofac Surg. 2005;63(11):1599–1605. doi: 10.1016/j.joms.2005.07.011. [DOI] [PubMed] [Google Scholar]
- 32.Tay Y, Zhang J, Thomson AM, Lim B, Rigoutsos I. MicroRNAs to Nanog, Oct4 and Sox2 coding regions modulate embryonic stem cell differentiation. Nature. 2008;455(7216):1124–1128. doi: 10.1038/nature07299. [DOI] [PubMed] [Google Scholar]
- 33.Thomas M, Lieberman J, Lal A. Desperately seeking microRNA targets. Nat Struct Mol Biol. 2010;17(10):1169–1174. doi: 10.1038/nsmb.1921. [DOI] [PubMed] [Google Scholar]
- 34.Hsu RJ, Yang HJ, Tsai HJ. Labeled microRNA pull-down assay system: an experimental approach for high-throughput identification of microRNA-target mRNAs. Nucleic Acids Res. 2009;37(10):e77. doi: 10.1093/nar/gkp274. [DOI] [PMC free article] [PubMed] [Google Scholar]
- 35.Takahashi K, Yamanaka S. Induction of pluripotent stem cells from mouse embryonic and adult fibroblast cultures by defined factors. Cell. 2006;126(4):663–676. doi: 10.1016/j.cell.2006.07.024. [DOI] [PubMed] [Google Scholar]
- 36.Du L, Yang Y, Xiao X, Wang C, Zhang X, Wang L, et al. Sox2 nuclear expression is closely associated with poor prognosis in patients with histologically node-negative oral tongue squamous cell carcinoma. Oral Oncol. 2011;47(8):709–713. doi: 10.1016/j.oraloncology.2011.05.017. [DOI] [PubMed] [Google Scholar]
- 37.Han X, Fang X, Lou X, Hua D, Ding W, Foltz G, et al. Silencing SOX2 induced mesenchymal-epithelial transition and its expression predicts liver and lymph node metastasis of CRC patients. PLoS One. 2012;7(8):e41335. doi: 10.1371/journal.pone.0041335. [DOI] [PMC free article] [PubMed] [Google Scholar]
- 38.Forghanifard MM, Ardalan Khales S, Javdani-Mallak A, Rad A, Farshchian M, Abbaszadegan MR. Stemness state regulators SALL4 and SOX2 are involved in progression and invasiveness of esophageal squamous cell carcinoma. Med Oncol. 2014;31(4):922. doi: 10.1007/s12032-014-0922-7. [DOI] [PubMed] [Google Scholar]
- 39.Yang N, Hui L, Wang Y, Yang H, Jiang X. Overexpression of SOX2 promotes migration, invasion, and epithelial-mesenchymal transition through the Wnt/beta-catenin pathway in laryngeal cancer Hep-2 cells. Tumour Biol. 2014;35(8):7965–7973. doi: 10.1007/s13277-014-2045-3. [DOI] [PubMed] [Google Scholar]


