Abstract
BACKGROUND
Prolonged storage of red blood cells leads to storage lesions, which may impair clinical outcomes after transfusion. A hallmark of storage lesions is progressive echinocytic shape transformation, which can be partially reversed by washing in albumin solutions. Here we have investigated the impact of this shape recovery on biorheological parameters.
METHODS
Red blood cells stored hypothermically for 6–7 weeks were washed in a 1% human serum albumin solution. Red cell deformability was measured with osmotic gradient ektacytometry. The viscosity of red cell suspensions were measured with a Couette-type viscometer. The flow behaviour of red cells suspended at 40% hematocrit was tested with an artificial microvascular network.
RESULTS
Washing in 1% albumin reduced higher degrees of echinocytes and increased the frequency of discocytes, thereby shifting the morphological index towards discocytosis. Washing also reduced red cell swelling. This shape recovery was not seen after washing in saline, buffer or plasma. Red cell shape normalisation did not improve cell deformability measured by ektacytometry, but it tended to decrease suspension viscosities at low shear rates and improved the perfusion of an artificial microvascular network.
CONCLUSIONS
Washing of stored red blood cells in a 1% human serum albumin solution specifically reduces echinocytosis, and this shape recovery has a beneficial effect on microvascular perfusion in vitro. Washing in 1% albumin may represent a new approach to improving the quality of stored red cells, and thus potentially reducing the likelihood of adverse clinical outcomes associated with transfusion of blood stored for longer periods of time.
Introduction
The transfusion of red blood cells (RBCs) stored for a longer period of time, is associated with an increased morbidity and mortality.1–5 The underlying pathophysiological mechanisms have not been fully elucidated, but are likely to be multifactorial. Of major concern is the fact that RBC properties degrade progressively during storage.6 These so-called storage lesions are of various origin:7, 8 lipid peroxidation,9 exposure of the thrombogenic phosphatidylserine on the membrane surface,10 clustering9 and degradation11 of the transmembraneous anion channel protein band-3 have been described.
A frequently underestimated storage lesion is the progressive echinocytic shape transformation of RBCs.12–16 Echinocytes have decreased membrane17 and whole cell10, 18 deformability, they increase blood viscosity15, 16, 19 and impair microcirculatory blood flow,20 which may contribute to poor clinical outcomes after massive transfusion.
Albumin is capable of reversing this storage-induced echinocytic shape transformation, i.e. higher degrees of echinocytosis become less frequent, while normal discocytic shapes become more abundant.19, 21 The aim of this study was to determine whether such a recovery of RBC shape improves the rheological behaviour of RBCs and hence improves blood flow properties.
Materials and Methods
Preparation of RBC samples
Units of RBC concentrates were obtained from local blood banks (Red Cross Blood Bank, Kantonsspital Graubünden for experiments in Switzerland; Gulf Coast Regional Blood Center, Houston for experiments in the USA). They had been produced from whole blood drawn in citrate-phosphate-dextrose (CPD) and had been leukocyte-depleted. These RBCs had been stored either in SAGM (NaCl, adenine, glucose, mannitol) or PAGGSM (NaCl, adenine, glucose, guanosin, Na2HPO4/NaH2PO4, mannitol) for 6 and 7 weeks, respectively, in Switzerland, or in AS-1 (NaCl, adenine, glucose, mannitol) for 6 weeks in the USA. Fresh blood was collected from healthy volunteers using EDTA as an anticoagulant. Fresh blood was either passed through a leukocyte reduction filter (Purecell NEO, Pall Corp., Port Washington, USA) or the buffy coat and adjacent RBC layer were removed after centrifugation.
For RBC washing, one part stored RBCs (hematocrit 50–60%) was diluted with 9 parts 1% human serum albumin (HAS) solution. For the experiments in Switzerland, a human serum albumin solution with a concentration of 20 g/L (Albumin CSL, Behring, Bern, Switzerland) was diluted to 1% in phosphate buffered saline (PBS); in the USA, human serum albumin (Sigma-Aldrich, St. Louis, MO, USA) was dissolved at 1% in normal saline. After 10 min of washing under gentle mixing, the samples were centrifuged at 2500×g for 5 min. Packed RBCs were prepared from all samples by discarding the supernatant. They were resuspended in PBS or in saline for further experiments. Blood cell counts, RBC indices and hematocrit were measured with a hematology analyser.
Analysis of the RBC morphology
For the assessment of the RBC morphology, 20 µL of the RBC suspensions were fixed by addition of 1000 µL 1% glutaraldehyde. The specimens were analysed by light microscopy in wet preparations using a Neubauer counting chamber. For each sample, at least 200 RBCs were classified on the basis of the nomenclature of Bessis.22 Thereby, a discocyte has a score of 0, an echinocyte I (an irregularly contoured discocyte with up to 5 protrusions) has a score of +l, an echinocyte II (a flat RBC with several spicules) has a score of +2, an echinocyte III (ovaloid or spherical RBC with multiple spicules) has a score of +3, an echinocyte IV or sphero-echinocyte (a sphere with multiple short and thin spicules) has a score of +4, a stomatocyte I (convex-concave instead of biconcave RBC) has a score of −1, etc. The morphological index was calculated according to Ferrell and Huestis23 as the sum of all scores divided by the number of analysed RBCs. Some glutaraldehyde-fixed samples were also prepared for scanning electron microscopy according to standard procedures (e.g. see19).
Cell density fractionation in Percoll density gradients
RBCs were mixed with 90% isotonic Percoll solution prepared by mixing a 90 mL aliquot of sterile Percoll (GE Healthcare, density 1.130 g/mL) with 10 ml x10 phosphate buffered saline (PBS, Sigma-Aldrich) and 11 mL x1 PBS (Sigma-Aldrich). This mixture was centrifuged using a Sorvall RC 5C plus centrifuge (Thermo Fisher Scientific, Inc.) equipped with an SM-24 rotor at 4°C for 30 min at 45,000×g.
Cell water and ion detection
RBCs were placed in pre-weighed pre-dried Eppendorf tubes washed three times at 4°C with a Na/K/Cl-free solution containing 100 mM of Mg(NO3)2 and 10 mM imidazol-HCl buffered when cooled. The obtained cell pellets were weighed before and after drying at +80°C for 72 h. The water content was calculated between the wet and dry pellet weights.
Cell ATP, reduced (GSH) and oxidized (GSSG) glutathione levels
Aliquots of RBC suspensions (200µL) were deproteinized by suspending in ice-cold 5% aqueous solution of trichloracetic acid. The protein pellet was discarded and the supernatant used for ATP detection and GSH/GSSG measurements as described elsewhere.24 Briefly, ATP was measured using a luciferine-luciferase assay (FLAA ATP Bioluminescent Assay Kit, Sigma-Aldrich). GSH and GSSG were detected using Ellmanns reagent either in the presence or absence of glutathione reductase and NADPH. The values were normalized for the hematocrit.
Ektacytometry
RBC deformability was analyzed by laser diffraction with an ektacytometer (Technikon, Bayer, Leverkusen, Germany) in the osmoscan mode.25 Aliquots of 500µL of either stored RBCs or stored RBCs washed in 1% HSA as described above, were added to 3mL of a hyperviscous 20% dextran 70 solution (Sigma-Aldrich). They were inserted into the ektacytometer for measurement of RBC deformability in a continuous osmolality gradient generated by the addition of sodium chloride. Digitized osmoscans were obtained, on which the following parameters were calculated: Pmax: the highest value of the deformability index (DI) and Pmin: the lowest deformability reached on the hypoosmolar branch of the curve, representing the inflection point where hemolysis occurs. In addition the osmolalities were determined at which half of the Pmax was seen on the hypoosmolar (P’A) and hyperosmolar branch (P’B) of the osmoscan curve.
Measurement of suspension viscosity
Suspension viscosities were measured with a Couette-type viscometer (Contraves LS-30, ProRheo, Althengstett, Germany) at room temperature (21.6 ± 0.7 °C) at shear rates ranging from 0.11 to 128 s−1. In the first set of experiments, RBCs were suspended with a hematocrit of 45% in PBS containing 3% dextran 70 (Sigma-Aldrich), which allows RBC aggregation. RBCs stored for 6 weeks in SAGM were used, either unwashed or washed in the 1% HSA solution and were compared with freshly drawn RBCs from healthy volunteers. In the second set of experiments, RBCs stored for 7 weeks in PAGGSM were used, either unwashed or washed in 1% HSA. Washed RBCs were suspended in saline, unwashed RBCs either in saline or resuspended in their own storage medium with a hematocrit of 40 %.
Measurement of the RBC ability to perfuse an artificial microvascular network
Artificial microvascular network (AMVN) devices were fabricated from polydimethylsiloxane (PDMS) using previously described methods20, 26–28. Each AMVN device consisted of three identical networks of microchannels; each of the network units had a separate inlet and all converged into a common outlet.20, 26 RBCs stored for 6 weeks in AS-1 were used. A 60 µL sample of each type (stored, washed, fresh) with hematocrit adjusted to 40% was loaded into one of the three inlets in of the AMVN device. To perform the measurement, the driving pressure was set to 0 cm H2O, image acquisition was initiated, and after 30 seconds the driving pressure was increased to 20 cm H2O and image acquisition continued until 10 minutes had elapsed. Images were acquired on an inverted bright field microscope (IX71, Olympus America Inc., Center Valley, PA, USA) equipped with a high-speed camera (MC1362, Mikrotron GmbH, Unterschleissheim, Germany). Images were captured in bursts of 10 frames at 100 fps every 10 seconds using a custom image capture program. Images were analysed offline with a custom algorithm in MATLAB (The Math Works Inc., Natick, MA, USA) that computed mean cell velocity in the postcapillary venule (exit microchannel) for each network unit in the device. Each sample was measured in triplicate, using three separate AMVN devices.
Statistical analysis
Statistical analysis was performed with STATISTICA for Windows, Version 9.1 (Statsoft Inc., Tulsa, OK, USA, www.statsoft.com). A one way analysis of variance (ANOVA) was used for the comparison of more than two groups, a paired t-test for two groups, as appropriate. The results are presented as mean values ± standard deviation (SD). A p-value of < 0.05 was considered statistically significant.
Results
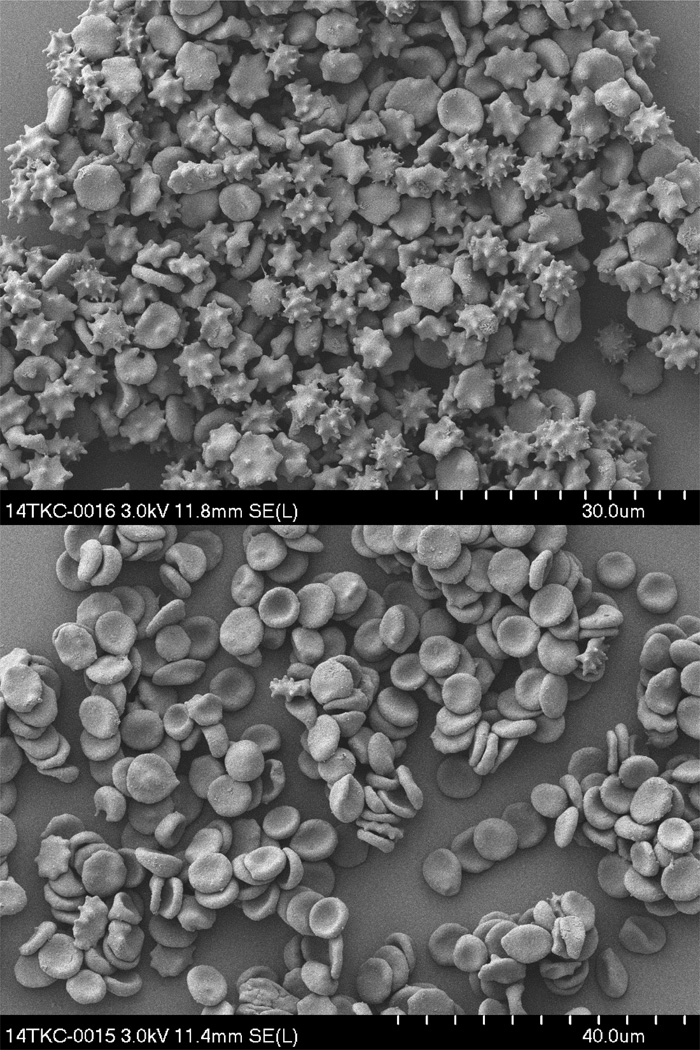
Storage of RBCs in any available conservation medium (SAGM, PAGGSM, or AS-1) for the allowed blood banking period of 6 weeks (SAGM and AS-1) or 7 weeks (PAGGSM) led to an echinocytic shape transformation, which is illustrated in Fig. 1A. A marked heterogeneity of shape changes was observed intra-individually, with RBC shapes ranging from discocytes to sphero-echinocytes, as well as inter-individually, ranging from 43% discocytes and only 12% higher degrees of echinocytosis (E II-E IV) in the best donor to 8% discocytes and 69% E II-E IV in the worst case. Washing stored RBCs in a 1% HSA solution reversed echinocytosis towards discocytosis, which is shown in Fig. 1B. Note that even higher degrees of echinocytosis became less frequent.
Fig. 1.
Scanning electron micrographs. A. RBCs stored in SAGM for 6 weeks. B. The same, stored RBCs as in A washed in a 1% human serum albumin solution.
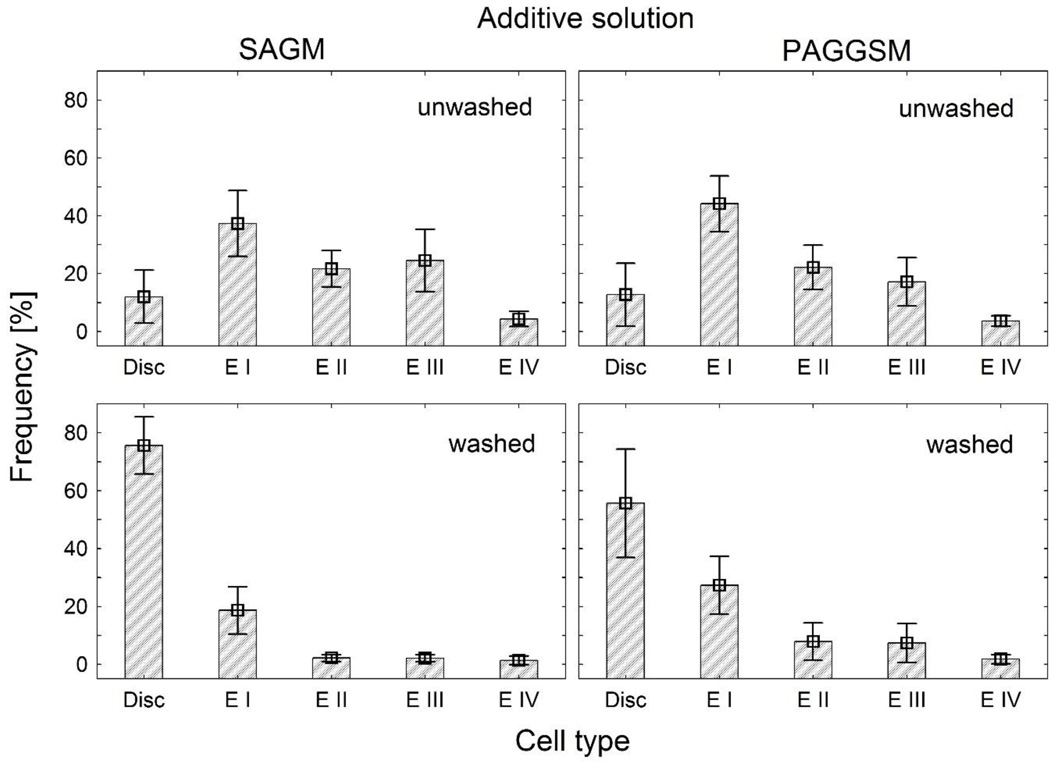
The quantitative assessment of RBC shape transformation at the end of storage in either SAGM or PAGGSM and the shape restoration after washing these RBCs in a 1% HSA solution is shown in Fig. 2. After washing, the strongly echinocytic RBC shapes shifted back towards discocytosis, i.e. the percentage of discocytes increased, while higher degrees of echinocytosis were decreased (ANOVA: p < 0.001). This shape recovering effect remained stable for at least 24 h (data not shown). As shown in Table 2, the morphological index (MI) decreased from 1.72 ± 0.32 to 0.29 ± 0.18 and from 1.52 ± 0.38 to 0.66 ± 0.43 for RBCs stored in SAGM and PAGGSM, respectively. It was a specific effect of the HSA solution, since the same washing procedure either in PBS alone or in saline had no shape recovering effect; the morphological index (MI) was 1.38 ± 0.44, and 1.40 ± 0.38, respectively. A resuspension of stored RBCs in fresh frozen plasma, or even washing in plasma as described (ten times the volume), had no shape recovering effect, the MI remained at 1.63 ± 0.29 and 1.68 ± 0.42, respectively.
Fig. 2.
Histograms of shape distributions of RBCs stored either in SAGM for 6 weeks (left side) or PAGGSM for 7 weeks (right side) before washing (above) and after washing in a 1% human serum albumin solution (below). D: Discocytes, E I: Echinocytes I, EII: Echinocytes II; E III: Echinocytes III; E IV: spheroechinocytes. Mean values ±SD of 11 samples in SAGM and 9 samples in PAGGSM are given.
Table 2.
Influence of washing procedure with 1% human serum albumin solution on morphological parameters of RBCs stored for 6 weeks in SAGM (n = 11) or 7 weeks in PAGGSM (n = 9). Mean values ± SD are given, p-value is for a paired t-test.
| Parameter | Stored RBCs | Stored RBCs, washed in 1% albumin |
p |
|---|---|---|---|
| Stored in SAGM | |||
| MCV (fL) | 93.2 ± 3.5 | 87.9 ± 3.2 | < 0.005 |
| MCHC (g/dL) | 34.5 ± 1.1 | 38.6 ± 1.2 | < 0.005 |
| MI | 1.72 ± 0.32 | 0.29 ± 0.18 | < 0.005 |
| Stored in PAGGSM | |||
| MCV (fL) | 94.5 ± 8.7 | 88.3 ± 6.4 | < 0.005 |
| MCHC (g/dL) | 32.8 ± 2.1 | 35.0 ± 1.2 | < 0.0005 |
| MI | 1.52 ± 0.38 | 0.66 ± 0.43 | < 0.00005 |
Storage of RBCs in SAGM conservation medium at 4°C for 6 weeks increased the mean corpuscular volume (MCV) as shown in Table 1. This indicates RBC swelling during storage. Washing stored RBCs in a 1% HSA solution reduced the MCV and increased the MCHC as shown in Table 2 for SAGM and PAGGSM, respectively. The MCV reached values similar to those measured before storage (see Table 1).
Table 1.
Hematological parameters at the beginning and end of 6 week storage in SAGM at 4°C.
| Parameter | Day 1 | Day 42 |
|---|---|---|
| RBC (×10/µL) | 6.60 ± 0.29 | 6.56 ± 0.30 |
| Hb (g/L) | 201 ± 8 | 201 ± 8 |
| Hct (%) | 58.6 ± 1.9 | 61.5 ± 1.7 * |
| MCV (fL) | 88.3 ± 2.6 | 93.8 ± 3.2 * |
indicates p < 0.001 (paired t-test)
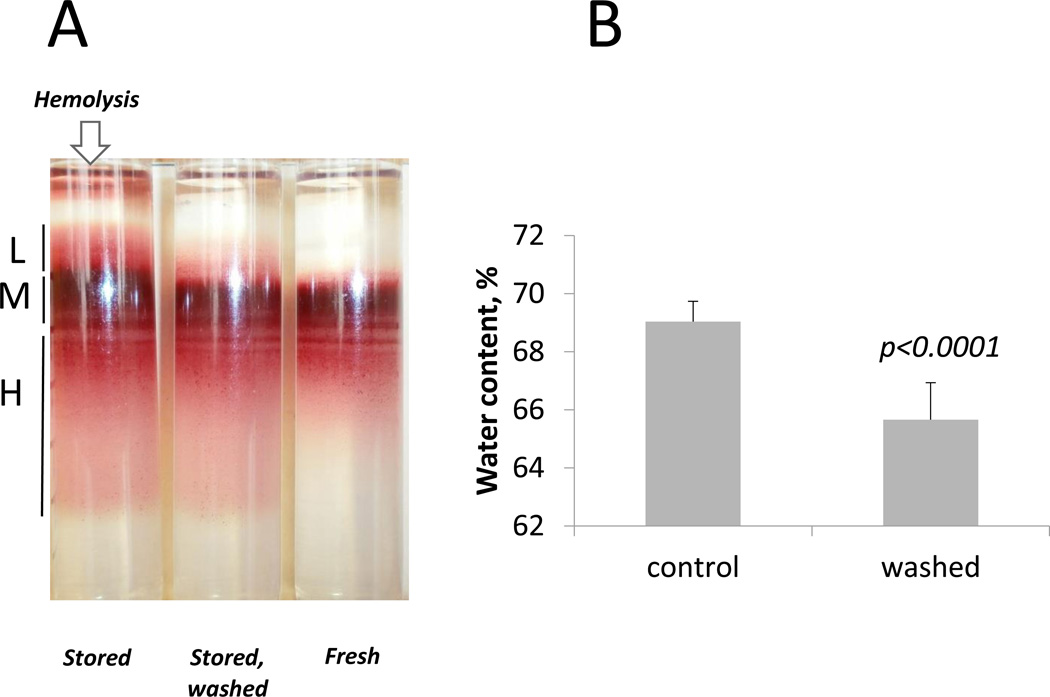
A water loss from the RBCs subjected to washing with HSA-containing PBS, monitored as a decrease in MCV and up-regulation of MCHC, was confirmed by the measurement of RBC density and cell water content (Fig. 3). RBCs stored for 42 days underwent swelling and decrease in density compared to fresh RBCs. The upward shift of overhydrated RBCs forming medium (M) and light (L) fractions in Percoll gradient was not any more observed after the stored RBCs had been washed with a HSA-containing solution. Note that hemolysis observed in stored RBCs as free hemoglobin solution above the Percoll gradient did not occur in cells washed in HSA-containing solution. Water content was measured in packed, stored RBCs, either untreated (control) or washed with HSA-containing solution. As shown in Fig. 3B, stored and washed RBCs contained significantly less water than stored control RBCs. This finding is in line with the decrease in MCV and increase in MCHC observed upon washing with HSA-containing solution.
Fig. 3.
Changes in red cell density and water content in stored RBCs upon washing with 1% human serum albumin. A. Distribution in Percoll density gradients is shown for RBCs of one donor stored for 6 weeks in SAGM before washing (Stored) and after washing with PBS containing 1% human serum albumin (Stored, washed). The distribution of freshly isolated RBCs (Fresh) according to their density was used as control. Areas of low (L), medium (M), and high (H) density fractions are indicated, the arrow points towards the sample showing hemolysis. B. RBC water content measured gravimetrically for blood samples of 11 donors stored for 6 weeks in SAGM before and after washing in a 1% human serum albumin solution.
Washing RBCs in a 1% HSA solution resulted in a subtle increase in intracellular ATP levels from 2.96 ± 0.24 to 3.73 ± 0.43 mmol/L packed RBCs (p=0.0002). Reduced glutathione levels were not affected by the washing (1.04 ± 0.16 and 1.13 ± 0.18 mmol/L packed RBCs for control and washed samples, respectively). Oxidized glutathione levels, however, decreased after washing from 7.1 ± 2.9 to 4.5 ± 2.8% (p=0.045).
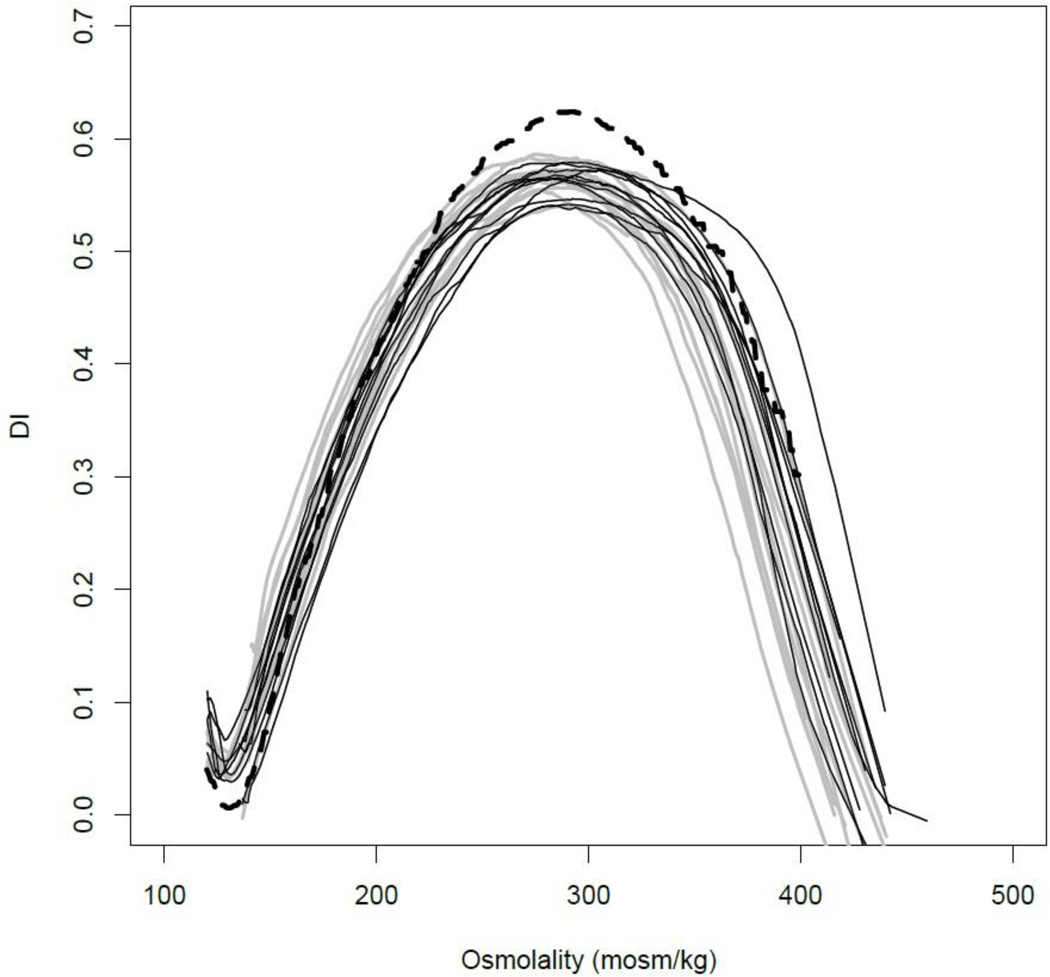
RBC deformability measured with ektacytometry is shown in Fig. 4. Compared with the deformability index of fresh RBCs, stored RBCs were less deformable. The maximum DI of stored RBCs, which had been washed in 1% HSA, was similar to the maximum DI of stored, but unwashed RBCs (0.567 ± 0.013 and 0.563 ± 0.013, respectively). At low osmolality, the curves were also similar (DImin 0.056 ± 0.041 and 0.043 ±0.025 at 132 ± 8 mOsm/kg and 133 ± 6 mOsm/kg for washed and unwashed RBCs, respectively). At high osmolalities, the osmoscan curves of RBCs washed in 1% HSA were slightly shifted to the left, i.e. to lower osmolality; the half maximum DI (P’B) was at 379.8 ± 10.4 mOsm/kg compared with 393.7 ± 10.7 mOsm/kg, respectively (p =0.003). These results are in agreement with the reduced water content of RBCs after washing (Fig. 3) and resulting decrease in MCV and increase in MCHC (Table 2).
Fig. 4.
Osmotic gradient ektacytometry (osmoscans) of RBCs stored for 6 weeks in SAGM, either unwashed (grey lines) or after washing in a 1% human serum albumin solution (black lines). The dashed line represents mean values of fresh control RBCs.
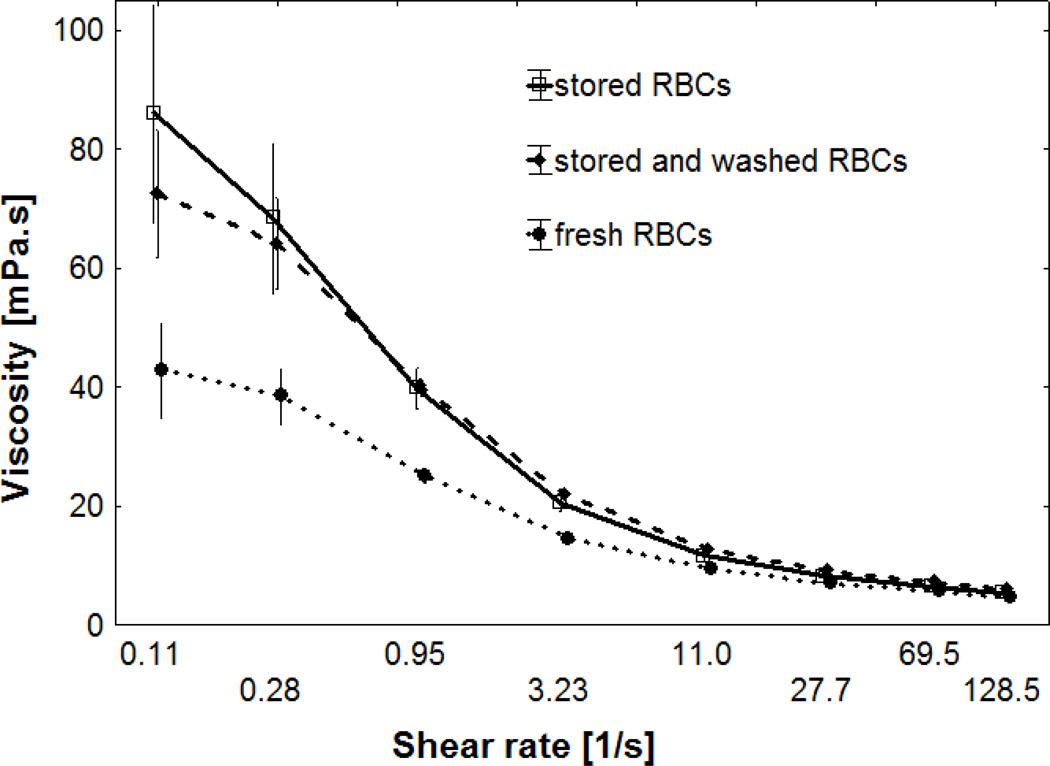
Fig. 5 shows the viscosities of RBCs stored for 6 weeks in SAGM, which were resuspended in a 3% dextran 70 solution. The suspension viscosities increased with decreasing shear rates, which reflects the RBC aggregating properties of dextran 70. The suspension viscosities of stored RBCs were much higher than that of fresh RBCs. However, washed and unwashed, stored RBCs had similar viscosities, with a tendency for higher values of washed RBCs at high shear rates and lower values at low shear rates. When the data, which were obtained at a standardized hematocrit, but differences in RBC count due to differences in MCV (see Table 2), were normalized for the differences in RBC count, the suspension viscosities of washed RBCs were significantly lower at shear rates < 1s−1 (data not shown).
Fig 5.
Log-linear plot of suspension viscosities at 37°C of fresh RBCs and RBCs stored for 6 weeks in SAGM, which were used either unwashed or after washing in a 1% human serum albumin solution. They were suspended in a 3% dextran 70 solution with a hematocrit of 45%. Mean values ± SD are given (n = 11).
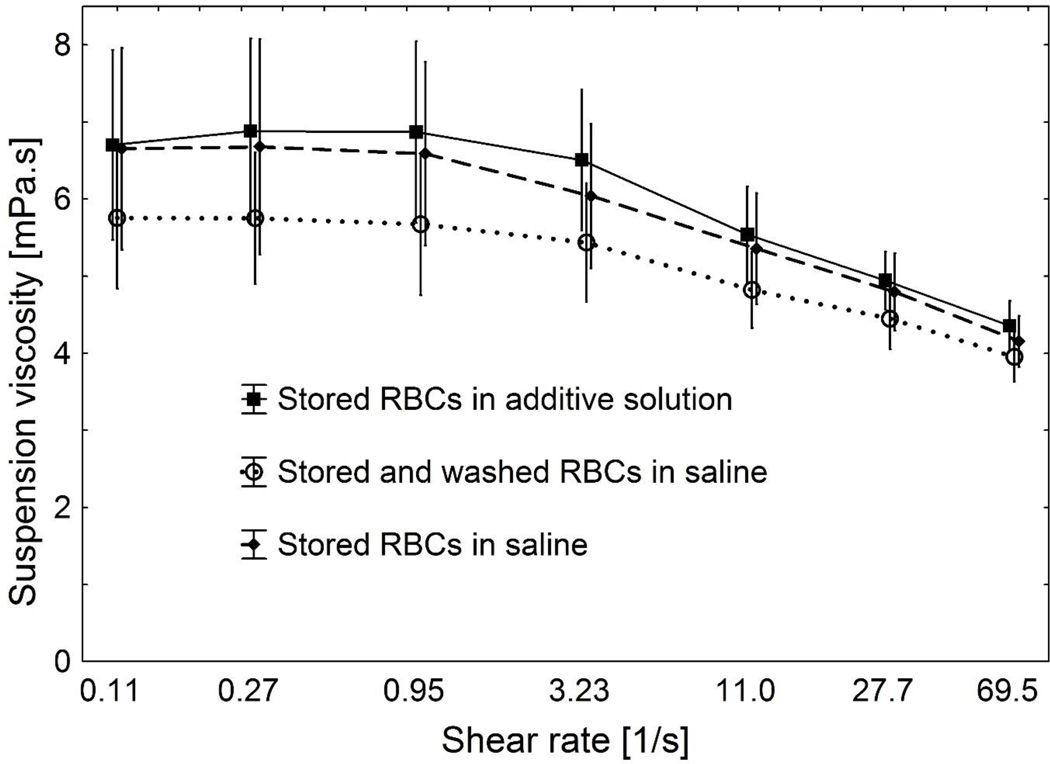
Fig. 6 shows the suspension viscosities of RBCs stored for 7 weeks in PAGGSM. These RBCs were resuspended either in their storage medium or in saline, or they were washed in 1% HSA as described above, and then resuspended in saline. The hematocrit was adjusted to 40%, which resulted in a difference in the RBC count due to the difference in MCV (RBC count: 3.74 ± 0.36 and 3.99 ± 0.29 × 10⁶/µL for stored RBCs and stored/washed RBCs, respectively, p < 0.005). The viscosity of all suspensions increased gradually with decreasing shear rate, indicating that this so called shear thinning effect is not only caused by RBC aggregation, which does not occur in saline as used in this study. RBCs washed in a 1% HSA solution had a lower suspension viscosity than unwashed RBCs (ANOVA for repeated measures: p ≤ 0.01), a phenomenon which was more pronounced at lower shear rates. The morphological index of RBCs correlated with low shear viscosity at 0.11 s−1 (y = 5.06 + 1.03×, r = 0.529, p < 0.05). The osmolality and pH of the supernatant were similar. They were 307 ± 4 mOsm/kg, 293 ± 10 mOsm/kg and 290 ± 3 mOsm/kg and 6.85 ± 0.22, 7.00 ± 0.112, and 6.87 ± 0.08 for the conservation medium, and the suspending medium of stored and stored/washed RBCs, respectively.
Fig. 6.
Log-linear plot of suspension viscosities at room temperature of RBCs stored for 7 weeks in PAGGSM. They were either resuspended in their storage medium, in saline, or in saline after washing in 1% human serum albumin before resuspension. Mean values ± SD are given (n=9).
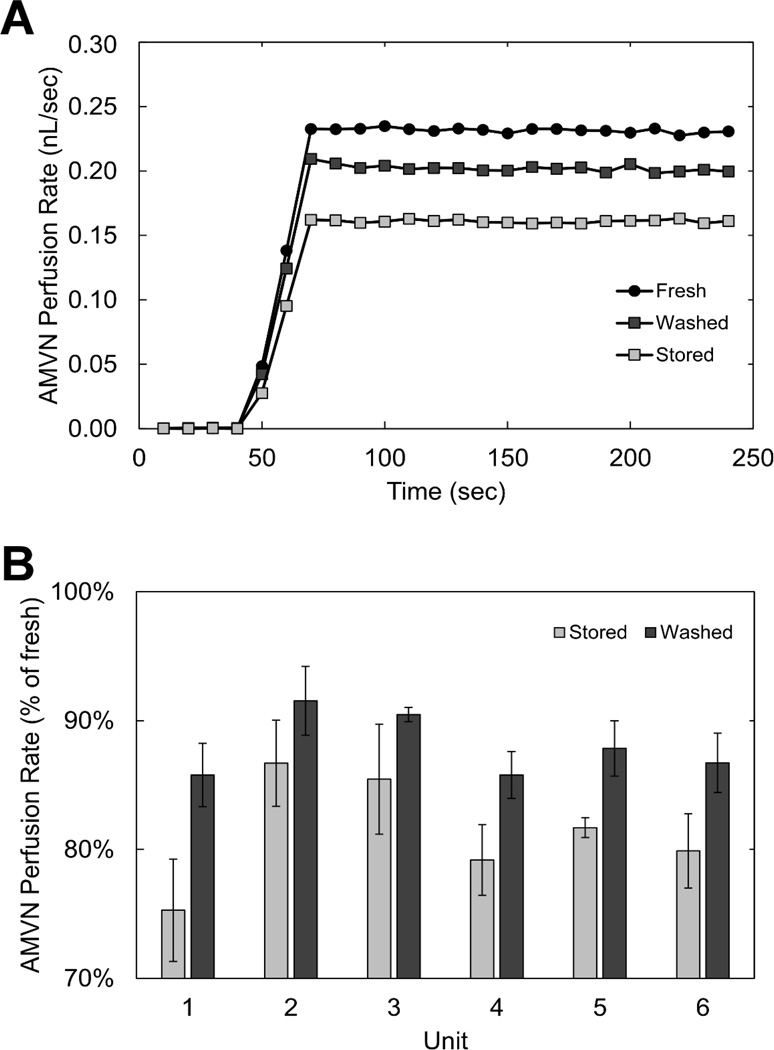
Figure 7 shows the analysis of the ability of stored and washed RBCs to perfuse an artificial microvascular network. The morphological index of RBCs stored for 6 weeks in AS-1 decreased from 1.82 ± 0.07 to 1.19 ± 0.11 after washing in a 1% HSA solution (p = 0.004). Fig. 7A shows perfusion rate traces that are characteristic of the data acquired for fresh, stored and washed RBCs using the AMVN device. Each trace initially started at ~0 nL/s when the driving pressure was 0 cm H2O, increased as the driving pressure was increasing, and plateaued after the 20 cm H2O target driving pressure was reached. The mean perfusion rate for each sample was calculated as the average of the first 10 data points of the plateau region common to all traces. Fig. 7B shows normalized (with respect to fresh RBCs) perfusion rates for stored and washed RBCs. RBCs from all stored units experienced an increase in AMVN perfusion rate after washing, however the degree of improvement varied significantly between units. It is tempting to speculate that the inter-donor differences in storage-induced shape transformation may have been the reason. The minimum increase in perfusion rate due to washing was 4.84 % of fresh (unit 2) while the maximum increase was 10.49 % of fresh (unit 1). Increase in perfusion rate after washing appeared to be inversely proportional to the perfusion rate of the stored RBCs prior to washing. The improvement of perfusion rate for washed RBCs was limited to approximately 90 % of fresh for all units, regardless of the initial (stored) perfusion rate. The mean perfusion rate for stored RBCs was 81.4 ± 3.0 % of the perfusion rate for fresh RBCs suspended in saline. A single washing of stored RBC samples with 1% HSA solution before resuspension reduced the morphological index and improved the mean perfusion rate to 88.0 ± 2.0 % of the perfusion rate for fresh RBCs. The mean increase in perfusion rate after washing with 1% HSA solution was 6.7 ± 1.9 %. Additionally, RBC transit in the artificial microvascular network at the level of 5 µm capillaries was observed to occasionally experience RBC plugging with stored RBCs, which did not seem to occur with fresh RBCs. Washing of stored RBCs in 1% HSA did not improve this plugging rate visibly.
Fig. 7.
The ability of RBC to perfuse the artificial microvascular network (AMVN). A. Representative traces of the perfusion rate recorded for suspensions of (●) fresh RBCs, (■) stored RBCs, and (■) stored RBCs washed in 1% human serum albumin solution. B. Normalized (with respect to fresh RBC) AMVN perfusion rates for stored and washed RBCs from 6 week old blood units (n = 6). The mean increase in perfusion rate for washed RBCs was 6.65 ± 1.87 % of that for fresh RBCs.
Discussion
The results of the present study confirm that HSA has the unique capacity to reverse storage-induced echinocytosis.19, 21 This shape recovering effect depends on the concentration of HSA and is inversely related to the hematocrit.21 Based on these data we had decided in the present study to wash stored RBCs with a tenfold dilution in 1% human serum albumin solution, which lowered the hematocrit temporarily to about 5%. This effect of HSA was not due to differences in osmolality because 1% HSA did not affect the osmolality of the suspending medium. The effect was specific to HSA, since it was not seen when stored RBCs were washed in either PBS, saline, or even plasma. The latter indicates that recovery of RBC shape should not be expected after transfusion to patients, but that these abnormally shaped RBCs could circulate in the recipient until they are removed by the reticulo-endothelial system, primarily the spleen.29
Why does the shape recovery occur only in 1% HSA solution, but not in plasma which has a higher HSA concentration? In plasma, albumin binds avidly to many different types of molecules such as calcium, fatty acids, hormones, and drugs,30 which may diminish available binding sites for interactions with RBC membrane. Furthermore, plasma contains echinocytogenic molecules (e.g. globulins), which may interact with the RBC membrane31 and induce dose-dependent echinocytosis,32 thus counteracting the shape-recovering action of albumin.
The mechanism behind this action of HSA has not been elucidated so far. Echinocytosis is induced when molecules are intercalated in the outer half of the membrane lipid bilayer, which leads to a relative expansion of the membrane towards the outside and the formation of membrane protrusions or spicules according to the bilayer couple theory.33 One may postulate that HSA is capable of removing molecules from this outer half of the membrane lipid bilayer, which leads to a shape normalisation. We have shown previously that HSA-induced shape restoration is a rapid process,21 which suggests extraction of responsible agents from the membrane. Membrane-derived lysophosphatidylcholine (lysolecithin) generated during RBC storage34–36 induces echinocytosis.37–39 HSA is known to interact with RBC membrane40 and to be able to remove lysophosphatidylcholine from the membrane,39, 41 which could explain its shape-recovering action.
RBC swelling during storage leads to an increase of MCV and a decrease of MCHC.15, 16 It is interesting that the partial shape recovery induced by washing in 1% HSA also reduced MCV. This was not an artefact of the aperture impedance analyser, which may overestimate the effective volume of a particle with less deformability and/or an odd shape,42 but was confirmed by a loss of cell water and increased density (Fig. 2). As discussed above, this effect was not due to osmolality of the HSA solution, which was not different from that of saline or PBS. The underlying mechanism, therefore, remains to be elucidated.
Oxidation triggers the formation of protein band 3 aggregates in the RBC membrane, which has an impact on the RBC shape. These band 3 aggregates serve as scaffolds for the recognition and binding of naturally occurring antibodies (NAF) against band 3 and complement.43 Our observation of a reduction of oxidized glutathione after washing in a 1% HSA solution suggests that HSA may function as a scavenger for reactive oxygen intermediates originating from membrane-bound degraded hemoglobin fragments.44 Membrane-bound hemoglobin induces protein band 3 oxidation and polymerisation. It is tempting to speculate that HSA could act as an antioxidant, reducing protein band 3 clustering and RBC shape alterations. This antioxidative effect is likely to be related to the observed recovery of ATP, which improves pump activities.
The main topic of this study was to compare the rheological properties of stored RBCs before and after washing in a 1% HSA solution. Osmotic gradient ektacytometry was chosen to analyse RBC deformability under high shear stress conditions (Fig. 4). Compared with normal fresh RBCs, stored RBCs were less deformable, which is in agreement with earlier reports using laser-assisted analysis of RBC elongation under high shear stress conditions on stored samples16, 45 and blood drawn from patients after transfusion.46, 47 The decreased RBC elongation is probably due to the cell swelling described above and potential loss of membrane surface area by exovesiculation of echinocytes, which leads to increased sphericity of stored RBCs18 and hence reduces their ability to elongate. Washing stored RBCs in 1% HSA did not improve ektacytometric deformability. This could suggest that the remaining degree of echinocytosis after washing was still relevant in comparison with the discocytic shape of normal RBCs. Another explanation is that storage lesions other than the echinocytic shape transformation, such as membrane alterations,9, 11 are not reversible by washing and, therefore, keep RBC deformability at a lower level.
Suspension viscosities of stored RBCs in a 3% dextran solution, which allowed RBC aggregation, showed higher suspension viscosities than normal RBCs at all shear rates. This is opposite to what might be expected from the fact that echinocytes undergo much less aggregation,48, 49 but echinocytes have been shown to increase low shear viscosity irrespective of RBC aggregation.18, 50 Washing stored RBCs had no beneficial effect at high shear rates and slightly decreased the viscosities at low shear rates. Suspended stored and washed RBCs in saline, i.e. without RBC aggregation, showed a lower viscosity of washed compared with unwashed RBCs. The hematocrit of these suspensions was adjusted to 40%. Since washed RBCs had a lower MCV, the RBC count was higher at the given hematocrit of 40%. In other words, the suspension viscosity was lower despite a higher number of RBCs, which is beneficial from a physiological point of view.
Although washing of stored RBCs in 1% HSA did not recover ektacytometric deformability, it improved the ability of washed RBCs to perfuse the artificial microvascular network (AMVN). The AMVN represents a novel tool, which allows a closer approximation of in vivo microcirculation than any other available instrument for measuring RBC rheological properties in vitro.20, 26 We have shown before that the AMVN perfusion rate for stored RBCs is lower than that for fresh RBCs, and that washing and re-suspending stored RBCs in saline instead of the storage medium increases their ability to perfuse the artificial microvascular network.20 Here we further showed that washing in a 1% HSA solution can improve the ability of stored RBCs to perfuse the microvasculature. The degree of improvement appeared to be dependent on the initial quality of individual blood units. Units with lower perfusion rates for unwashed RBCs improved more after washing than units with higher perfusion rates for unwashed RBCs. The perfusion rate for all of the RBC units after washing did not exceed 92 % of fresh, which may suggest a natural limit as to the level of improvement one can expect for any stored RBCs using washing as the rejuvenation strategy.
These differences in rheological data – obtained either using ektacytometry or the AMVN – highlight the fact that a single in vitro measurement may be not sufficient to predict the flow behaviour of RBCs in vivo. Each rheological in vitro test examines only a limited spectrum of deformation experienced by a RBC in the circulation in vivo. While RBC elongation under high shear conditions in the ektacytometer was not affected, the perfusion of an AMVN was improved by the washing procedure, which indicates that AMVN may be the most comprehensive rheological test available at the moment.
These observations may have clinical implications, suggesting that older RBC units stored until the end of their shelf life could be “rejuvenated” by a simple washing procedure in a 1% HSA solution. After washing, storage-induced echinocytosis decreases and in vitro microvascular perfusion increases. This may improve blood circulation after massive blood transfusion and eventually result in better clinical outcomes. Since a considerable donor-to-donor variability in RBC storage exists,51, 52 washing of stored RBCs in 1% HSA before transfusion could probably be limited to those RBC units with a high degree of echinocytosis.
Acknowledgements
We thank S. Thoeny, AO Research Institute, Davos, Switzerland for the scanning electron micrographs.
SOURCE OF SUPPORT: This work was supported by the European Union’s Seventh Framework Program for research, technological development and demonstration under grant agreement No 602121 (CoMMiTMenT), by the cooperative project funding from the Zurich Center for Integrative Human Physiology (ZIHP), University of Zurich, and by a 2012 NIH Director’s Transformative Research Award (NHLBI R01HL117329, PI: Shevkoplyas).
Footnotes
CONFLICT OF INTEREST: All authors declare no conflict of interest.
References
- 1.Koch CG, Li L, Sessler DI, Figuerola P, Hoeltge GA, Mihaljevic T, Blackstone EH. Duration of red-cell storage and complications after cardiac surgery. N Engl J Med. 2008;358:1229–1239. doi: 10.1056/NEJMoa070403. [DOI] [PubMed] [Google Scholar]
- 2.Aubron C, Syres G, Nichol A, Bailey M, Board J, Magrin G, Murray L, Presneill J, Sutton J, Vallance S, Morrison S, Bellomo R, Cooper DJ. A pilot feasibility trial of allocation of freshest available red blood cells versus standard care in critically ill patients. Transfusion. 2012;52:1196–1202. doi: 10.1111/j.1537-2995.2011.03437.x. [DOI] [PubMed] [Google Scholar]
- 3.Wang D, Sun J, Solomon SB, Klein HG, Natanson C. Transfusion of older stored blood and risk of death: a meta-analysis. Transfusion. 2012;52:1184–1195. doi: 10.1111/j.1537-2995.2011.03466.x. [DOI] [PMC free article] [PubMed] [Google Scholar]
- 4.Lelubre C, Vincent JL. Relationship between red cell storage duration and outcomes in adults receiving red cell transfusions: a systematic review. Crit Care. 2013;17:R66. doi: 10.1186/cc12600. [DOI] [PMC free article] [PubMed] [Google Scholar]
- 5.Solomon SB, Wang D, Sun J, Kanias T, Feng J, Helms CC, Solomon MA, Alimchandani M, Quezado M, Gladwin MT, Kim-Shapiro B, Klein HG, Natanson C. Mortality increases after massive exchange transfusion with older stored blood in canines with experimental pneumonia. Blood. 2013;121:1663–1672. doi: 10.1182/blood-2012-10-462945. [DOI] [PMC free article] [PubMed] [Google Scholar]
- 6.Flegel WA, Natanson C, Klein HG. Does prolonged storage of red blood cells cause harm? Brit J Haematol. 2014 doi: 10.1111/bjh.12747. doi: 10.1111/bjh.12747. [DOI] [PMC free article] [PubMed] [Google Scholar]
- 7.Kim-Shapiro DB, Lee J, Gladwin MT. Storage lesion: role of red blood cell breakdown. Transfusion. 2011;51:844–851. doi: 10.1111/j.1537-2995.2011.03100.x. [DOI] [PMC free article] [PubMed] [Google Scholar]
- 8.Van de Watering L. Red cell storage and prognosis. Vox Sang. 2011;100:36–45. doi: 10.1111/j.1423-0410.2010.01441.x. [DOI] [PubMed] [Google Scholar]
- 9.Karon BS, van Buskirk CM, Jaben EA, Hoyer JD, Thomas DD. Temporal sequence of major biochemical events during blood bank storage of packed red blood cells. Blood Transfus. 2012;10:453–461. doi: 10.2450/2012.0099-11. [DOI] [PMC free article] [PubMed] [Google Scholar]
- 10.Relevy H, Koshkaryev A, Manny N, Yedgar S, Barshtein G. Blood banking-induced alteration of red blood cell flow properties. Transfusion. 2008;48:136–146. doi: 10.1111/j.1537-2995.2007.01491.x. [DOI] [PubMed] [Google Scholar]
- 11.Rinalducci S, Ferru E, Blasi B, Turrini F, Zolla L. Oxidative stress and caspase-mediated fragmentation of cytoplasmic domain of erythrocyte band 3 during blood storage. Blood Transfus. 2012;10(Suppl 2):S55–S62. doi: 10.2450/2012.009S. [DOI] [PMC free article] [PubMed] [Google Scholar]
- 12.Meryman HT, Hornblower ML, Syring RL. Prolonged storage of red cells at 4 degrees C. Transfusion. 1986;26:500–505. doi: 10.1046/j.1537-2995.1986.26687043613.x. [DOI] [PubMed] [Google Scholar]
- 13.Mazor D, Dvilansky A, Meyerstein N. Prolonged storage of red cells: the effect of pH, adenine and phosphate. Vox Sang. 1994;66:264–269. doi: 10.1111/j.1423-0410.1994.tb00327.x. [DOI] [PubMed] [Google Scholar]
- 14.Hovav T, Yedgar S, Manny N, Barshtein Alteration of red cell aggregability and shape during blood storage. Transfusion. 1999;39:277–281. doi: 10.1046/j.1537-2995.1999.39399219284.x. [DOI] [PubMed] [Google Scholar]
- 15.Sollberger T, Walter R, Brand B, Contesse J, Meredith DO, Reinhart WH. Influence of prestorage leukocyte depletion and storage time on rheologic properties of erythrocyte concentrates. Vox Sang. 2002;82:191–197. doi: 10.1046/j.1423-0410.2002.00167.x. [DOI] [PubMed] [Google Scholar]
- 16.Zehnder L, Schulzki T, Goede JS, Hayes J, Reinhart WH. Erythrocyte storage in hypertonic (SAGM) or isotonic (PAGGSM) conservation medium: influence on cell properties. Vox Sang. 2008;95:280–287. doi: 10.1111/j.1423-0410.2008.01097.x. [DOI] [PubMed] [Google Scholar]
- 17.Chabanel A, Reinhart WH, Chien S. Increased resistance to membrane deformation of shape-transformed human red blood cells. Blood. 1987;69:739–743. [PubMed] [Google Scholar]
- 18.Reinhart WH, Chien S. Red cell rheology in stomatocyte-echinocyte transformation: Roles of cell geometry and cell shape. Blood. 1986;67:1110–1118. [PubMed] [Google Scholar]
- 19.Reinhart SA, Schulzki T, Bonetti PO, Reinhart WH. Studies on metabolically depleted erythrocytes. Clin Hemorheol Microcirc. 2014;56:161–173. doi: 10.3233/CH-131682. [DOI] [PubMed] [Google Scholar]
- 20.Burns JM, Yang X, Forouzan O, Sosa JM, Shevkoplyas SS. Artificial microvascular network: a new tool for measuring rheologic properties of stored red blood cells. Transfusion. 2012;52:1010–1023. doi: 10.1111/j.1537-2995.2011.03418.x. [DOI] [PubMed] [Google Scholar]
- 21.Reinhart SA, Schulzki T, Reinhart WH. Albumin reverses the echinocytic shape transformation of stored erythrocytes. Clin Hemorheol Microcirc. 2014 Sep 26; doi: 10.3233/CH-141899. [Epub ahead of print] [DOI] [PubMed] [Google Scholar]
- 22.Bessis M. Red cell shapes: An illustrated classification and its rationale. Nouv Rev Franç Hematol. 1972;12:721–745. [PubMed] [Google Scholar]
- 23.Ferrell JE, Jr, Huestis WH. Phosphoinositide metabolism and the morphology of human erythrocytes. J Cell Biol. 1984;98:1992–1998. doi: 10.1083/jcb.98.6.1992. [DOI] [PMC free article] [PubMed] [Google Scholar]
- 24.Bogdanova AY, Ogushola OO, Bauer C, Gassmann M. Pivotal role of reduced glutathione in oxygen-induced regulation of the Na(+)/K(+) pump in mouse erythrocyte membranes. J Membrane Biol. 2003;195:33–42. doi: 10.1007/s00232-003-2042-8. [DOI] [PubMed] [Google Scholar]
- 25.Deuel JW, Lutz HU, Misselwitz B, Goede JS. Asymptomatic elevation of the hyperchromic red blood cell subpopulation is associated with decreased red cell deformability. Ann Hematol. 2012;91:1427–1434. doi: 10.1007/s00277-012-1467-5. [DOI] [PubMed] [Google Scholar]
- 26.Sosa JM, Nielsen ND, Vignes SM, Chen TG, Shevkoplyas SS. The relationship between red blood cell deformability metrics and perfusion of an artificial microvascular network. Clin Hemorheol Microcirc. 2014;57:291–305. doi: 10.3233/CH-131719. [DOI] [PMC free article] [PubMed] [Google Scholar]
- 27.Forouzan O, Yang X, Sosa JM, Burns JM, Shevkoplyas SS. Spontaneous oscillations of capillary blood flow in artificial microvascular networks. Microvasc Res. 2012;84:123–132. doi: 10.1016/j.mvr.2012.06.006. [DOI] [PubMed] [Google Scholar]
- 28.Shevkoplyas SS, Yoshida T, Gifford SC, Bitensky MW. Direct measurement of the impact of impaired erythrocyte deformability on microvascular network perfusion in a microfluidic device. Lab Chip. 2006;6(7):914–920. doi: 10.1039/b601554a. [DOI] [PubMed] [Google Scholar]
- 29.Luten M, Roerdinkholder-Stoelwinder B, Schaap NP, de Grip WJ, Bos HJ, Bosman GJ. Survival of red blood cells after transfusion: a comparison between red cell concentrates of different storage periods. Transfusion. 2008;48:1478–1485. doi: 10.1111/j.1537-2995.2008.01734.x. [DOI] [PubMed] [Google Scholar]
- 30.Fasano M, Curry S, Terreno E, Galliano M, Fanali G, Narciso P, Notari S, Ascenzi P. Critical review. The extraordinary ligand binding properties of human serum albumin. IUBMB Life. 2005;57:787–796. doi: 10.1080/15216540500404093. [DOI] [PubMed] [Google Scholar]
- 31.Pirofsky B, Cordova MS, Imel ThL. The nonimmunologic reaction of globulin molecules with the erythrocyte surface. Vox Sang. 1962;7:334–347. doi: 10.1111/j.1423-0410.1962.tb03262.x. [DOI] [PubMed] [Google Scholar]
- 32.Reinhart WH, Chien S. Echinocyte-stomatocyte transformation and shape control of human red blood cells: Morphological aspects. Am J Hematol. 1987;24:1–14. doi: 10.1002/ajh.2830240102. [DOI] [PubMed] [Google Scholar]
- 33.Sheetz MP, Singer SJ. Biological membranes as bilayer couples. A molecular mechanism of drug-erythrocyte interaction. Proc Natl Acad Sci USA. 1974;71:4457–4461. doi: 10.1073/pnas.71.11.4457. [DOI] [PMC free article] [PubMed] [Google Scholar]
- 34.Silliman CC, Clay KL, Thurman GW, Johnson CA, Ambruso DR. Partial characterization of lipids that develop during the routine storage of blood and prime the neutrophil NADPH oxidase. J Lab Clin Med. 1994;124:684–694. [PMC free article] [PubMed] [Google Scholar]
- 35.Silliman CC, Moore EE, Kehler MR, Khan SY, Gellar L, Elzi DJ. Identification of lipids that accumulate during the routine storage of prestorage leukoreduced red blood cells and cause acute lung injury. Transfusion. 2011;51:2549–2554. doi: 10.1111/j.1537-2995.2011.03186.x. [DOI] [PMC free article] [PubMed] [Google Scholar]
- 36.Maslanka K, Uhrynowska M, Lopacz P, Wrobel A, Smolenska-Sym G, Guz K, Lachert E, Ostas A, Brojer E. Analysis of leucocyte antibodies, cytokines, lysophospholipids and cell microparticles in blood components implicated in post-transfusion reactions with dyspnoea. Vox Sang. 2015;108:27–36. doi: 10.1111/vox.12190. [DOI] [PubMed] [Google Scholar]
- 37.Mohandas N, Greenquist AC, Shohet SB. Bilayer balance and regulation of cell shape changes. J Supramol Struct. 1978;9:453–458. doi: 10.1002/jss.400090315. [DOI] [PubMed] [Google Scholar]
- 38.Rogausch H. The flow behaviour of lysolecithin-induced echinocytes. Biorheology. 1984;21:757–765. doi: 10.3233/bir-1984-21603. [DOI] [PubMed] [Google Scholar]
- 39.Chasis JA, Schrier SL. Membrane deformability and the capacity for shape change in the erythrocyte. Blood. 1989;74:2562–2568. [PubMed] [Google Scholar]
- 40.Duranton C, Tanneur V, Lang C, Brand VB, Koka S, Kasinathan RS, Dorsch M, Hedrich HJ, Baumeister S, Lingelbach K, Lang F, Huber SM. A high specificity and affinity interaction with serum albumin stimulates an anion conductance in malaria-infected erythrocytes. Cell Physiol Biochem. 2008;22:395–404. doi: 10.1159/000185483. [DOI] [PubMed] [Google Scholar]
- 41.Ojala PJ, Hirvonen TE, Hermansson M, Somerharju P, Parkkinen J. Acyl chain-dependent effect of lysophosphalidylcholine on human neutrophils. J Leukoc Biol. 2007;82:1501–1509. doi: 10.1189/jlb.0507292. [DOI] [PubMed] [Google Scholar]
- 42.Paterakis GS, Laoutaris NP, Alexia SV, Siourounis PV, Stamulakatou AK, Premetis EE, Sakellariou C, Terzoglou GN, Papassotiriou IG, Loukopoulos D. The effect of red cell shape on the measurement of red cell volume. A proposed method for the comparative assessment of this effect among various haematology analysers. Clin Lab Haematol. 1994;16:235–245. doi: 10.1111/j.1365-2257.1994.tb00416.x. [DOI] [PubMed] [Google Scholar]
- 43.Lutz HU, Bogdanova A. Mechanisms tagging senescent red blood cells for clearance in healthy humans. Front Physiol. 2013;4:387. doi: 10.3389/fphys.2013.00387. [DOI] [PMC free article] [PubMed] [Google Scholar]
- 44.Mohanty JG, Nagababu E, Rifkind JM. Red blood cell oxidative stress impairs oxygen delivery and induces red blood cell aging. Front Physiol. 2014;5:84. doi: 10.3389/fphys.2014.00084. [DOI] [PMC free article] [PubMed] [Google Scholar]
- 45.Bennett-Guerrero E, Veldman TH, Doctor A, Telen MJ, Ortel TL, Reid TS, Mulherin MA, Zhu H, Buck RD, Califf RM, McMahon TJ. Evolution of adverse changes in stored RBCs. Proc Natl Acad Sci USA. 2007;104:17063–17068. doi: 10.1073/pnas.0708160104. [DOI] [PMC free article] [PubMed] [Google Scholar]
- 46.Frank SM, Abazyan B, Ono M, Hogue CW, Cohen DB, Berkowitz DE, Ness PM, Barodka VM. Decreased erythrocyte deformability after transfusion and the effects of erythrocyte storage duration. Anesth Analg. 2013;116:975–981. doi: 10.1213/ANE.0b013e31828843e6. [DOI] [PMC free article] [PubMed] [Google Scholar]
- 47.Salaria ON, Barodka VM, Hogue CW, Berkowitz DE, ness PM, Waey JO, Frank SM. Impaired red blood cell deformability after transfusion of stored allogenic blood but not autologous salvaged blood in cardiac surgery patients. Anesth Analg. 2014;118:1179–1187. doi: 10.1213/ANE.0000000000000227. [DOI] [PMC free article] [PubMed] [Google Scholar]
- 48.Reinhart WH, Singh A, Straub PW. Red blood cell aggregation and sedimentation: the role of the cell shape. Brit J Haematol. 1989;73:551–556. doi: 10.1111/j.1365-2141.1989.tb00296.x. [DOI] [PubMed] [Google Scholar]
- 49.Singh A, Reinhart WH. The influence of fractions of abnormal erythrocytes on aggregation. Eur J Clin Invest. 1991;21:597–600. doi: 10.1111/j.1365-2362.1991.tb01415.x. [DOI] [PubMed] [Google Scholar]
- 50.Reinhart WH, Singh-Marchetti M, Straub PW. The influence of erythrocyte shape on suspension viscosities. Eur J Clin Invest. 1992;22:38–44. doi: 10.1111/j.1365-2362.1992.tb01933.x. [DOI] [PubMed] [Google Scholar]
- 51.Dumont LJ, AuBuchon JP. Evaluation of proposed FDA criteria for the evaluation of radiolabeled red cell recovery trials. Transfusion. 2008;48:1053–1060. doi: 10.1111/j.1537-2995.2008.01642.x. [DOI] [PubMed] [Google Scholar]
- 52.Hess JR. Scientific problems in the regulation of red blood cell products. Transfusion. 2012;52:1827–1835. doi: 10.1111/j.1537-2995.2011.03511.x. [DOI] [PubMed] [Google Scholar]


