

Abstract
Aims
Pulmonary transit time (PTT; the time for ultrasound contrast to travel from the right ventricle [RV] to the left atrium) may provide a single metric that reports on cardiopulmonary function while overcoming some of the challenges of standard echocardiographic measures. We conducted a pilot study to test the feasibility and reproducibility of echocardiographically derived PTT and to determine its association with established measures of cardiopulmonary function.
Methods and Results
Thirty-nine patients receiving clinically indicated ultrasound contrast were prospectively enrolled. PTT was measured in the apical four-chamber view using commercially available software. Reproducibility and inter-observer agreement were assessed in 9 patients. PTT was correlated with established measures of left ventricular systolic and diastolic function, RV function, and pulmonary vascular status. PTT could be measured in 89% (33/37) of patients without a contraindication to ultrasound contrast; all measurements from the last 20 patients were interpretable and obtained independently by a sonographer. Reproducibility and inter-observer agreement were excellent. PTT correlated well with standard echocardiographic indicators of cardiac status. A PTT > 4.5 seconds accurately identified all but 1 patient with cardiopulmonary dysfunction.
Conclusions
This pilot study demonstrates that measurement of PTT using ultrasound contrast is highly reproducible, accurately reflects global cardiopulmonary function across a range of cardiopulmonary disease, and can be readily obtained by an independent sonographer. Further studies are needed to determine whether PTT has incremental value in diagnosis and prognosis compared to conventional echocardiographic parameters.
Keywords: contrast echocardiography, diastolic dysfunction, heart failure, left ventricular function, right ventricular function
INTRODUCTION
Many individual echocardiographic parameters report on ventricular function, pulmonary vascular tone, and estimates of left atrial (LA) pressure but no single non-invasive metric reflects global cardiopulmonary status. Standard echocardiographic measures may be limited by sub-optimal image quality or variable accuracy across the range of values encountered in clinical practice(1–5). Some parameters of right ventricular function in particular report only on regional and not global function, and others such as the myocardial performance index require multiple views to measure.(6, 7) (8).
As a potential complement to existing techniques, use of echocardiographic contrast affords an opportunity to apply indicator-dilution theory to derive a pulmonary transit time (PTT), a metric that has diagnostic and prognostic value when obtained from cardiac MRI(9). In this context, PTT is defined as the time required for a volume of contrast to travel from the right ventricle (RV) to the LA. This parameter could serve as an integrative measure of global cardiac function, incorporating input from RV pump function, pulmonary vascular resistance (PVR), and downstream (LA) pressure, with the latter reflecting left ventricular (LV) systolic and diastolic function as well. Measurement of PTT could also streamline echocardiographic evaluation by serving as a screening mechanism (i.e. a normal PTT implies the contributors outlined above are cumulatively normal) and providing a tool for serial assessment while overcoming limitations of standard methods.
The underlying theoretical foundation for PTT measurement is well established(10–15) and experimental work in animal models has been reported(16, 17) but the feasibility of integrating this technique into clinical practice is unknown.
Thus, the goals of this pilot study are to (1) assess the feasibility of measuring PTT during the usual operation of our institution’s Echocardiography Laboratory; (2) quantify the reproducibility (intra-individual variability) and inter-observer variability of PTT measurements across a spectrum of cardiopulmonary disease; and (3) correlate PTT with established echocardiographic measures of LV, RV, and pulmonary circulatory (PC) function.
METHODS
Study Design
The Vanderbilt Institutional Review Board approved this study, and all patients gave written informed consent. We prospectively enrolled patients undergoing clinically indicated echocardiography or stress echocardiography ordered by a referring physician. All patients received ultrasound contrast agents (UCA) for technically difficult studies according to the American Society of Echocardiography guidelines(18). All patients were studied on room air without supplemental oxygen.
Echocardiography and Contrast Administration
A comprehensive echocardiogram or stress echocardiogram was performed on an iE33 ultrasound instrument (Philips, Amsterdam, The Netherlands) using a dynamic range of 50 decibels. Assessment of chamber size, diastolic function, and right ventricular function were performed according to ASE guidelines(3, 8, 19). Echocardiographic measurements were performed by two experienced echocardiographers (EB, KM).
Definity (Perflutren lipid microsphere, Lantheus Medical Imaging, Billerica, Massachusetts) and Optison (Perflutren Protein-Type A microspheres, GE Healthcare, Buckinghamshire, United Kingdom) were used for UCA according to availability in our Echocardiography Laboratory. Prior to contrast injection, all patients received injection of agitated saline to exclude intra-cardiac or pulmonary artery shunt. UCA were suspended for administration according to manufacturer instructions and were administered through a peripheral intravenous catheter (IV) via manual bolus injection of 1- to 2-mL. Since the time for UC to travel from a peripheral vein to the heart is variable, the clip length was maximized to 30 seconds. The beginning of clip acquisition and UC administration were synchronized to begin simultaneously. The entry of contrast into the right-heart and subsequent appearance in the left-heart were recorded in the apical 4-chamber view (Video).
PTT acquisition and analysis
Contrast enhanced images were obtained at a mechanical index of 0.2–0.5 to optimize the balance between contrast visualization and microbubble destruction. A subset of patients underwent repeat contrast administration to assess the reproducibility of the PTT measurement. In these patients, the IV was flushed with 10 mL of normal saline between contrast injections and color Doppler was used to destroy the remaining microbubbles. On average, 5–7 minutes elapsed between baseline and repeat contrast administration with no intervening physiologic or medical interventions.
PTT was measured by two methods. After study completion, images were analyzed offline using QLab 9.1 software (Philips, Amsterdam, The Netherlands). To calculate PTT, regions of interest (ROI; 5 mm square) were placed in the RV and LA. The RV ROI was placed approximately 1 cm distal to the tricuspid valve leaflet tips equidistant from the interventricular septum and RV free wall. The LA ROI was placed approximately 1 cm from the posterior wall of the LA equidistant from the interatrial septum and LA free wall. After placement of ROIs, time-intensity curves were generated by the QLab software. PTT was calculated as the time elapsed between the first RV peak and first LA peak. The “peak” for each region of interest was defined as a sudden increase in amplitude. Using this definition, the “peak” does not necessarily correspond to the maximum amplitude in each curve (Figure 1). For comparison, PTT was also measured by a ‘frame counting’ technique. The clip containing UCA entry and passage through the heart was manually reviewed and the number of frames between the UCA’s initial appearance in the RV and LA was noted. Dividing this frame count by the frame rate yielded an estimate of PTT. For each method, inter-observer variability of PTT was assessed by 2 investigators (ELB, KM) based on a sub-group of randomly selected studies. There were no complications or adverse effects attributable to contrast administration.
Figure 1. Determination of PTT from an intensity-time curve.

Regions of interest (ROI) were defined as follows: the RV ROI (red square) was placed approximately 1 cm distal to the tricuspid valve leaflet tips equidistant from the inter-ventricular septum and RV free wall. The LA ROI (yellow square) was placed approximately 1 cm from the posterior wall of the LA equidistant from the inter-atrial septum and LA free wall. As denoted by the vertical lines, the RV peak occurs at 2.2 seconds and the LA peak occurs at 7.3 seconds, resulting in a PTT by this method of 5.1 seconds.
Statistical Analysis
Continuous variables are reported as mean ± standard deviation and categorical variables as absolute value and percent. Between-group differences were calculated using the Mann-Whitney U test or Chi-Square test as appropriate. Correlation coefficients were calculated using Spearman’s method. Reproducibility was assessed using Spearman’s correlation coefficient (and 95% confidence interval) to determine the relationship between initial and repeat measurements. Inter-observer agreement of PTT was expressed by the intra-class correlation coefficient (ICC). Statistical analyses were performed using Prism 5.0 software (Graph Pad Software Inc, La Jolla, CA) and SPSS 20 software (SPSS Inc, Chicago, IL).
RESULTS
Study Population
Patient demographics and echocardiographic findings are shown in Table I. The mean age in our cohort was 55 years and patients were generally obese (BMI 38.3 ± 8.1 kg/m2). The most common referral indications for transthoracic and stress echocardiography were history of congestive heart failure or dyspnea (n = 16; 48%) and history of coronary artery disease (n = 12; 36%). A wide range of LV function (systolic and diastolic), RV function, and pulmonary vascular status was represented in the cohort. All patients were in sinus rhythm at the time of contrast administration.
Table I.
Cohort Demographics and Echocardiographic Findings
| Variable | |
|---|---|
| Gender (% male) | 19 (56) |
| Age (years) | 55 (11) |
| BMI (kg/m2) | 38.3 (8.1) |
| Comorbidities (n, %) | |
| Hypertension | 28 (85) |
| Congestive heart failure | 10 (30) |
| Diabetes Mellitus | 8 (24) |
| Pulmonary hypertension | 4 (12) |
| Chronic Obstructive Pulmonary Disease | 2 (6) |
| Smoker | 10 (30) |
| Indication for Echocardiogram (n, %) | |
| Heart failure/Shortness of Breath | 16 (48) |
| CAD/Stress echo/Palpitations | 12 (36) |
| Pulmonary hypertension | 2 (6) |
| Other | 3 (9) |
| LV end-diastolic dimension (cm) | 5.2 (1.1) |
| Ejection fraction (%) | 55 (16) |
| LA Volume Index (mL/m2) | 27 (10) |
| Diastolic Function Grade (n, %) | |
| Normal | 16 (49) |
| I | 9 (27) |
| II | 0 (0) |
| III | 4 (12) |
| Indeterminate | 4 (12) |
| E/e′ (n = 26) | 9.4 (4.1) |
| TAPSE (mm) | 21 (5) |
| RVSP (mmHg, n = 19) | 32 (9) |
| Pulmonary Acceleration Time (msec) | 123 (30) |
Values are mean (SD) unless noted otherwise. BMI = body mass index; CAD = coronary artery disease; E/e′ = ratio of early mitral inflow to early mitral annular velocity; LA = left atrium; LV = left ventricle; RVSP = right ventricular systolic pressure; TAPSE = tricuspid annular plane systolic excursion
Feasibility and Reproducibility
Thirty-nine patients were enrolled in this study. Two patients had suspected intra-cardiac shunt (right to left atrial passage of microbubbles after intravenous saline contrast injection) that precluded contrast administration. Of the 37 patients who received contrast (33 - Definity; 4 - Optison), 33 had sufficient image quality to measure PTT. The 4 patients who received contrast but did not have a measurable PTT had mis-timed contrast injection and clip acquisition such that contrast had already arrived in the RV by the time the clip was initiated. These 4 patients were among the first 10 enrolled and represented the learning curve in our laboratory for this technique. The final 20 PTT acquisitions, all of which were measurable, were obtained independently by the sonographer (LS) without physician oversight in the course of performing the clinically-indicated echocardiogram. Therefore, in this pilot study, PTT could be measured in 33/37 (89%) patients without a contraindication to UCA. In patients with an existing indication for UCA administration, acquisition of PTT added approximately 2 minutes to the examination.
In the subset of patients who underwent repeat PTT measurement (n = 10), intra-individual reproducibility was strong across a wide range (Figure 2). Inter-observer agreement was assessed in 9 randomly selected patients and was excellent (ICC = 0.94, 95% CI 0.74–0.99, p < 0.001). Correlation between the frame counting and ROI techniques was strong (rs = 0.88, p < 0.001).
Figure 2. Reproducibility of Pulmonary Transit Time.

Two PTT measurements were acquired 5–7 minutes apart in 10 patients in the absence of medical or physiologic intervention. Spearman correlation coefficient (95% CI) is used to demonstrate the association between initial and repeat measurements.
Diagnostic Potential of PTT
To evaluate the ability of PTT to identify patients with dysfunction at any point in the cardiopulmonary circuit (RV, pulmonary vasculature, LV), we stratified patients into ‘abnormal’ and ‘normal’ groups based on 2 sets of criteria. The first set of criteria assigned to the ‘abnormal’ group those with at least one of the following: LVEF < 50% (LV systolic dysfunction), LAVI > 34 mL/m2 (chronic LV diastolic dysfunction), tricuspid annular plane systolic excursion (TAPSE) < 16 mm (regional RV dysfunction), or pulmonary acceleration time < 105 msec (elevated mean pulmonary artery pressure). These metrics were selected due to their being available for all patients in the cohort. The second set of criteria follows more directly the 3-component framework of the RV-PC system (RV pump function, PVR, LA pressure), but all components were not available for each patient. Specifically, these included global RV systolic function (fractional area change [FAC] < 35%(2, 8); n = 29), pulmonary vascular resistance (PVR; TRV/RVOT VTI > 0.175(3, 20, 21); n = 15), and LA pressure estimated by the ratio of early mitral inflow to mitral annular velocity (E/e′ > 15(2, 9); n = 26). As shown in Figure 3A, for the first model described above, a PTT threshold of approximately 4.5 seconds is accurate in identifying patients with abnormalities in any of these parameters. PTT was significantly higher in the ‘abnormal’ group than the ‘normal’ group (6.6 ± 1.8 vs. 3.8 ± 0.5 seconds; p < 0.001). A single patient in the “abnormal” cohort had a normal PTT (3.4 sec); the next lowest value was well above the mean for the “normal” cohort (4.6 sec). Likewise, as shown in Figure 3B for the 3-component model, a cutoff of approximately 4.5 seconds accurately discriminates normal from abnormal RV-PC function. The three compartment model (Figure 2B) misclassified two patients each in the normal and abnormal groups. This inaccuracy may be due to missing data in some patients or the technical limitations in measurement of FAC or TR jet velocity (required to estimate PVR).
Figure 3. Stratification Based on Normal/Abnormal Cardiopulmonary Function.
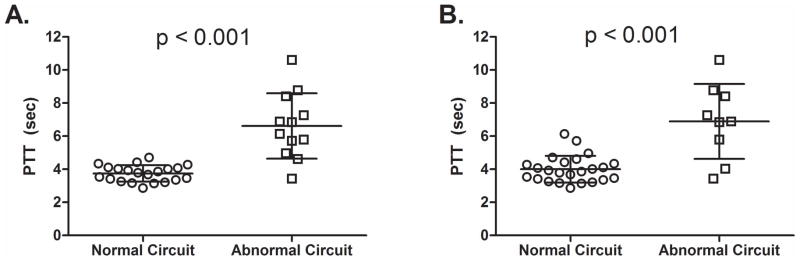
Two models were created to test the ability of PTT to stratify patients with and without echocardiographic evidence of cardiopulmonary dysfunction. A. Presence or absence of LV systolic dysfunction (LV ejection fraction < 50%), chronic LV diastolic dysfunction (LAVI > 34 mL/m2), elevated mean pulmonary artery pressure, (pulmonary acceleration time < 105 msec) or regional RV dysfunction (TAPSE < 16 mm). Using this model, only one patient with dysfunction had a “normal” PTT. B. This model more directly tested the three-compartment concept of the RV-PC system (RV function, pulmonary vascular status, and LA pressure) based on the presence or absence of global RV systolic dysfunction (FAC < 35%; n = 29), high PVR (TRV/RVOT VTI > 0.175; n = 15), and elevated LA pressure (E/e′ > 15; n = 26). Significance between groups compared using the Mann-Whitney U test.
PTT correlated well with established echocardiographic measures of LV, RV, and pulmonary vascular function (Figure 4), particularly the time-velocity integral of the LV outflow tract (LVOT VTI; rs = − 0.60, p < 0.001) and echocardiographically estimated PVR (rs = 0.63, p = 0.01), in those with a measurable tricuspid jet velocity (n = 15).
Figure 4. Correlation with Echocardiographic Parameters of Cardiopulmonary Function.

Correlation of PTT with established echocardiographic indicators of A. LV systolic function, B. LV diastolic function, C. RV function, and D. pulmonary vascular status. Solid line denotes best-fit line using Spearman correlation; dotted lines are 95% confidence intervals.
Although valvular heart disease was not cited as an indication for echocardiography in any of the patients in our cohort, three patients had moderate valvular regurgitation (1 moderate tricuspid regurgitation, 2 moderate mitral regurgitation). These three patients had prolonged PTT compared to the “normal” cohort; however, all three also had multiple other reasons for a prolonged PTT. Therefore, it is unlikely that valve disease alone had a significant impact on LAVI or pulmonary acceleration time. No patients in our cohort had isolated valvular heart disease with normal biventricular function so we are unable to report on the direct effect of valvular disease on PTT.
We assessed the difference in PTT across grades of diastolic function from normal to restrictive according to ASE guidelines(4) (Figure 5). Patients with normal diastolic function had lower PTT compared to patients with Grade I diastolic dysfunction, who in turn had lower PTT than patients with Grade III diastolic dysfunction (no patients in our cohort had grade II diastolic dysfunction). Four patients were deemed to have indeterminate diastolic function based on conflicting data; this group had higher PTT than those with normal diastolic function as well.
Figure 5. PTT Across Clinical Grades of Diastolic Function.

Diastolic function was classified as either normal or assigned a grade of dysfunction according to American Society of Echocardiography Guidelines. PTT was significantly shorter in patients with normal diastolic function compared to grade I dysfunction and significantly shorter in patients with grade I dysfunction compared to grade III. In addition, diastolic function was indeterminate in 4 patients due to conflicting data; PTT in these patients was significantly longer compared to patients with normal diastolic function. Significance between groups compared using the Mann-Whitney U test.
DISCUSSION
Main Findings
In this pilot study, we have shown that measurement of PTT using contrast echocardiography is feasible in an outpatient setting and that independent acquisition by a sonographer of the data necessary to derive PTT has a short learning curve. Intra-individual variability is low and inter-observer agreement is excellent. Furthermore, PTT correlates well with a number of established echocardiographic parameters of RV function, pulmonary vascular status, and LV function. In all but 3% of our cohort (1/33 patients), PTT accurately identified the presence of dysfunction within the cardiopulmonary circuit. Potential explanations for the single patient being misclassified include intra-pulmonary or inter-atrial shunting that was not detected with antecedent agitated saline administration, but neither of these possibilities has been confirmed.
Potential Clinical Usefulness
The potential applications of PTT include circumstances where a single, practical, non-invasive indicator of cardiac function that performs well in technically challenging situations would be useful, such as: pre-operative and peri-operative evaluation, serial monitoring of pulmonary vascular disease to gauge response to therapy, poor image quality due to obesity, and monitoring of critically ill patients in the intensive care unit. Neither Definity nor Optison acutely affect pulmonary hemodynamics (20, 21), thus reducing the potential for the measurement technique to influence the physiologic status of the system to be measured.
The ability of PTT to differentiate between stages of diastolic function suggests a potential role for this metric in establishing a continuous measure of diastolic function within and across the commonly used categories, which may improve detection of occult diastolic dysfunction as well as quantifying diastolic function when traditional measures are not ideal (for example in atrial fibrillation), or when e′ is not optimal such as lateral or septal myocardial infarction, constriction, or after mitral valve surgery. Although a very small sub-group, our data in those with ambiguous diastolic function lead to the hypothesis that PTT may provide incremental value in this population, which accounts for up to 11% of patients in the community (12% in our cohort)(22).
PTT is the time needed for the pulmonary blood volume to traverse the RV-PC system (i.e. travel from RV to LA) at a given flow rate. Thus, while clearly related to right-sided cardiac output, PTT may represent a more fundamental parameter that is more readily and more directly measured using the methods described above (i.e. analogous to MvO2 in invasive hemodynamics). Further studies are needed to determine if PTT has any incremental diagnostic and/or prognostic value above conventional echocardiographic parameters.
Limitations
We did not standardize, by use of a pump syringe for example, the rate and amount of contrast administered in our study. Consistent with ‘real-world’ clinical practice, contrast was given by hand injection through a peripheral IV according to the manufacturer instructions; this did not adversely impact intra-individual reproducibility. We were unable to test for potential differences in PTT between contrast agents as only a single agent is available in our Laboratory at any given time. We did not determine systematically whether ROI placement influences PTT. However, contrast influx into a given chamber is so brisk that even wide variations in placement within a chamber are unlikely to result in significant changes in PTT. All patients in this study were tested at rest and on room air; therefore, we were unable to determine any effect of exercise or supplemental oxygen on PTT. PTT was obtained by off-line evaluation of the primary data, which limits immediate clinical applicability; however, we are presently investigating methods of automating this process (a separate manuscript detailing this work has been submitted). In addition, our cohort consisted exclusively of patients with a clinical indication for UCA, which, in most cases, was due to large body habitus. The success of obtaining PTT in the setting of technically challenging image quality suggests that PTT could be a feasible alternative to other echocardiographic techniques that are often limited under similar circumstances.
CONCLUSIONS
In a small, clinically based cohort, we have shown that measuring PTT using ultrasound contrast is feasible and readily learned by an independent sonographer. PTT measurements are highly reproducible and reflect multiple indicators of cardiopulmonary status, including LV systolic and diastolic function and components of the RV-PC system. Additional studies are warranted to compare PTTs obtained from contrast-echocardiography and cardiac MRI. If comparable, prospective evaluation of the response to medical and surgical interventions of echocardiographically derived PTT seems reasonable.
Supplementary Material
The video clip depicts a representative example of echocardiographic contrast entering the right-heart, traversing the pulmonary circulation, and arriving in the left atrium (LA) prior to opacifying the left ventricle. The first appearance of contrast in the right ventricle occurs 56 frames into the clip with the initial appearance in the LA at 189 frames; the frame rate for this clip was 27 frames/second, yielding a pulmonary transit time (PTT) of 4.9 seconds.
Acknowledgments
Funding Sources
This work was supported by an American Heart Association Fellow to Faculty Award (#13FTF16070002; Brittain) and CTSA award No. UL1TR000445 from the National Center for Advancing Translational Sciences. Its contents are solely the responsibility of the authors and do not necessarily represent official views of the National Center for Advancing Translational Sciences or the National Institutes of Health.
The authors would like to acknowledge John H. Newman, MD for his critical review of the manuscript.
Footnotes
Disclosures:
The authors have no conflicts to report.
Author Contributions:
Brittain: Concept/design, Data analysis/interpretation, Drafting article, Approval of article, Statistics, Data collection
Doss: Critical revision of article, Data analysis/interpretation, Approval of article, Data collection
Saliba: Critical revision of article, Data analysis/interpretation, Approval of article, Data collection
Irani: Concept/design, Data analysis/interpretation, Critical revision of article, Approval of article
Byrd: Concept/design, Data analysis/interpretation, Critical revision of article, Approval of article
Monahan: Concept/design, Data analysis/interpretation, Drafting article, Approval of article, Data collection
References
- 1.Nagueh SF, Mikati I, Kopelen HA, Middleton KJ, Quinones MA, Zoghbi WA. Doppler estimation of left ventricular filling pressure in sinus tachycardia. A new application of tissue doppler imaging. Circulation. 1998;98:1644–1650. doi: 10.1161/01.cir.98.16.1644. [DOI] [PubMed] [Google Scholar]
- 2.Ommen SR, Nishimura RA, Appleton CP, et al. Clinical utility of Doppler echocardiography and tissue Doppler imaging in the estimation of left ventricular filling pressures: A comparative simultaneous Doppler-catheterization study. Circulation. 2000;102:1788–1794. doi: 10.1161/01.cir.102.15.1788. [DOI] [PubMed] [Google Scholar]
- 3.Abbas AE, Fortuin FD, Schiller NB, Appleton CP, Moreno CA, Lester SJ. A simple method for noninvasive estimation of pulmonary vascular resistance. J Am Coll Cardiol. 2003;41:1021–1027. doi: 10.1016/s0735-1097(02)02973-x. [DOI] [PubMed] [Google Scholar]
- 4.Nagueh SF, Appleton CP, Gillebert TC, et al. Recommendations for the evaluation of left ventricular diastolic function by echocardiography. J Am Soc Echocardiogr. 2009;22:107–133. doi: 10.1016/j.echo.2008.11.023. [DOI] [PubMed] [Google Scholar]
- 5.Ling LF, Obuchowski NA, Rodriguez L, Popovic Z, Kwon D, Marwick TH. Accuracy and interobserver concordance of echocardiographic assessment of right ventricular size and systolic function: a quality control exercise. J Am Soc Echocardiogr. 2012;25:709–713. doi: 10.1016/j.echo.2012.03.018. [DOI] [PubMed] [Google Scholar]
- 6.Tei C, Dujardin KS, Hodge DO, et al. Doppler echocardiographic index for assessment of global right ventricular function. J Am Soc Echocardiogr. 1996;9:838–847. doi: 10.1016/s0894-7317(96)90476-9. [DOI] [PubMed] [Google Scholar]
- 7.Tei C, Ling LH, Hodge DO, et al. New index of combined systolic and diastolic myocardial performance: a simple and reproducible measure of cardiac function--a study in normals and dilated cardiomyopathy. J Cardiol. 1995;26:357–366. [PubMed] [Google Scholar]
- 8.Rudski LG, Lai WW, Afilalo J, et al. Guidelines for the echocardiographic assessment of the right heart in adults: a report from the American Society of Echocardiography endorsed by the European Association of Echocardiography, a registered branch of the European Society of Cardiology, and the Canadian Society of Echocardiography. J Am Soc Echocardiogr. 2010;23:685–713. doi: 10.1016/j.echo.2010.05.010. quiz 786–8. [DOI] [PubMed] [Google Scholar]
- 9.Skrok J, Shehata ML, Mathai S, et al. Pulmonary arterial hypertension: MR imaging-derived first-pass bolus kinetic parameters are biomarkers for pulmonary hemodynamics, cardiac function, and ventricular remodeling. Radiology. 2012;263:678–687. doi: 10.1148/radiol.12111001. [DOI] [PMC free article] [PubMed] [Google Scholar]
- 10.Mischi M, Kalker TA, Korsten EH. Contrast echocardiography for pulmonary blood volume quantification. IEEE Trans Ultrason Ferroelectr Freq Control. 2004;51:1137–1147. doi: 10.1109/tuffc.2004.1334846. [DOI] [PubMed] [Google Scholar]
- 11.Meier P, Zierler KL. On the theory of the indicator-dilution method for measurement of blood flow and volume. Journal of Applied Physiology. 1954;6:731–744. doi: 10.1152/jappl.1954.6.12.731. [DOI] [PubMed] [Google Scholar]
- 12.Mischi M, Korsten HH. Transpulmonary dilution system identification for pulmonary blood volume measurements by contrast echocardiography. Conf Proc IEEE Eng Med Biol Soc. 2006;1:1818–1821. doi: 10.1109/IEMBS.2006.259882. [DOI] [PubMed] [Google Scholar]
- 13.Keys JR, Hetzel PS, Wood EH. Revised equations for calculation of blood flow and central blood volume from indicator-dilution curves. Journal of Applied Physiology. 1957;11:385–389. doi: 10.1152/jappl.1957.11.3.385. [DOI] [PubMed] [Google Scholar]
- 14.Kuenen M, Herold I, Korsten H, la Rosette de J, Wijkstra H, Mischi M. Maximum-likelihood estimation for indicator dilution analysis. IEEE Trans Biomed Eng. 2013 doi: 10.1109/TBME.2013.2290375. [DOI] [PubMed] [Google Scholar]
- 15.Valentinuzzi ME, Geddes LA, Baker LE. A simple mathematical derivation of the Stewart-Hamilton formula for the determination of cardiac output. Med Biol Eng. 1969;7:277–282. doi: 10.1007/BF02474767. [DOI] [PubMed] [Google Scholar]
- 16.Smith MD, Elion JL, McClure RR, Kwan OL, DeMaria AN. Left heart opacification with peripheral venous injection of a new saccharide echo contrast agent in dogs. J Am Coll Cardiol. 1989;13:1622–1628. doi: 10.1016/0735-1097(89)90357-4. [DOI] [PubMed] [Google Scholar]
- 17.Galanti G, Jayaweera AR, Villanueva FS, Glasheen WP, Ismail S, Kaul S. Transpulmonary transit of microbubbles during contrast echocardiography: implications for estimating cardiac output and pulmonary blood volume. J Am Soc Echocardiogr. 1993;6:272–278. doi: 10.1016/s0894-7317(14)80063-1. [DOI] [PubMed] [Google Scholar]
- 18.Mulvagh SL, Rakowski H, Vannan MA, et al. American Society of Echocardiography Consensus Statement on the Clinical Applications of Ultrasonic Contrast Agents in Echocardiography. J Am Soc Echocardiogr. 2008;21:1179–201. doi: 10.1016/j.echo.2008.09.009. quiz 1281. [DOI] [PubMed] [Google Scholar]
- 19.Lang RM, Bierig M, Devereux RB, et al. Recommendations for chamber quantification: a report from the American Society of Echocardiography’s Guidelines and Standards Committee and the Chamber Quantification Writing Group, developed in conjunction with the European Association of Echocardiography, a branch of the European Society of Cardiology. J Am Soc Echocardiogr. 2005;18:1440–1463. doi: 10.1016/j.echo.2005.10.005. [DOI] [PubMed] [Google Scholar]
- 20.Main ML, Grayburn PA, Lang RM, et al. Effect of optison on pulmonary artery systolic pressure and pulmonary vascular resistance. Am J Cardiol. 2013;112:1657–1661. doi: 10.1016/j.amjcard.2013.07.026. [DOI] [PubMed] [Google Scholar]
- 21.Wei K, Main ML, Lang RM, et al. The effect of Definity on systemic and pulmonary hemodynamics in patients. J Am Soc Echocardiogr. 2012;25:584–588. doi: 10.1016/j.echo.2012.01.019. [DOI] [PubMed] [Google Scholar]
- 22.Bursi F, Weston SA, Redfield MM, et al. Systolic and diastolic heart failure in the community. JAMA. 2006;296:2209–2216. doi: 10.1001/jama.296.18.2209. [DOI] [PubMed] [Google Scholar]
Associated Data
This section collects any data citations, data availability statements, or supplementary materials included in this article.
Supplementary Materials
The video clip depicts a representative example of echocardiographic contrast entering the right-heart, traversing the pulmonary circulation, and arriving in the left atrium (LA) prior to opacifying the left ventricle. The first appearance of contrast in the right ventricle occurs 56 frames into the clip with the initial appearance in the LA at 189 frames; the frame rate for this clip was 27 frames/second, yielding a pulmonary transit time (PTT) of 4.9 seconds.