

Background: Rhodopsins are the photoreceptors of the vertebrate eye.
Results: We characterized human rhodopsin by spectroscopic methods and developed a structural model based on the well studied bovine rhodopsin.
Conclusion: The activation pathways of the two receptors are similar. Differences exist between the inactive receptor conformations.
Significance: Our findings will allow a better mechanistic understanding of disease-causing human rhodopsin mutations.
Keywords: G protein-coupled receptor (GPCR), human, protein dynamic, receptor, rhodopsin, structure-function
Abstract
Rhodopsin, the photoreceptor of rod cells, absorbs light to mediate the first step of vision by activating the G protein transducin (Gt). Several human diseases, such as retinitis pigmentosa or congenital night blindness, are linked to rhodopsin malfunctions. Most of the corresponding in vivo studies and structure-function analyses (e.g. based on protein x-ray crystallography or spectroscopy) have been carried out on murine or bovine rhodopsin. Because these rhodopsins differ at several amino acid positions from human rhodopsin, we conducted a comprehensive spectroscopic characterization of human rhodopsin in combination with molecular dynamics simulations. We show by FTIR and UV-visible difference spectroscopy that the light-induced transformations of the early photointermediates are very similar. Significant differences between the pigments appear with formation of the still inactive Meta I state and the transition to active Meta II. However, the conformation of Meta II and its activity toward the G protein are essentially the same, presumably reflecting the evolutionary pressure under which the active state has developed. Altogether, our results show that although the basic activation pathways of human and bovine rhodopsin are similar, structural deviations exist in the inactive conformation and during receptor activation, even between closely related rhodopsins. These differences between the well studied bovine or murine rhodopsins and human rhodopsin have to be taken into account when the influence of point mutations on the activation pathway of human rhodopsin are investigated using the bovine or murine rhodopsin template sequences.
Introduction
Rhodopsin (Rho),6 the rod cell photoreceptor that mediates dim light vision in the vertebrate eye, is the archetype of class A G protein-coupled receptors (GPCR) and consists of 348 amino acids. It shares with other GPCRs a seven-transmembrane (TM) α helical structure. Rho is unique among GPCRs as its light-sensitive ligand 11-cis-retinal is covalently bound to the apoprotein via a protonated Schiff base. Light absorption induces 11-cis to all-trans isomerization thus replacing the inverse agonist by a strong agonist in situ. Subsequently the receptor proceeds through a number of intermediates, eventually leading to the late metarhodopsin states, which include the active form Meta II that binds and activates the G protein (1). Rho activation is the first step of a highly optimized catalytic system allowing single photon response due to high amplification on the background of virtually no dark noise.
The majority of biochemical and biophysical investigations on Rho were undertaken with the easily accessible bovine rhodopsin (bRho) (2). Bovine and human rhodopsin (hRho) show a sequence identity of 93.4% (3), with different amino acids at 23 positions (Fig. 1). Remarkably some sequence differences occur in regions that may play a crucial role during receptor activation. This applies to the connection from TM5 to the extracellular loop 2 (EL2, amino acids 175–198), hereafter defined as the T5E2C region, and amino acids 297–300 in the direct proximity of the Schiff base, which deprotonates during the transition from inactive Meta I to the active Meta II state (Fig. 2). Because both regions are connected to activating conformational changes, it is possible that these sequence alterations significantly affect the conformations of the dark state and light-activated photointermediates and thereby change the functional properties of the photoreceptor.
FIGURE 1.
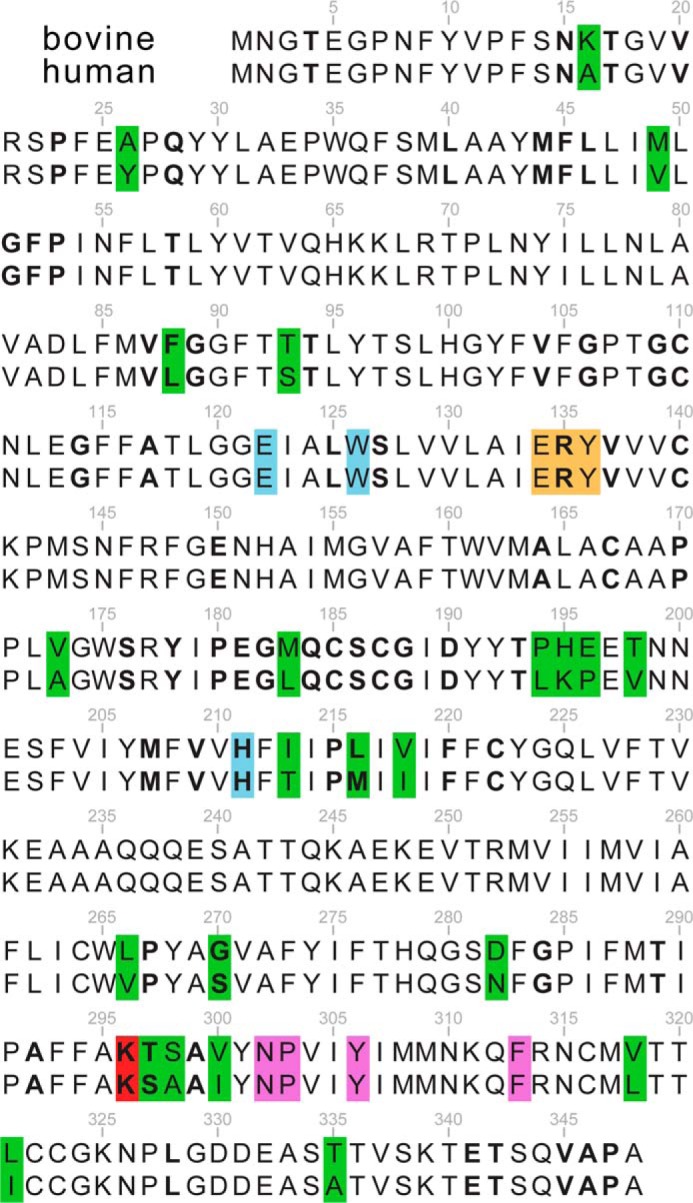
Sequence alignment of human and bovine rhodopsin. Green, differences between both sequences; orange, conserved D(E)RY motif; blue, TM3-TM5 microdomain (Glu-122, Trp-126, and His-211) near the retinal β-ionone ring; magenta, conserved NPXXY(X)5,6F motif; red, Schiff base lysine (Lys-296); the bold lettering denotes the known retinitis pigmentosa positions.
FIGURE 2.

Homology model and areas of interest. a, homology model of dark state human rhodopsin based on bovine rhodopsin structure (PDB entry 1U19) containing 11-cis-retinal bound via a protonated Schiff base to Lys-296 (red). Black boxes highlight the regions (amino acids 297–300) and (amino acids 194–198) that are in the focus of this study. Differences between human (green) and bovine (gray) amino acids are indicated. b and d, enlarged side view of the two regions shows the details of the structural differences. c and e, sequence alignment segments of bovine and human rhodopsin for residues 294–304 and 190–200 as well WebLogo diagram of all available mammalian rhodopsin sequences. Dashed arrows below e indicate the known secondary structure elements, namely EL2, TM5, and the T5E2C region (residues 194–198; TEC).
For our studies, bRho and hRho were expressed and purified in COS-1 cells, which yields sufficient quantities and purity to conduct spectroscopic investigations. Subsequent incorporation into lipid vesicles allows their investigation in a native-like membrane environment. The main technique of our investigation is FTIR difference spectroscopy, which has high structural sensitivity and allows investigation of Rho samples at physiologically relevant millimolar concentrations. Furthermore, the FTIR peptide binding assay applied here is capable of monitoring the conformational changes induced by binding of the C terminus of the Gt α-subunit to the active receptor (4–6). The spectroscopic data are complemented by classical molecular dynamics (MD) simulations of the dark state and active conformations of hRho and bRho, and the G protein activation capability was tested using a catalytic fluorescence assay.
At least 100 mutations at 68 positions (see Fig. 1) in Rho genes are known to cause retinitis pigmentosa, which is linked to a gradual loss of peripheral and night vision (see Ref. 2 for examples). Some of these mutations have an effect on the structural integrity of the protein like impairment of protein folding and transport (7). Other mutations primarily have an impact on the conformational equilibria of the agonist-bound receptor (Meta-equilibria) (8), whereas congenital night blindness is predominantly caused by an increase in constitutive activity (9). Many of these diseases are caused by single amino acid mutations. The structural and mechanistic differences between bRho and hRho found in this study should thus be considered when the activation pathway of malfunctioning human receptor mutants is investigated.
Experimental Procedures
Sample Preparation
For expression in COS-1 cells (ATCC, CRL-1650), a human codon-optimized synthetic Rho DNA fragment (corresponding to amino acids 1–348 of the native protein, accession number NP_000530) containing the C-terminal TETSQVAPA sequence (1D4 epitope; Ref. 10) was designed and purchased from MWG (Eurofins MWG Operon Ebersberg, Germany). The synthetic Rho DNA was inserted between the EcoRI-NotI sites of the expression vector pMT4 (11). Human Rho expressed equally well as wild type bRho. Purification and reconstitution of hRho could be performed in the same way as described for bRho, including the elution procedure and incorporation into egg-phosphatidylcholine vesicles (12). To ensure that the detergent was completely removed after the dialysis procedures, the samples were centrifuged for 1 h at 200,000 × g, and the supernatant was checked by UV-visible spectroscopy for protonated retinal Schiff Base.
FTIR and UV-visible Spectroscopy
All spectroscopic measurements were performed on a Bruker ifs66v/s IR-spectrometer coupled via fiberoptics to an OLIS RSM UV-visible-spectrometer for simultaneous data acquisition in the infrared and UV/visual range. The samples were illuminated (10 s) during the measurement with LEDs (λmax = 580 nm, Meta I and Meta II conditions; λmax = 470 nm, Batho and Lumi conditions) to achieve full bleaching. The data acquisition was done in the Rapid-Scan mode with a quasi-logarithmic time resolution >171 ms. The recorded datasets were linearly corrected for small temperature-dependent. To obtain sets of difference spectra, the whole dataset was subtracted from the average of all spectra recorded before illumination. Because a photostationary state is usually not reached due to the overlay of formation and decay processes of the different species, the difference spectra of the intermediates and their kinetics were determined by a singular value decomposition (SVD) method and global fitting procedure (13). The procedure yields the spectral characteristics of the reaction separated by their different kinetics (pure components). To unveil even minute differences between the species under the same conditions, the double difference spectra were calculated by subtracting the spectra of hRho from the bRho counterparts, normalized to the chromophore fingerprint band at 1237 cm−1. For complex formation, a G protein-derived high affinity peptide GtαCT (Gtα 340–350) K341L, NH2-ILENLKDCGLF-COOH) was used in a 1:5 (Rho:peptide) molar ratio. Absorption maxima determination as well as concentration measurements during purification of all pigments were performed on a Varian Cary 50 Bio UV-visible spectrometer.
Flash Photolysis
The kinetics of Meta II formation of bRho and hRho as well as of the chimeras were determined by flash photolysis of diluted vesicle suspensions (5 μm) at 20 °C, pH 5, where Meta II formation is complete. After illumination with a laser flash (5 ns) at 532 nm (Orion, New Wave Research), the integrated absorbance change between 375 and 385 nm was recorded with an OLIS UV-visible spectrometer using a time resolution of 100 μs.
Gt Activation Assay
Gt was prepared from bovine rod outer segments, separated into Gtα and Gtγ subunits by chromatography as described previously (14), and dialyzed against 20 mm bis-tris-propane, pH 7.1, 130 mm NaCl, 1 mm MgCl2, and 2 mm DTT. Protein concentration was determined with a Bradford reagent.
As a monitor for the Gt activation capacity of the Rhos, changes in intrinsic fluorescence intensity of the Gtα subunit upon the activating exchange of GDP to GTPγS were quantified as previously described (15). The measurements were carried out using a SPEX fluorolog II spectrofluorometer equipped with a 450-watt xenon arc lamp. For all activation measurements, settings were λex = 300 nm and λem = 340 nm with an integration time of 1 s. Gt activation rates were measured with 5 nm purified Rho, 0.6 μm Gt, 25 μm GTPγS, 20 mm bis-tris-propane, pH 6.0, 130 mm NaCl, 1 mm MgCl2, 2 mm DTT, and 0.01% (w/v) n-dodecyl-β-d-maltoside in a final volume of 750 μl. The pH value was adjusted by the addition of HCl or NaOH, respectively, directly into the cuvette to avoid differences in n-dodecyl-β-d-maltoside concentration. All samples were equilibrated at 10 °C for 4 min. Gt activation reactions were triggered with orange light (495-nm long pass filter, Schott GG 495). The Gt activation rate was obtained by linear regression of the initial rise in fluorescence emission.
Human Rhodopsin Model Building
A homology model of hRho was built based on the high resolution crystal structure of dark and active bRho (PDB entries 1U19 (16) and 3PXO (17)). The amino acid sequence of hRho differs in 23 positions compared with bRho. After mutating the respective residues to create hRho structure, the side-chain conformations were chosen based on the 2002 Dunbrack backbone-dependent rotamer library (18). For each of the mutated amino acids the library contained a standard rotamer that fitted without clashes into the template structure. With the exception of H195K and L216M, the highest or the second highest populated backbone-dependent rotamer was a good fit and thereby indicated a very regular structure. For H195K the first rotamer that did not point the lysine to the groove between the N-terminal β-sheets and TM5 was chosen. Met-216 faces toward TM6 and is surrounded by two tyrosines, +/− one turn, so the first rotamer clashing with neither was chosen. As part of the molecular dynamics protocol (see below), this model was inserted into a lipid bilayer, solvated in water, then energy-minimized and relaxed within the water/lipid environment. Neither the energy minimization nor the relaxation significantly changed the rotamers of the mutated residues or their neighboring residues.
Preparation of Bovine and Human Rhodopsin Structures
The starting conformations used for MD simulations were prepared based on x-ray structures from crystals of dark (PDB entry 1U19 (16)) and active bRho (PDB entry 3PQR or 3PXO (17)). The far C terminus of active bRho (residues 327–348; UniProt entry P02699) is not resolved in these complexes and was not modeled, as it does not affect receptor function significantly, including Gt activation (19). For all MD simulations of Rho, two palmitoyl chains were attached to the residues Cys-322 and Cys-323. For the MD simulations of hRho we used the modeled structure as described above.
Molecular Dynamics Protocol
System preparation, subsequent minimization, equilibration, and simulation were performed with the GROMACS suite (Version 4.5) (20). The proteins were inserted into the equilibrated bilayer of 1,2-dimyristoyl-sn-glycero-3-phosphatidylcholine using the GROMACS embedded tool (21). Parameters for the 1,2-dimyristoyl-sn-glycero-3-phosphatidylcholine lipids were derived from Berger et al. (22) and for water from the SPC/E model (23). A salt concentration of 0.15 mol/liter was obtained by adding Na+ and Cl− ions to the system. The AMBER99SB-ILDN force field (24) was used for proteins and ions. Force field parameters for the protonated 11-cis-retinal in inactive Rho were adapted from Kandt et al. (25) and for the deprotonated all-trans-retinal in active Rho from Mertz et al. (26).
To obtain clash-free structures suitable for MD simulations, an energy minimization was performed in GROMACS using the steepest descent algorithm until the maximum force went below 1000.0 kJ/mol/nm. In the following equilibration step the energy-minimized structure was simulated for 20 ns with all protein backbone atoms restrained to their initial positions. During this step the protein-membrane, protein-water, and the membrane-water interfaces are relaxed so that voids are filled and side-chain packing is optimized. For the production MD simulations the position restraints were lifted.
Based on the equilibrated systems, the production runs were started with different initial velocities obtained from Boltzmann distributions at 320 K. For equilibration and the production runs, all bonds were constrained using the LINCS algorithm (27) with the exception of water bonds, which were constrained by the SETTLE algorithm (28). The temperature was kept constant by coupling the system to a temperature bath of 320 K, which is high enough to keep the 1,2-dimyristoyl-sn-glycero-3-phosphatidylcholine membrane from entering the gel phase. The temperature coupling was performed using the velocity-rescaling thermostat of Bussi et al. (29) with a time constant of 0.2 ps. Long range electrostatics were calculated with the particle-mesh Ewald method (30). Berendsen pressure coupling was performed with a time constant of 2.0 ps and semi-isotropic scaling separating scaling in the membrane plane directions from the z-direction (i.e. the membrane plane normal). The integration time step used for all simulations was 0.002 ps.
Results
A Structural Model of Human Rhodopsin from MD Simulation
The 23 amino acids of the bRho sequence, which differ from the hRho sequence, were exchanged to obtain models of hRho from crystal structures of the dark (PDB entry c1U19 (16)) and the active (PDB entry 3PXO (17)) conformations (for details see “Experimental Procedures”). The resulting structures of the hRho dark state (Fig. 2a) prove to be stable during classic MD simulations when embedded in a water/lipid environment and closely resemble the bovine template. Structures of bRho and hRho were subsequently simulated and analyzed with regard to alterations in the region around the Schiff base and in the extracellular end of TM5 (T5E2C region).
The amino acid triplet Thr-297, Ser-298, and Val-300, which is located in the direct vicinity of the retinal Schiff base (Lys-296) is changed in hRho to Ser-297, Ala-298, and Ile-300 (Fig. 2, b and c). Ala-298 is the only of these three residues that is buried inside the protein moiety. In bRho Ser-298 together with Met-86 and Trp-265 separates a cluster of conserved water molecules from the Schiff base (31). The atomic volume of Ala-298 (59.87 Å3) is smaller than Ser-298 (65.34 Å3), leaving an additional space of 5.47 Å3. Assuming a van der Waals radius of 1.2 Å (5.43 Å3) for water (32), this additional space suggests the existence of a narrow continuous water pore formed in hRho connecting the two water-filled cavities above the retinal binding pocket (Fig. 3). Due to the different physicochemical properties of serine and alanine, the electrostatics of the retinal Schiff base region are distinct in hRho and bRho.
FIGURE 3.
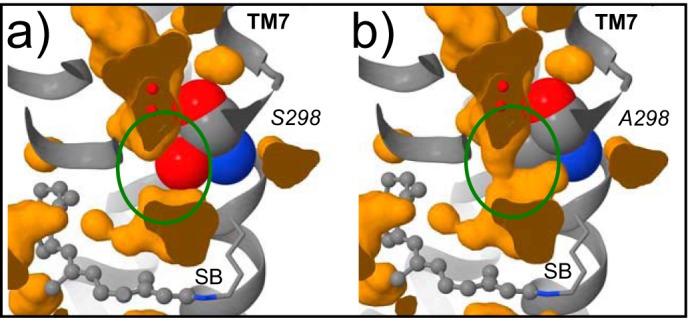
Comparison of the region around residue 298 (spacefill depiction) of inactive bovine (a) and human (b) rhodopsin. Shown are interior pockets that fit a probe of radius 0.8 Å (orange). The change of Ser-298 in bovine rhodopsin into Ala-298 in human rhodopsin presumably leads to a continuous pore accessible to water molecules (small red spheres) near residue 298 and the retinal SB.
Additionally, the residues 194–198 (TM5 to EL2 connection: T5E2C region) are different in hRho (Fig. 2, d and e). To investigate the effect of this exchange on the structure and dynamics of the T5E2C region, we performed a series of 200–400-ns classic all-atom MD simulations of the hRho and bRho dark and active states in a membrane/water environment. Analysis of the T5E2C region indicates differences in secondary structure between hRho and bRho. In bRho the prevalent structural elements are turn structures, whereas in hRho mostly bended and 310-helix structural elements are found (supplemental Fig. 1). To obtain a more detailed description of the T5E2C region, we performed a cluster analysis of its structure during simulation. The three largest clusters in each series of MD simulations show the conformational flexibility in the T5E2C region of dark/active state of bovine/human Rho (Fig. 4). A considerable difference is seen in the variability of the T5E2C region relative to TM5. In bRho the T5E2C moves parallel to the TM5 axis (so called flapping motion), whereas in hRho it additionally moves perpendicular (sliding motion), which is most pronounced in the active state of hRho. This difference can be explained by the variation of hydrogen bonding networks stabilizing the T5E2C region in the two pigments. In bRho the T5E2C region is attached to the end of TM5 through a rigid backbone-backbone hydrogen bond between Glu-196 and Thr-198 (Fig. 4e), hampering motions perpendicular to the TM5 axis. In hRho this interaction is displaced in favor of a hydrogen bond between Glu-5 from the nearby N terminus and Lys-195 (Fig. 4f). This hydrogen bond appears to weaken the linkage of the T5E2C region to the end of TM5, promoting motions perpendicular to the TM5 axis (Fig. 4, supplemental Fig. 1).
FIGURE 4.

Conformational flexibility of T5E2C and adjacent residues analyzed by MD simulations of bovine (a and c) and human (b and d) rhodopsin holoproteins in their dark (a and b) and active (c and d) state. For each system three representative conformations (red, orange, yellow) obtained by cluster analysis are shown. The tube thickness relates to fluctuations of each residue (root mean square fluctuations) within a given cluster. In the simulations of bovine rhodopsin a subset of the EL2/TM5 region shows a flapping motion (solid arrows), whereas in human rhodopsin the whole region shows a sliding (dashed arrows) and, in the active state additionally, a flapping motion (solid arrow) effecting more residues. e and f, hydrogen bonds in the TEC region of bovine and human rhodopsin. e, in bovine rhodopsin a backbone-backbone hydrogen bond is prevalent between Glu-196 and Thr-198, whereas in human rhodopsin a hydrogen bond is observed between Glu-5 and Lys-195 (f).
Early Intermediates of Human and Bovine Rhodopsin
In Fig. 5, a and b, we compare the FTIR difference spectra (illuminated state minus dark state) of hRho (green lines) and bRho (gray lines) of the early intermediates bathorhodopsin (Batho) and lumirhodopsin (Lumi), recorded at 80 K and 173 K, respectively. The Batho spectra of both species exhibit the typical difference bands, which mainly reflect changes of the retinal/Schiff base geometry due to cis/trans isomerization (C=N stretching at −1663 cm−1; C=C ethylenic modes at −1560/+1537 cm−1; C —C stretching, C—H bending, and N—H bending vibrations at −1237 cm−1, and hydrogen out of plane (HOOP) vibrations at +920 cm−1) (33, 34). The superscripts + and − indicate the polarity of the bands in the difference spectra. For a better comparison, the bovine minus human Batho double difference spectrum (hereinafter dd spectrum) is given in Fig. 5a (blue line). The weak double difference bands indicate small structural differences between the two dark states and/or the intermediates of both species, presumably within the proximity of the altered amino acids near the retinal pocket. The absorption shift of 4 nm in hRho (494 nm) versus bRho (498 nm) in the dark state (see the inset in Fig. 5a) shows the influence of these altered amino acids already in the dark state.
FIGURE 5.
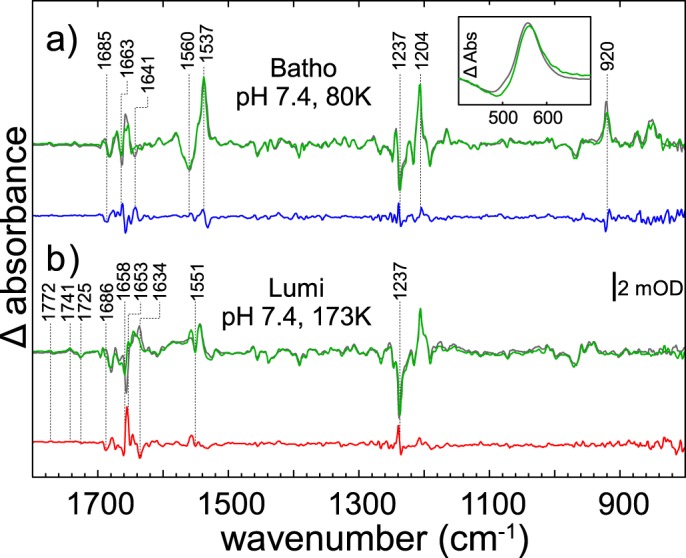
FTIR difference and double difference spectra of the early intermediates of human (green lines) and bovine (gray lines) rhodopsin. a, Batho spectra were recorded at pH 7.4, 80 K. The double difference (human minus bovine, blue line) indicates marginal deviations at this early stage of the photoreaction. b, Lumi spectra obtained at pH 7.4, 173K; the double difference (red line) reveals more distinct shifts of characteristics bands in the amide-I region.
The FTIR spectra of the bovine and human Lumi intermediates are compared in Fig. 5b (hRho, green line; bRho, gray line). In both spectra, the characteristic Lumi difference bands are seen at +1772/−1767, +1741, −1725, and −1658/+1653 cm−1. The −1658/+1653 cm−1 bilobe is located in the region indicative for changes of the C=N stretching vibration of the protonated Schiff base (35) and most likely corresponds to the slightly different dark state UV-visible absorptions of both pigments as described above. Similar to Batho, the Lumi difference spectrum is dominated by bands caused by the retinal cis/trans isomerization. More pronounced bands as compared with Batho are observed in the dd spectrum (Fig. 5b, red line) at +1556 (ethylenic modes, amide-II range), −1634 (amide-I range), and +1240 cm−1 (chromophore fingerprint region). Especially the negative bands at −1658 and −1239 cm−1 may be attributed to slightly altered interactions of protein and chromophore in the dark state due to an altered Schiff base environment.
The Meta I States of Human and Bovine Rhodopsin
We next recorded difference spectra of hRho and bRho (Fig. 6a, green and gray lines) under conditions that favor formation of the Meta I intermediate in bRho (0 °C, pH 8) (36, 37). To ensure that in hRho a Meta I species is also formed, we conducted the same experiment at lower temperatures (pH 8, −40 °C), conditions under which the transition to Meta II is expected to be completely blocked. We observed the same difference spectrum as seen at 0 °C (data not shown), demonstrating formation of a human Meta I intermediate. In contrast to Batho and Lumi, the spectra now show significant deviations, leading to strongly increased band intensities in the dd spectrum (Fig. 6a, blue line). This bands are caused by deviations in the amide I and amide II regions around 1650 and 1550 cm−1 and around −1768/+1745 cm−1, indicative of hydrogen bond changes of Asp-83 and Glu-122 as well as bands at −1237 and −1190 cm−1, suggesting altered chromophore/protein interactions (34). To clarify whether the difference band at +1745 cm−1 was caused by an altered TM3-TM5 hydrogen-bonded network (nearby Glu-122) or has its origin in a different Schiff base vicinity (nearby Asp-83), we recorded difference spectra under the same conditions but after H2O/2H2O buffer exchange (Fig. 6b), which leads to a specific isotopic shift of all hydrogen-coupled vibrations (38). The spectra show no deuteration-induced shift of the double difference band at +1745 cm−1, indicating altered interactions of amino acids with e.g. lipid, rather than by changes of Glu-122 or Asp-83 (12, 39).
FIGURE 6.
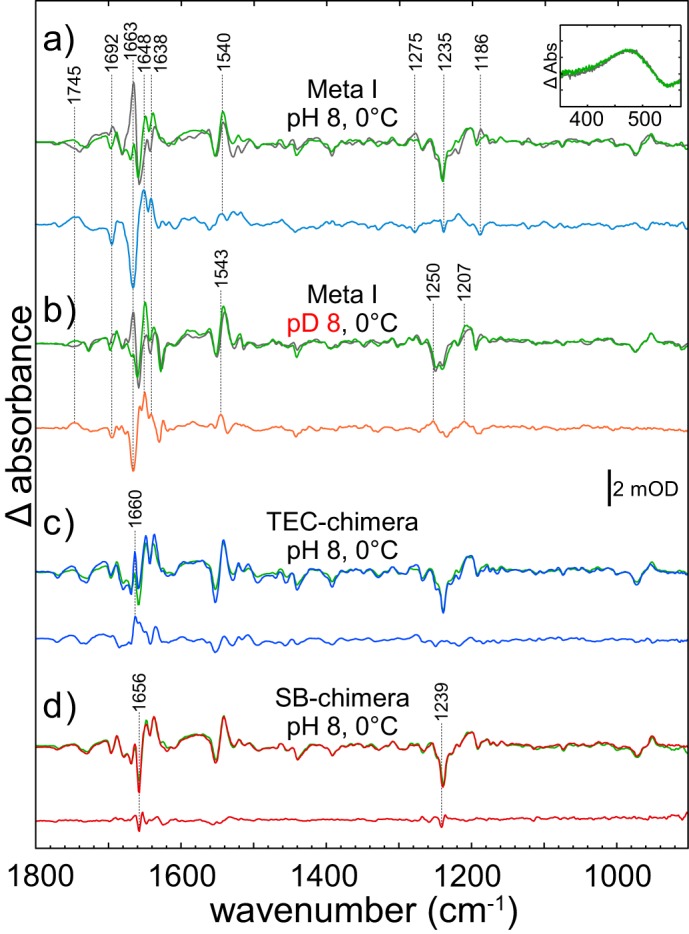
Coupled FTIR and UV-visible (inset) spectroscopy of human (green lines) and bovine (gray lines) rhodopsin under conditions favoring Meta I (pH 8, 0 °C). a, difference spectra in H2O. Remarkable are the large deviations between both pigments, indicated by the intense dd-spectrum (blue line). Especially, the most prominent band of bovine Meta I is absent in human spectrum (shown by the strong band at 1663 cm−1 in the dd-spectrum). b, the same measurement in 2H2O. The large deviations between both pigments remain as demonstrated by the dd-spectrum (orange line). c, FTIR difference spectra of human rhodopsin and TEC chimera (blue line). The T5E2C region (amino acids 194–196) of human rhodopsin (LKP) was replaced with the bovine sequence (PHE). Note the reappearance of the Meta I marker band at 1660 cm−1 in the spectrum of the chimera. d, FTIR difference spectra of human rhodopsin and SB chimera (dark red line). The sequence between the Schiff base and the NPXXY(X)5,6F motif (amino acids 297–300) of human rhodopsin (SAAI) was replaced with that of bovine (TSAV). Only small deviations in the amide-I and amide-II regions are observed in the dd-spectrum.
The most significant deviation between the wild type spectra of hRho and bRho refers to the Meta I marker band of bRho at +1661 cm−1 (−1663 cm−1 in the dd spectrum), which is strikingly not observed in the spectrum of hRho (reflected as a negative band in the dd spectrum). The band is replaced by two bands at +1648 and +1638 cm−1, respectively. Remarkably, in a hRho chimera, in which the T5E2C region was replaced by the corresponding bovine sequence 194PHE196 (TEC chimera; Fig. 6c, blue line), this Meta I marker band of bRho (+1661 cm−1) arises again, albeit with lower intensity. This finding indicates that structural changes in the T5E2C region are at least partially responsible for the +1661 cm−1 band in Meta I and that the altered sequence in hRho causes the overall smaller intensity of this band. The dark state UV-visible absorption maximum of the TEC chimera was determined to be 492 nm (data not shown).
In a further hRho chimera, the sequence 297SAAI300 in the Schiff base (SB) proximity was replaced by the bRho sequence 297TSAV300 (SB chimera). Although Meta I formation was not significantly influenced in the SB chimera, the absorption maximum of the chimera (497 nm) resembled that of bRho (498 nm), indicating the influence of the region on wavelength tuning. The Meta I difference spectrum of the SB chimera was almost identical to that of hRho (Fig. 6d, green and red line), although the band at −1237 cm−1 was shifted back to the frequency of bRho at −1238 cm−1.
The Meta II States of Human and Bovine Rhodopsin
Metarhodopsin II, formed at higher temperatures, is characterized by a deprotonated retinal Schiff base leading to a shift of the absorption maximum to λmax = 380 nm. However, Meta II has been shown to consist of at least three conformationally distinct states, namely Meta IIa, Meta IIb, and Meta IIbH+, which can be stabilized at different pH values and temperatures (40). Because the pKa values of the Meta I/Meta II equilibrium did not show significant deviations between hRho and bRho (compare Fig. 8b), we assumed that the subspecies of hRho are stabilized at similar conditions as their bovine counterparts. In Fig. 7a we show the difference spectra of bRho and hRho (gray and green line) recorded at pH 8 and 30 °C, where a mixture of Meta IIa/IIb prevails, with some residual Meta I. In Fig. 7b the respective Meta IIbH+ spectra (recorded at pH 5 and 30 °C) are presented. The absorption maxima of the UV-visible spectra at 380 nm (insets in Fig. 7, a and b) show in both cases the proper formation of the deprotonated Schiff base. The spectra taken at alkaline pH, pH 8, exhibit the typical Meta IIa/IIb marker bands at −1768/+1746, −1728/+1711, −1656, and +1536 cm−1 (37). In the respective dd spectrum (Fig. 7a, purple line) we observed only very small double difference bands indicating similar formation of these two Meta II subforms. The remaining deviations, e.g. at 1658 cm−1 and the small shift of the positive amide-I band (+1646 cm−1 in human, +1644 cm−1 in bovine) are most likely attributed to slightly different amounts of residual Meta I or to differences between the two dark states as already suggested by the analysis of the intermediates Batho, Lumi, and Meta I. The similarity between the dd spectra of Meta IIa/IIb and Meta IIbH+ formation (Fig. 7, a, purple line, and b, blue line) show that, in contrast to Meta I, no significant structural deviations occur between human and bovine Meta II intermediates.
FIGURE 8.
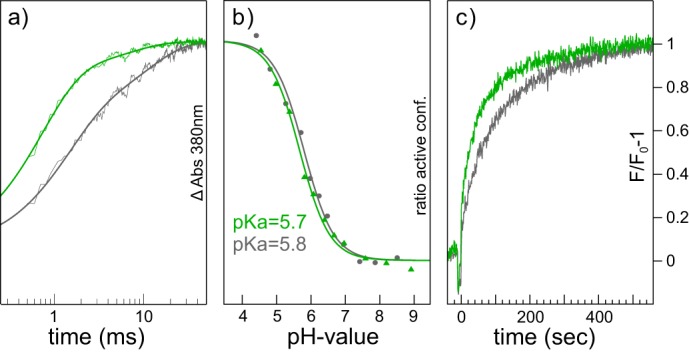
Flash photolysis, titration behavior, and G protein activation assay of human (green lines) and bovine (gray lines) rhodopsin. a, formation of Meta II as monitored by the absorption increase at 380 nm after a 532-nm laser flash under Meta II conditions (pH 5, 20 °C). All signals show a biphasic time course. Meta II formation in human rhodopsin predominantly follows the fast kinetics, whereas in bovine rhodopsin both components are almost equally expressed. b, pH titration curves of the absorbance change at 1744 cm−1 (protonation state of Asp-83 as monitor for the retinal Schiff base) normalized to the acidic and alkaline end point levels derived from a regular Henderson-Hasselbalch fit. c, G protein activation (pH 7, 20 °C) as monitored by change of the intrinsic tryptophan fluorescence. Both proteins show similar Gt activation.
FIGURE 7.
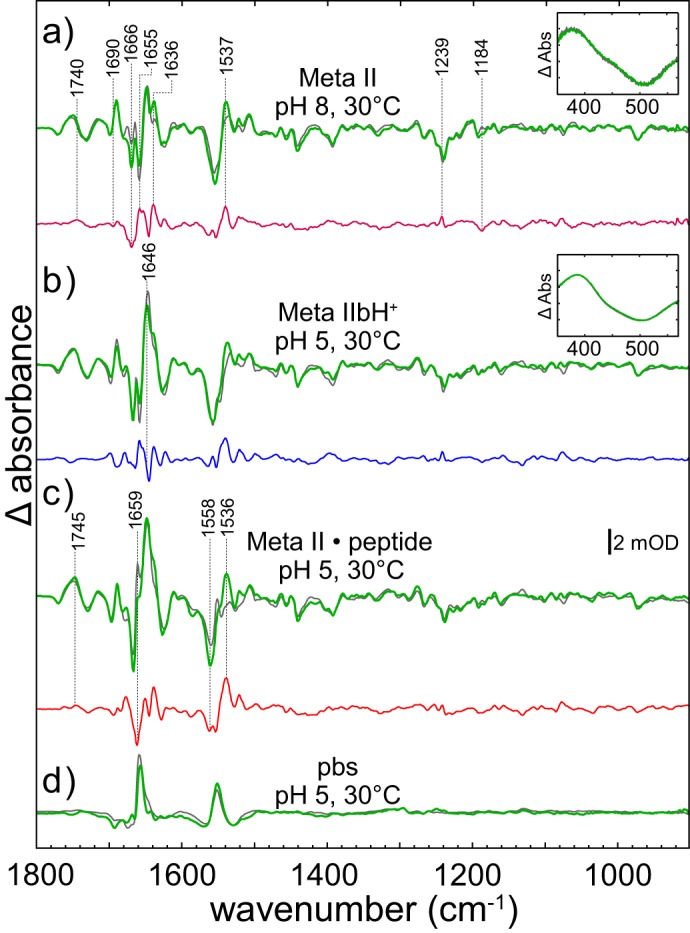
Coupled FTIR and UV-visible (insets) spectroscopy of the late human (green lines) and bovine (gray lines) intermediates. a, conditions favoring a mixture of Meta states (pH 8, 30 °C). In the double difference spectrum (purple line) the bands are less intense as compared with the Meta I conditions. b, spectra recorded at pH 5, 30 °C indicate a transition from the dark state toward the fully active state Meta IIbH+. The weak bands in the double difference (blue line) demonstrate that the active states of human and bovine rhodopsin are largely similar. c, spectra of the complex formation of active Meta IIbH+ and high affinity GtαCT peptide (Meta II·peptide). The double difference (red line) exhibits more pronounced bands than in the case of Meta IIbH+. d, in contrast, the peptide binding spectra (pbs, difference spectrum of Meta II·peptide-minus-difference spectrum of Meta IIbH+ formation) of both pigments are closely similar. Note that, due to difference formation, the influence of the dark state on these spectra is negligible.
Peptide-bound Meta II State of Human and Bovine Rhodopsin
To investigate the G protein interacting subforms of Meta II, we recorded the Meta II·peptide-minus-dark states difference spectra of hRho and bRho (pH 5, 30 °C, Fig. 7c, green and gray lines) formed in the presence of an 11-mer peptide derived from the C terminus of the G protein α-subunit (GtαCT) (41). Compared with the Meta IIbH+, the difference spectra of both human and bovine Meta II·peptide exhibit bands at +1659 and −1558 cm−1, which are specific for the Meta IIbH+/peptide interaction. These two bands and the positive band at +1536 cm−1 are much less pronounced in hRho, giving rise to bands in the dd spectra shown in Fig. 7c, red line.
The dd spectra between Meta II·peptide and Meta IIbH+ (peptide binding spectra pbs, representing structural changes in receptor and peptide due to peptide binding) show, however, the typical bands at +1555 and +1660 cm−1 (Fig. 7d). They are even more similar, as the pbs are not influenced by structural differences between the dark states of hRho and bRho, which are superimposed in the Meta II·peptide-minus-dark state differences. These results indicate that GtαCT binds and stabilizes very similar receptor conformations in bRho and hRho and that the same interactions are involved in formation of the stable receptor-peptide complex. The similarity between the double differences of bRho and hRho and the identical peptide binding spectra confirms our notion that the differences between the Meta II spectra (Fig. 7, a–c) indicate structural deviations between the two dark states.
Meta II Formation and G Protein Binding in Human and Bovine Rhodopsin
The kinetics of Meta II formation of hRho and bRho were investigated by flash photolysis. Upon illumination with a short laser flash (5 ns) at 532 nm, the absorption at 380 nm increases, indicating formation of Meta II, which exhibits a deprotonated Schiff base (Fig. 8a). In the case of bRho the reaction clearly shows biphasic behavior due to the existence of two reaction pathways culminating in Meta II (42, 43); the rate constants are 750 s−1 and 93 s−1, respectively, in accordance with published data (44). The amplitudes for the fast and slow pathway were determined to 62% (fast) and 38% (slow). For hRho we used the same fitting model to compare rates and amplitudes of the two activation pathways. In hRho, Meta II formed almost exclusively via the fast pathway (85%) with rate constants for the fast and slow components of 1400 s−1 and 150 s−1, respectively. The rate constants for the TEC and SB chimera are given in Table 1 for comparison.
TABLE 1.
Dark state absorption maxima and kinetic properties of Schiff base deprotonation
λmax, absorption maximum of solubilized pigments (bRho, hRho, TEC chimera, and SB chimera) in visual range; kfast and kslow, rate constants of fast and slow component respectively; fast and slow, percentage of components following fast and slow pathway.
| bRho | hRho | TEC | SB | |
|---|---|---|---|---|
| λmax (nm) | 498 | 494 | 492 | 497 |
| kfast (s−1) | 750 | 1400 | 2100 | 1500 |
| kslow (s−1) | 93 | 150 | 96 | 150 |
| Fast (%) | 62 | 85 | 90 | 89 |
| Slow (%) | 38 | 15 | 10 | 11 |
To determine the pKa value of the Meta I/Meta II equilibrium, we recorded a series of infrared difference spectra at different pH values in the range between 4.4 and 8.0 at 20 °C and determined the amount of Meta II as estimated by the normalized intensity change of the typical marker band at +1744 cm−1, which reflects activating changes in hydrogen bonding of Glu-122 (34). A fit of the data to a regular Henderson-Hasselbalch equation (Fig. 8b, green, hRho; gray, bRho) yields almost identical pKa values for hRho (5.7) and bRho (5.8), indicating a negligible influence of the sequence alterations on the Meta I/Meta II equilibrium.
We also compared the rates of Gt activation by bRho and hRho using the intrinsic tryptophan fluorescence induced by GTPγS uptake in the bovine G protein at pH 7 and 20 °C (Fig. 8c, green, hRho; gray, bRho) (45). Human Meta II activates bovine Gt at a rate of 1.25 Gt proteins per second (Gt/R*s, where R* is activated rhodopsin), and bovine Meta II showed an activation rate of 0.92 Gt/R*s. These differences are, however, within the experimental error. Note that Rho interacting α- and γ-subunits of human and bovine transducin differ only at 3 and 1 positions, respectively, and the crevice binding C terminus of the α-subunit even exhibits the same sequence. Therefore, it is comprehensible that the pbs spectra do not differ (Fig. 7d) and the influence on G protein binding is, if at all, only marginal (Fig. 8c). This was expected as even ancestral archosaur pigments activate the retinal G protein with a comparable rate (46).
Discussion
The aim of this study was to compare the activation pathways of bRho and hRho with respect to structure, function, and kinetics of photointermediate formation. For this purpose we first analyzed the sequences of both pigments and modeled and simulated the structures of dark and active state of hRho on the basis of the available crystal structures of bRho. The combination of these modeling techniques with FTIR difference spectroscopy of the photointermediates provides us with a detailed picture of conformational changes involved in activation. Thus we can describe the similarities and differences between these two photoreceptors.
Structural Differences between Bovine and Human Rhodopsin
In the majority of the 23-amino acid alterations, the chemical and physical side-chain properties are preserved (i.e. F88L, T93S, V173A, V218I, L266V, L321I), and no major influence on receptor function is expected. However, significant differences occur in two distinct regions with potential influence on receptor structure (Fig. 1) and may thus have functional consequences.
The first region comprises the residues 297–300 in the direct vicinity of the retinal Schiff base with the sequence 297SAAI300 in hRho and 297TSAV300 in bRho (Fig. 2, b and c). The serine to alanine exchange may contribute to two distinct effects on the retinal Schiff base environment. First, the electrostatic properties of the retinal Schiff base environment will be altered when the hydroxyl group is removed. Second, our simulations reveal additional space in hRho (Fig. 3), potentially occupied by an additional water molecule, which influences the vicinity of the Schiff base (47) and thus the UV-visible absorption maximum (48) and the typical infrared absorptions of the dark state. In agreement, the absorption maximum of the SB chimera, in which the bovine 297TSAV300 sequence was introduced, was shifted back toward that typical of bRho, whereas the kinetics of Meta II formation remain the same as seen by hRho, suggesting only a local influence of the TSAV region on the retinal Schiff base.
The second sequence deviation comprises the T5E2C region (residues 194–198) at the connection from TM5 to EL2 (Fig. 2, d and e). The human T5E2C sequence is conserved in many mammalian rhodopsins, except in Rho of sea mammals or nocturnal animals including bRho (see the Weblogo plot in Fig. 2, c and e). The differences in the T5E2C region alter its hydrogen bond network with the end of TM5 and leads, according to our MD simulations, to a considerable difference in conformational flexibility of the T5E2C region. In bRho this region exhibits a flapping motion during the MD simulations that still allows coupling of EL2 motion to TM5 movement, whereas in hRho the whole region shows an additional sliding motion that loosens the tight EL2/TM5 coupling (see Fig. 4). Consequently, in bRho this region functions as a rigid lever (49), whereas in hRho it is a rather flexible linker with limited ability to trigger TM5 movement connected with Meta I formation (50). Together with the faster formation of the Schiff base deprotonated species, this implies that necessary conformational changes must already have taken place before the formation of Meta I or do not have to take place in hRho. Our simulations suggest that the loosening of the EL2/TM5 coupling present in the active conformation of bRho is anticipated in the dark state of hRho. The dynamic properties of the EL2 have previously been connected with the constitutive activity of other GPCRs (51, 52). Note that sequence differences in the 297–300 region around the Schiff base could also contribute to constrictions in EL2 motion and consequently be responsible for the limitation of TM5 movement in Meta I. However, replacing amino acids 194–196 of the human receptor with the bovine sequence, as in the TEC chimera, does partially restore the bovine Meta I difference spectrum (especially the band at 1661 cm−1) (Fig. 6c). Consequently, we favor the view that the alteration in the T5E2C region influences TM5/EL2 coupling linked to Meta I formation. Interestingly the absorption maximum of the TEC chimera is shifted to 492 nm. This indicates a long range influence of this region on the electrostatic properties of the Schiff base and/or the retinal environment, which is most likely caused by slight rearrangements of the helical bundle in the inactive conformations including the dark state.
Differences between the Activation Pathway of Bovine and Human Rhodopsin
Rho activation is known to proceed gradually from the photochemical core to the cytoplasmic surface. This means that changes due to photon absorption are initially localized to the retinal itself leading to its ultrafast isomerization. Consequently, the first stable intermediate, Batho, shows virtually no structural changes of the ligand binding pocket. This results in a highly constrained all-trans-retinal configuration indicated by a red-shifted absorption maximum (53). The first significant side chain movements take place during formation of the Lumi intermediate (54). FTIR difference spectra can only reflect those parts of the protein that undergo changes during the reaction investigated. Consistently, bands in the Batho and Lumi FTIR difference spectra are confined to changes of the retinal geometry due to cis/trans isomerization and direct interaction with adjacent groups. The small differences between the Batho and Lumi FTIR difference spectra of hRho and bRho, albeit more pronounced in Lumi, are predominantly due to differences in the sequence around the Schiff base (297SAAI300 in hRho and 297TSAV300 in bRho), which are also indicated by different UV-visible absorption maxima in the dark state.
Our FTIR results reveal the first significant differences between the two activation pathways in the Meta I difference spectra of both pigments. Especially, the positive band at 1661 cm−1, assigned to conformational changes occurring with Meta I formation, is not observed in human Meta I. In bovine Meta I the primary counterion of the Schiff base is known to switch from Glu-113, which serves as counterion in the dark state, to Glu-181 positioned in EL2 (55). This decisive reorganization of the Schiff base hydrogen-bond network leads to several conformational changes that unlock the photoreceptor irreversibly and facilitate its activation by thermal energy and proton uptake (56). This is achieved by a collective motion of EL2 and TM5, realized by a relatively rigid connection of both regions in bRho (57). The stability of this rigid connection is, however, strongly affected in the simulations of hRho. Our simulations further revealed an increased lateral mobility of EL2 in the dark state of hRho, which enables Glu-181 to move closer to the retinal Schiff base and thereby at least partially anticipates the counterion shift (Fig. 4). This notion is also corroborated by a TEC chimera between hRho and bRho (Fig. 6c). In this hRho based chimera, the “flexible” sequence 194LKP196 of hRho is replaced with the more rigid bovine sequence 194PHE196, thus restoring the putative tight coupling of EL2 movement to TM5 motion. In this mutant the band intensity at +1661 cm−1 is almost restored to the level found in the Meta I difference spectra of bRho.
Formation of the species with deprotonated Schiff base proceeds much faster in hRho as observed in the present time-resolved flash photolysis measurements and is in agreement with results of detergent-solubilized hRho (43) and in vivo experiments (58). This finding supports the view that some rate-limiting structural changes going along with Meta I in bRho already have formed in hRho. The SB chimera exhibits no influence on the Meta II formation kinetics. It is formed with a comparable rate as hRho (Fig. 8a, Table 1), although the absorption maximum of the bRho dark state is restored. More intriguing is the behavior of the TEC chimera. The exchange of EL2/TM5 connection influences not only both rate constants of Meta II formation but also restores the structure of bovine Meta I at least partially and shows a hypochromic shift of the dark state absorption maximum. The pKa of the Meta I ↔ Meta II equilibrium is a very sensitive monitor of the conformational equilibrium. The two pKa values are virtually identical, which means that both pigments share the same conformational equilibria of Meta II states and that the mechanisms for TM6 outward movement and proton uptake at Glu-134 are conserved. Finally, binding of the GtαCT peptide surrogate and catalytic activation of the transducin reflect that the functional properties of the activated receptor conformations are similar.
It is tempting to correlate our results with the existence of two different Meta I species that form on the ms and μs timescale, respectively, as it has been described for bRho (59). The two Meta I states are formed in parallel reaction pathways accessed in a temperature-dependent manner. However, because the Meta equilibria are not significantly shifted in hRho, we suggest that the dark state conformation is such that the mutations in the Schiff base and T5E2C region facilitate faster activation by allowing conformational changes characteristic for bovine Meta I (e.g. Schiff base counterion shift).
Conclusion
Despite their close evolutionary relationship, hRho and bRho display differences in their primary structure that we connect to specific impacts on structural elements during receptor function. On the one hand the electrostatic environment of the retinal Schiff base linkage is altered. On the other hand we have identified an increase of conformational flexibility in the linker region between extracellular loop 2 and transmembrane helix 5 of hRho, which is a feature of the active conformation and has been reported to increase the constitutive activity in other GPCRs. Flexibility in this region seems to be anticipated in hRho leading to a shifted absorption maximum in the dark state and faster formation of active Meta II. Although the structural properties of the inactive receptor seem to have adapted to the specific environment of the host species (e.g. diurnality or nocturnality), the active conformation itself is surprisingly similar. Apparently, the architecture of the receptor is such that host specific activation pathways evolve; however, the active conformation appears highly optimized for G protein catalysis and is thus conserved.
Our findings highlight that although bRho provides a valuable template for hRho, the differences between the inactive conformations have to be considered carefully, especially when the activation mechanism of disease-associated mutations of hRho are to be examined using the bovine template.
Author Contributions
F. J. B. coordinated the study and wrote the paper. R. K. prepared the samples, performed FTIR UV-visible and photolysis measurements, analyzed the spectroscopic data, wrote the paper, and prepared Figs. 1, 5, 6, 7, and 8. M. S. and P. S. prepared all expression vectors, Fig. 2, and wrote the paper. A. R. performed MD simulations, prepared Figs. 3, 4, and supplemental Fig. 1, and wrote the paper. P. W. H. supervised the theoretical part of this study and wrote the paper. M. E. analyzed and interpreted the spectroscopic data, provided data analysis tools, and wrote the paper. E. R. analyzed and interpreted the spectroscopic data and wrote the manuscript. R. P. performed Gt activation measurements. K. P. H. wrote the paper. R. K., E. R., M. S., and P. S. has the initial idea and initiated the project.
Supplementary Material
Acknowledgments
We thank Martha E. Sommer for critical reading of the manuscript, Anja Koch, Jana Engelmann, and Brian Bauer for technical assistance and Rho purification, and Martin Heck for fruitful discussions. The computer time necessary was provided by the “Norddeutscher Verbund für Hoch-und Höchstleistungsrechner” (HLRN) project bec00085.
This work was supported by grants from the Deutsche Forschungsgemeinschaft (DFG, SFB740; to K. P. H., P. S., and P. W. H.; SFB1078 to P. S. and F. J. B.; HI1502 and BI893/8 to P. W. H.), DFG Cluster of Excellence “Unifying Concepts in Catalysis” (Research Field D3/E3-1; to P. S.) and Research Fellowship (EL 779-1; to M. E.), the German Federal Ministry of Education and Research (BMBF Verbundforschung, Grant 05K13KH1), and the European Research Council (Advanced Investigator Grant (ERC-2009/249910-TUDOR; to K. P. H.)

This article contains supplemental Fig. 1.
- Rho
- rhodopsin
- hRho
- human Rho
- bRho
- bovine Rho
- GPCR
- G protein-coupled receptor
- TM
- transmembrane
- EL2
- extracellular loop 2
- Gt
- G protein transducin
- bis-tris-propane
- 1,3-bis[tris(hydroxymethyl)methylamino]propane
- GTPγS
- guanosine 5′-O-(thiotriphosphate)
- Batho
- bathorhodopsin
- Lumi
- lumirhodopsin
- TEC
- T5E2C region
- SB
- Schiff base.
References
- 1. Hofmann K. P., Scheerer P., Hildebrand P. W., Choe H.-W., Park J. H., Heck M., Ernst O. P. (2009) A G protein-coupled receptor at work: the rhodopsin model. Trends Biochem. Sci. 34, 540–552 [DOI] [PubMed] [Google Scholar]
- 2. Rakoczy E. P., Kiel C., McKeone R., Stricher F., Serrano L. (2011) Analysis of disease-linked rhodopsin mutations based on structure, function, and protein stability calculations. J. Mol. Biol. 405, 584–606 [DOI] [PubMed] [Google Scholar]
- 3. Nathans J., Hogness D. S. (1984) Isolation and nucleotide sequence of the gene encoding human rhodopsin. Proc. Natl. Acad. Sci. U.S.A. 81, 4851–4855 [DOI] [PMC free article] [PubMed] [Google Scholar]
- 4. Bartl F., Ritter E., Hofmann K. P. (2000) FTIR spectroscopy of complexes formed between metarhodopsin II and C- terminal peptides from the G-protein α- and γ-subunits. FEBS Lett. 473, 259–264 [DOI] [PubMed] [Google Scholar]
- 5. Nishimura S., Kandori H., Maeda A. (1998) Interaction between photoactivated rhodopsin and the C-terminal peptide of transducin α-subunit studied by FTIR spectroscopy. Biochemistry 37, 15816–15824 [DOI] [PubMed] [Google Scholar]
- 6. Szczepek M., Beyrière F., Hofmann K. P., Elgeti M., Kazmin R., Rose A., Bartl F. J., von Stetten D., Heck M., Sommer M. E., Hildebrand P. W., Scheerer P. (2014) Crystal structure of a common GPCR-binding interface for G protein and arrestin. Nat. Commun. 5, 4801. [DOI] [PMC free article] [PubMed] [Google Scholar]
- 7. Singhal A., Ostermaier M. K., Vishnivetskiy S. A., Panneels V., Homan K. T., Tesmer J. J., Veprintsev D., Deupi X., Gurevich V. V., Schertler G. F., Standfuss J. (2013) Insights into congenital stationary night blindness based on the structure of G90D rhodopsin. EMBO Rep. 14, 520–526 [DOI] [PMC free article] [PubMed] [Google Scholar]
- 8. Bosch L., Ramon E., Del Valle L. J., Garriga P. (2003) Structural and functional role of helices I and II in rhodopsin. A novel interplay evidenced by mutations at Gly-51 and Gly-89 in the transmembrane domain. J. Biol. Chem. 278, 20203–20209 [DOI] [PubMed] [Google Scholar]
- 9. Rao V. R., Cohen G. B., Oprian D. D. (1994) Rhodopsin mutation G90D and a molecular mechanism for congenital night blindness. Nature 367, 639–642 [DOI] [PubMed] [Google Scholar]
- 10. Molday R. S., MacKenzie D. (1983) Monoclonal antibodies to rhodopsin: characterization, cross-reactivity, and application as structural probes. Biochemistry 22, 653–660 [DOI] [PubMed] [Google Scholar]
- 11. Franke R. R., Sakmar T. P., Oprian D. D., Khorana H. G. (1988) A single amino acid substitution in rhodopsin (lysine 248 to leucine) prevents activation of transducin. J. Biol. Chem. 263, 2119–2122 [PubMed] [Google Scholar]
- 12. Elgeti M., Kazmin R., Heck M., Morizumi T., Ritter E., Scheerer P., Ernst O. P., Siebert F., Hofmann K. P., Bartl F. J. (2011) Conserved Tyr-223(5.58) plays different roles in the activation and G-protein interaction of rhodopsin. J. Am. Chem. Soc. 133, 7159–7165 [DOI] [PubMed] [Google Scholar]
- 13. Elgeti M., Ritter E., Bartl F. J. (2008) New Insights into Light-induced deactivation of active rhodopsin by SVD and global analysis of time-resolved UV/Vis- and FTIR data. Zeitschrift für Phys. Chemie 222, 1117–1129 [Google Scholar]
- 14. Heck M., Hofmann K. P. (2001) Maximal rate and nucleotide dependence of rhodopsin-catalyzed transducin activation: initial rate analysis based on a double displacement mechanism. J. Biol. Chem. 276, 10000–10009 [DOI] [PubMed] [Google Scholar]
- 15. Ernst O. P., Gramse V., Kolbe M., Hofmann K. P., Heck M. (2007) Monomeric G protein-coupled receptor rhodopsin in solution activates its G protein transducin at the diffusion limit. Proc. Natl. Acad. Sci. U.S.A. 104, 10859–10864 [DOI] [PMC free article] [PubMed] [Google Scholar]
- 16. Okada T., Sugihara M., Bondar A.-N., Elstner M., Entel P., Buss V. (2004) The retinal conformation and its environment in rhodopsin in light of a new 2.2 Å crystal structure. J. Mol. Biol. 342, 571–583 [DOI] [PubMed] [Google Scholar]
- 17. Choe H.-W., Kim Y. J., Park J. H., Morizumi T., Pai E. F., Krauss N., Hofmann K. P., Scheerer P., Ernst O. P. (2011) Crystal structure of metarhodopsin II. Nature 471, 651–655 [DOI] [PubMed] [Google Scholar]
- 18. Dunbrack R. L., Jr., Cohen F. E. (1997) Bayesian statistical analysis of protein side-chain rotamer preferences. Protein Sci. 6, 1661–1681 [DOI] [PMC free article] [PubMed] [Google Scholar]
- 19. Chen J., Makino C. L., Peachey N. S., Baylor D. A., Simon M. I. (1995) Mechanisms of rhodopsin inactivation in vivo as revealed by a COOH-terminal truncation mutant. Science 267, 374–377 [DOI] [PubMed] [Google Scholar]
- 20. Hess B., Kutzner C., Van Der Spoel D., Lindahl E. (2008) GROMACS 4: algorithms for highly efficient, load-balanced, and scalable molecular simulation. J. Chem. Theory Comput. 4, 435–447 [DOI] [PubMed] [Google Scholar]
- 21. Wolf M. G., Hoefling M., Aponte-Santamaría C., Grubmüller H., Groenhof G. (2010) G-membed: Efficient insertion of a membrane protein into an equilibrated lipid bilayer with minimal perturbation. J. Comput. Chem. 31, 2169–2174 [DOI] [PubMed] [Google Scholar]
- 22. Berger O., Edholm O., Jähnig F. (1997) Molecular dynamics simulations of a fluid bilayer of dipalmitoylphosphatidylcholine at full hydration, constant pressure, and constant temperature. Biophys. J. 72, 2002–2013 [DOI] [PMC free article] [PubMed] [Google Scholar]
- 23. Berendsen H. J. C., Grigera J. R., Straatsma T. P. (1987) The missing term in effective pair potentials. J. Phys. Chem. 91, 6269–6271 [Google Scholar]
- 24. Lindorff-Larsen K., Piana S., Palmo K., Maragakis P., Klepeis J. L., Dror R. O., Shaw D. E. (2010) Improved side-chain torsion potentials for the Amber ff99SB protein force field. Proteins 78, 1950–1958 [DOI] [PMC free article] [PubMed] [Google Scholar]
- 25. Kandt C., Schlitter J., Gerwert K. (2004) Dynamics of water molecules in the bacteriorhodopsin trimer in explicit lipid/water environment. Biophys. J. 86, 705–717 [DOI] [PMC free article] [PubMed] [Google Scholar]
- 26. Mertz B., Lu M., Brown M. F., Feller S. E. (2011) Steric and electronic influences on the torsional energy landscape of retinal. Biophys. J. 101, L17–L19 [DOI] [PMC free article] [PubMed] [Google Scholar]
- 27. Hess B., Bekker H., Berendsen H. J. C., Fraaije J. G. E. M. (1997) LINCS: A linear constraint solver for molecular simulations. J. Comput. Chem. 18, 1463–1472 [Google Scholar]
- 28. Miyamoto S., Kollman P. A. (1992) SETTLE: an analytical version of the SHAKE and RATTLE algorithm for rigid water models. J. Comput. Chem. 13, 952–962 [Google Scholar]
- 29. Bussi G., Donadio D., Parrinello M. (2007) Canonical sampling through velocity rescaling. J. Chem. Phys. 126, 014101 [DOI] [PubMed] [Google Scholar]
- 30. Darden T., York D., Pedersen L. (1993) Particle mesh Ewald: an N log(N) method for Ewald sums in large systems. J. Chem. Phys. 98, 10089 [Google Scholar]
- 31. Angel T. E., Gupta S., Jastrzebska B., Palczewski K., Chance M. R. (2009) Structural waters define a functional channel mediating activation of the GPCR, rhodopsin. Proc. Natl. Acad. Sci. U.S.A. 106, 14367–14372 [DOI] [PMC free article] [PubMed] [Google Scholar]
- 32. Ismer J., Rose A. S., Tiemann J. K., Goede A., Rother K., Hildebrand P. W. (2013) Voronoia4RNA: a database of atomic packing densities of RNA structures and their complexes. Nucleic Acids Res. 41, D280–D284 [DOI] [PMC free article] [PubMed] [Google Scholar]
- 33. Siebert F., Mäntele W., Gerwert K. (1983) Fourier-transform infrared spectroscopy applied to rhodopsin. The problem of the protonation state of the retinylidene Schiff base re-investigated. Eur. J. Biochem. 136, 119–127 [DOI] [PubMed] [Google Scholar]
- 34. Siebert F. (1995) Application of FTIR spectroscopy to the investigation of dark structures and photoreactions of visual pigments. Isr. J. Chem. 35, 309–323 [Google Scholar]
- 35. Ganter U. M., Gärtner W., Siebert F. (1988) Rhodopsin-lumirhodopsin phototransition of bovine rhodopsin investigated by Fourier transform infrared difference spectroscopy. Biochemistry 27, 7480–7488 [DOI] [PubMed] [Google Scholar]
- 36. Parkes J. H., Liebman P. A. (1984) Temperature and pH dependence of the metarhodopsin I-metarhodopsin II kinetics and equilibria in bovine rod disk membrane suspensions. Biochemistry 23, 5054–5061 [DOI] [PubMed] [Google Scholar]
- 37. Zaitseva E., Brown M. F., Vogel R. (2010) Sequential rearrangement of interhelical networks upon rhodopsin activation in membranes: the meta IIa conformational substate. J. Am. Chem. Soc. 132, 4815–4821 [DOI] [PMC free article] [PubMed] [Google Scholar]
- 38. Barth A. (2007) Infrared spectroscopy of proteins. Biochim. Biophys. Acta 1767, 1073–1101 [DOI] [PubMed] [Google Scholar]
- 39. Beck M., Siebert F., Sakmar T. P. (1998) Evidence for the specific interaction of a lipid molecule with rhodopsin which is altered in the transition to the active state metarhodopsin II. FEBS Lett. 436, 304–308 [DOI] [PubMed] [Google Scholar]
- 40. Knierim B., Hofmann K. P., Ernst O. P., Hubbell W. L. (2007) Sequence of late molecular events in the activation of rhodopsin. Proc. Natl. Acad. Sci. U.S.A. 104, 20290–20295 [DOI] [PMC free article] [PubMed] [Google Scholar]
- 41. Vogel R., Martell S., Mahalingam M., Engelhard M., Siebert F. (2007) Interaction of a G protein-coupled receptor with a G protein-derived peptide induces structural changes in both peptide and receptor: a Fourier-transform infrared study using isotopically labeled peptides. J. Mol. Biol. 366, 1580–1588 [DOI] [PubMed] [Google Scholar]
- 42. Thorgeirsson T. E., Lewis J. W., Wallace-Williams S. E., Kliger D. S. (1992) Photolysis of rhodopsin results in deprotonation of its retinal Schiff's base prior to formation of metarhodopsin II. Photochem. Photobiol. 56, 1135–1144 [DOI] [PubMed] [Google Scholar]
- 43. Lewis J. W., van Kuijk F. J., Thorgeirsson T. E., Kliger D. S. (1991) Photolysis intermediates of human rhodopsin. Biochemistry 30, 11372–11376 [DOI] [PubMed] [Google Scholar]
- 44. Hoersch D., Otto H., Wallat I., Heyn M. P. (2008) Monitoring the conformational changes of photoactivated rhodopsin from microseconds to seconds by transient fluorescence spectroscopy. Biochemistry 47, 11518–11527 [DOI] [PubMed] [Google Scholar]
- 45. Fritze O., Filipek S., Kuksa V., Palczewski K., Hofmann K. P., Ernst O. P. (2003) Role of the conserved NpxxY(x)5,6F motif in the rhodopsin ground state and during activation. Proc. Natl. Acad. Sci. U.S.A. 100, 2290–2295 [DOI] [PMC free article] [PubMed] [Google Scholar]
- 46. Chang B. S., Jönsson K., Kazmi M. A., Donoghue M. J., Sakmar T. P. (2002) Recreating a functional ancestral archosaur visual pigment. Mol. Biol. Evol. 19, 1483–1489 [DOI] [PubMed] [Google Scholar]
- 47. Sekharan S., Mooney V. L., Rivalta I., Kazmi M. A., Neitz M., Neitz J., Sakmar T. P., Yan E. C., Batista V. S. (2013) Spectral tuning of ultraviolet cone pigments: an interhelical lock mechanism. J. Am. Chem. Soc. 135, 19064–19067 [DOI] [PMC free article] [PubMed] [Google Scholar]
- 48. Sullivan J. M., Shukla P. (1999) Time-resolved rhodopsin activation currents in a unicellular expression system. Biophys. J. 77, 1333–13357 [DOI] [PMC free article] [PubMed] [Google Scholar]
- 49. Ahuja S., Smith S. O. (2009) Multiple switches in G protein-coupled receptor activation. Trends Pharmacol. Sci. 30, 494–502 [DOI] [PubMed] [Google Scholar]
- 50. Ye S., Zaitseva E., Caltabiano G., Schertler G. F., Sakmar T. P., Deupi X., Vogel R. (2010) Tracking G-protein-coupled receptor activation using genetically encoded infrared probes. Nature 464, 1386–1389 [DOI] [PubMed] [Google Scholar]
- 51. Wheatley M., Wootten D., Conner M. T., Simms J., Kendrick R., Logan R. T., Poyner D. R., Barwell J. (2012) Lifting the lid on GPCRs: the role of extracellular loops. Br. J. Pharmacol. 165, 1688–1703 [DOI] [PMC free article] [PubMed] [Google Scholar]
- 52. Wifling D., Bernhardt G., Dove S., Buschauer A. (2015) The extracellular loop 2 (ECL2) of the human histamine H4 receptor substantially contributes to ligand binding and constitutive activity. PLoS ONE 10, e0117185. [DOI] [PMC free article] [PubMed] [Google Scholar]
- 53. Nakamichi H., Okada T. (2006) Crystallographic analysis of primary visual photochemistry. Angew. Chem. Int. Ed. Engl. 45, 4270–4273 [DOI] [PubMed] [Google Scholar]
- 54. Nakamichi H., Okada T. (2006) Local peptide movement in the photoreaction intermediate of rhodopsin. Proc. Natl. Acad. Sci. U.S.A. 103, 12729–12734 [DOI] [PMC free article] [PubMed] [Google Scholar]
- 55. Sandberg M. N., Greco J. A., Wagner N. L., Amora T. L., Ramos L. A., Chen M. H., Knox B. E., Birge R. R. (2014) Low temperature trapping of photointermediates of the rhodopsin E181Q mutant. SOJ Biochem. 1, 12. [DOI] [PMC free article] [PubMed] [Google Scholar]
- 56. Mahalingam M., Martínez-Mayorga K., Brown M. F., Vogel R. (2008) Two protonation switches control rhodopsin activation in membranes. Proc. Natl. Acad. Sci. U.S.A. 105, 17795–17800 [DOI] [PMC free article] [PubMed] [Google Scholar]
- 57. Ye S., Huber T., Vogel R., Sakmar T. P. (2009) FTIR analysis of GPCR activation using azido probes. Nat. Chem. Biol. 5, 397–399 [DOI] [PMC free article] [PubMed] [Google Scholar]
- 58. Pugh E. N. (1975) Rhodopsin flash photolysis in man. J. Physiol. 248, 393–412 [DOI] [PMC free article] [PubMed] [Google Scholar]
- 59. Thorgeirsson T. E., Lewis J. W., Wallace-Williams S. E., Kliger D. S. (1993) Effects of temperature on rhodopsin photointermediates from lumirhodopsin to metarhodopsin-II. Biochemistry 32, 13861–13872 [DOI] [PubMed] [Google Scholar]
Associated Data
This section collects any data citations, data availability statements, or supplementary materials included in this article.