Background: Little is known about the distribution of cardiac ryanodine receptor (RyR2) and its functional correlation in living cells.
Results: Imaging live GFP-tagged RyR2 cardiomyocytes revealed Ca2+ sparks originated exclusively from RyR2 clusters distributed along z-lines and transverse tubules.
Conclusion: The distribution of RyR2 clusters determines the spatial profile of Ca2+ release.
Significance: RyR2 cluster distribution is an important determinant of Ca2+ release in the heart.
Keywords: calcium imaging, calcium intracellular release, excitation-contraction coupling (E-C coupling), ryanodine receptor, sarcoplasmic reticulum (SR)
Abstract
The cardiac Ca2+ release channel (ryanodine receptor, RyR2) plays an essential role in excitation-contraction coupling in cardiac muscle cells. Effective and stable excitation-contraction coupling critically depends not only on the expression of RyR2, but also on its distribution. Despite its importance, little is known about the distribution and organization of RyR2 in living cells. To study the distribution of RyR2 in living cardiomyocytes, we generated a knock-in mouse model expressing a GFP-tagged RyR2 (GFP-RyR2). Confocal imaging of live ventricular myocytes isolated from the GFP-RyR2 mouse heart revealed clusters of GFP-RyR2 organized in rows with a striated pattern. Similar organization of GFP-RyR2 clusters was observed in fixed ventricular myocytes. Immunofluorescence staining with the anti-α-actinin antibody (a z-line marker) showed that nearly all GFP-RyR2 clusters were localized in the z-line zone. There were small regions with dislocated GFP-RyR2 clusters. Interestingly, these same regions also displayed dislocated z-lines. Staining with di-8-ANEPPS revealed that nearly all GFP-RyR2 clusters were co-localized with transverse but not longitudinal tubules, whereas staining with MitoTracker Red showed that GFP-RyR2 clusters were not co-localized with mitochondria in live ventricular myocytes. We also found GFP-RyR2 clusters interspersed between z-lines only at the periphery of live ventricular myocytes. Simultaneous detection of GFP-RyR2 clusters and Ca2+ sparks showed that Ca2+ sparks originated exclusively from RyR2 clusters. Ca2+ sparks from RyR2 clusters induced no detectable changes in mitochondrial Ca2+ level. These results reveal, for the first time, the distribution of RyR2 clusters and its functional correlation in living ventricular myocytes.
Introduction
Excitation-contraction coupling in cardiac muscle cells occurs via a mechanism known as Ca2+-induced Ca2+ release (1, 2). In this process, depolarization of the transverse tubular membrane activates the voltage-dependent L-type Ca2+ channel, resulting in a small influx of Ca2+ into the cytosol. This Ca2+ entry then triggers a large Ca2+ release from the sarcoplasmic reticulum (SR)2 by opening the cardiac ryanodine receptor (RyR2) channel located in the SR membrane and, subsequently, muscle contraction (1, 2). Hence, RyR2 acts as a Ca2+ amplifier during Ca2+-induced Ca2+ release. A potential problem with this Ca2+ amplification process is that Ca2+ efflux from the SR could further activate RyR2 and Ca2+ release. Such positive feedback would lead to regenerative Ca2+ release. However, Ca2+ release from the SR in normal heart cells is graded and tightly controlled (3–9). How heart cells are able to achieve graded and stable amplification of Ca2+ influx via the positive feedback process of Ca2+-induced Ca2+ release is not completely understood.
The distribution of RyR2 in cardiomyocytes is believed to play a critical role in achieving the gradation and stability of Ca2+-induced Ca2+ release. RyR2 proteins are organized in the form of clusters in cardiomyocytes. These RyR2 clusters represent the elementary Ca2+ release units (5–7, 10–14). Activation of these elementary Ca2+ release units (RyR2 clusters) produces elementary Ca2+ release events, known as Ca2+ sparks (3, 11, 15–17). The spatiotemporal summation of these Ca2+ sparks is thought to underlie the global Ca2+ transients (15). The gradation of SR Ca2+ release in response to Ca2+ influx could then be achieved by recruiting various numbers of Ca2+ release units (3, 11, 16–18).
The distribution and organization of RyR2s in cardiomyocytes have been extensively investigated (19–23). It has been shown that RyR2 clusters are associated with transverse tubular membranes located along z-lines (14, 19, 24, 25). Interestingly, a significant portion of RyR2 clusters (∼20%) was found to be located between z-lines (26). These RyR2 clusters located in the middle of the sarcomere are thought to play an important role in the propagation of Ca2+ transients (27). However, other studies showed that nearly all RyR2 clusters are co-localized with α-actinin (28, 29), a marker of the z-line. The reason for this discrepancy is unclear. It is important to note that nearly all studies on RyR2 distribution in cardiomyocytes were carried out in fixed and/or permeabilized cells or tissues using immunostaining with anti-RyR2 antibodies. It is unclear whether cell or tissue fixation and/or permeabilization would alter the distribution and organization of RyR2. It is also uncertain whether the anti-RyR2 antibodies used recognize RyR2 unrelated epitopes. These concerns warrant the need to study the distribution of RyR2 directly in a more physiological setting.
Information on the distribution of functional groups of RyR2s is also lacking. It is unclear whether the distribution of functional groups of RyR2s correlates with that of RyR2 clusters detected in fixed, permeabilized cardiac cells. Using mitochondria as markers, Lukyanenko et al. (26) showed that most of the Ca2+ sparks (functional groups of RyR2s) were detected in regions between mitochondria, where z-lines are thought to be located. However, a significant portion of Ca2+ sparks was also detected in regions near the middle of mitochondria. These indirect studies suggest that functional groups of RyR2s may exist between z-lines in the middle of sarcomere. However, a direct correlation between Ca2+ sparks and RyR2 clusters has yet to be demonstrated.
To circumvent these potential problems with respect to antibody specificities or sample handling, we generated a knock-in mouse model expressing a GFP-tagged RyR2. Using confocal fluorescence imaging, we directly determined the distribution of RyR2 clusters in live cardiomyocytes isolated from the GFP-RyR2 mice. We found that nearly all GFP-RyR2 clusters were localized to the z-line zone and associated with transverse, but not longitudinal, tubules. On the other hand, GFP-RyR2 clusters were not co-localized with mitochondria, although they are in close proximity. Co-detection of GFP-RyR2 clusters and Ca2+ sparks revealed that Ca2+ sparks originate exclusively from RyR2 clusters. These studies shed novel insights into the distribution of RyR2 clusters and its functional correlation in living cardiomyocytes.
Experimental Procedures
Generation of a Knock-in Mouse Model Expressing a GFP-tagged RyR2
A genomic DNA phage clone containing part of the mouse cardiac ryanodine receptor gene was isolated from the lambda mouse 129-SV/J genomic DNA library (Stratagene) and used to construct the RyR2 GFP knock-in targeting vector. This genomic DNA fragment (∼15 kb) was released from the lambda vector by NotI and subcloned into pBluescript to form the RyR2 genomic DNA plasmid. PCR-based site-directed mutagenesis was performed to generate a 660-bp DNA fragment containing the AscI site inserted after residue Thr-1366 using the RyR2 genomic DNA plasmid as a template. The GFP flanked by glycine-rich linkers was inserted into this fragment via the AscI site. A 5.7-kb NotI-BamHI fragment was then subcloned into the targeting vector that contains a neomycin selection cassette flanked by FRT sites using NotI and BamHI to form the 5′ arm. A 5.4-kb SalI-XhoI fragment was inserted into the targeting vector to form the 3′ arm. All PCR fragments used for constructing the targeting vector were confirmed by DNA sequencing. The targeting vector was linearized with NotI and subsequently electroporated into R1 embryonic stem (ES) cells. G418-resistant ES clones were screened for homologous recombination by Southern blotting using an external probe. Briefly, genomic DNA was extracted from G418-resistant ES cell clones. ES cell DNA was digested using NcoI, separated on a 0.8% (w/v) agarose gel, and subsequently blotted onto a nitrocellulose membrane. A DNA probe (∼700 bp) was generated by PCR from mouse genomic DNA using the specific primers 5′-GAGGAAGTACAGATCAGTTCTTA-3′ (forward) and 5′-AGCCTAGAGA CTTTCCCTTTCAC-3′ (reverse). The PCR product was subsequently radiolabeled using [32P]dCTP by random priming (Invitrogen). DNA blots were hybridized with the radiolabeled probe and visualized by autoradiography. Eight positive homologous recombinants were detected of 780 ES cell clones, two of which were microinjected into blastocysts from C57BL/6J mice to generate male chimeras. Male chimeras were bred with female 129sve mice to generate germ line-transmitted heterozygous GFP-RyR2-neo knock-in mice. GFP-RyR2-neo male mice were bred with female mice that express Flp recombinase to remove the selectable marker (the neomycin-resistant gene, neo). The genotypes from F1 generation without neo were determined by PCR using DNA from tail biopsy specimens using the DNeasy tissue kit from Qiagen and the DNA primers PRIMER1 (5′-ATATCACTCCTAGACATACCCTCA-3′, forward), PRIMER2 (5′-CTTCAGCTCGATGCGGTTCAC-3′, forward) and PRIMER3 (5′-AGACCAGACAAGCCATCACACTA-3′, reverse).
Isolation and Fixation of Ventricular Myocytes
Ventricular myocytes were isolated using retrograde aortic perfusion as described previously (30). Isolated cells were kept at room temperature in Krebs-Ringers-HEPES (KRH) buffer (125 mm NaCl, 12.5 mm KCl, 25 mm HEPES, 6 mm glucose, and 1.2 mm MgCl2, pH 7.4) containing 20 mm taurine, 20 mm 2,3-butanedione monoxime, 5 mg/ml albumin, and 0.5–1 mm free Ca2+ until use. A portion of the isolated cells from the same mouse heart was fixed by 4% (w/v) paraformaldehyde in Ca2+ free KRH solution for 10 min at room temperature. Excess paraformaldehyde was removed by washing with KRH containing glycine (0.5 m). The fixed cells were kept in KRH buffer and stored at 4 °C until use.
Staining of Live Cardiomyocytes
Live ventricular myocytes were stained with 3 μm di-8-ANEPPS (Invitrogen) or 2 μm MitoTracker Red-FM (Invitrogen) in KRH buffer containing 0.5–1 mm Ca2+ for 5–20 min at room temperature. The stained cells were washed three times for 5 min each with KRH solution containing 0.5–1 mm Ca2+ and kept at room temperature until use.
Cell Permeabilization
Fixed ventricular myocytes were permeabilized with 1% (v/v) Triton (EMD Millipore) in KRH solution for 1 h. The permeabilized cells were washed three times and blocked with BlockAid blocking solution (Molecular Probes) overnight at 4 °C. Myocytes were washed again and incubated with primary monoclonal anti-α-actinin antibody (A7811; Sigma) diluted to 250 ng/ml in blocking solution for 1 h at room temperature. Cells were then washed three times for 10 min each in blocking solution before incubated with a secondary antibody (4 ng/ml), Alexa Fluor 633-conjugated anti-mouse goat IgG (H+L) (Molecular Probes), for 45 min at room temperature. After further washes with KRH buffer three times for 10 min each, cells were kept in Ca2+ free KRH at 4 °C until imaging.
Single Cell Imaging of GFP-RyR2 Clusters, Mitochondria, Transverse/Longitudinal Tubules, and α-Actinin in Isolated Ventricular Myocytes
All imaging of live isolated ventricular myocytes was performed within 4–6 h after cell isolation. Isolated myocytes were placed onto laminin-coated micro glass coverslips (VWR, no. 1). After 5–10 min, unattached myocytes were gently removed via KRH buffer exchange (0.5–1 mm Ca2+). Cells were then staged onto the microscope for confocal imaging. Cell integrity was tested by pacing at 2–3 Hz. Only cardiomyocytes that followed electrical pacing were selected for subsequent live cell imaging. Fixed and permeabilized cardiomyocytes were transferred onto noncoated micro glass coverslips (VWR, no. 1) and allowed to settle to the coverslip for at least 10 min before imaging. Images were acquired with an inverted Nikon A1R scanning confocal microscope system equipped with a Nikon 60×/numerical aperture 1.2 Plan-Apochromat water immersion objective and selective excitation and emission filters. Excitation light was provided by argon (488 nm; Coherent Sapphire), yellow diode (561 nm; Coherent Sapphire), and red diode (635 nm; Coherent Sapphire) lasers to detect GFP (maximum excitation of 488 nm and maximum emission of 510 nm), di-8-ANEPPS (maximum excitation of 488 nm and maximum emission of 630 nm), MitoTracker Red-FM (maximum excitation of 581 nm and maximum emission of 644 nm), and Alexa Fluor 633-conjugated secondary antibody (maximum excitation of 630 nm and maximum emission of 650 nm). Basic image processing and spectral fluorescence unmixing for co-detection and analysis of GFP and di-8-ANEPPS fluorescence signals were performed using the NIS Elements AR 4.13 software (Nikon).
Line Scanning Confocal Imaging of Individual Ca2+ Sparks in GFP-RyR2 Ventricular Myocytes
Ventricular myocytes isolated from GFP-RyR2 mice were loaded with Rhod-2 AM (5 μm; Invitrogen) for 20 min at room temperature. The cells were then washed with KRH buffer three times and transferred onto laminin-coated cover glasses (VWR, no. 1). After mounted onto the detection stage, they were superfused with KRH solution containing 1.8–2 mm free Ca2+ at 35–37 °C. Confocal line scan Ca2+ imaging was performed to record individual Ca2+ release events using the Nikon A1R confocal microscope system equipped with a Nikon 60×/numerical aperture 1.2 Plan-Apochromat water immersion objective. Images of Ca2+ release events were acquired at a sampling rate of 1.8–1.9 ms/line along the longitudinal axis of the myocytes in the line scan mode.
Monitoring Mitochondrial and Cytosolic Ca2+ in Ventricular Myocytes Isolated from GFP-RyR2 Knock-in Mice
Ventricular myocytes were loaded with Rhod-2 AM (2.5–5.0 μm) at 4 °C for 75 min to facilitate loading of Rhod-2 AM to mitochondria as previously described (31–33). Cytosolic Rhod-2 dye was removed through incubation at 37 °C for 3–4 h until a clear mitochondrial pattern of Rhod-2 labeling was observed. The cells were then superfused with KRH buffer containing 3 mm extracellular Ca2+ and paced at 3 Hz for 30–60 s. The fluorescence signals of GFP and Rhod-2 were co-detected using confocal fluorescence microscopy. For monitoring cytosolic Ca2+ level, the Rhod-2-loaded cells were incubated with Fluo-4 AM (2.5–5 μm) in KRH buffer containing 0.5 mm Ca2+ for 25 min at room temperature. The Fluo-4/Rhod-2-loaded cells were then washed and superfused with KRH containing 3 mm extracellular Ca2+ and paced again at 3 Hz for 30–60 s. The fluorescence signals of Fluo-4, GFP, and Rhod-2 were co-detected using confocal fluorescence microscopy.
Computational Image Analysis
All image processing and detection methods were implemented using MATLAB (The Mathworks Inc., Boston, MA).
RyR2 Segmentation
GFP-RyR2 x-y images were processed as follows. First, a histogram-based normalization procedure was applied to the images to adjust the range to the background fluorescence level. The normalization ensured that the resulting images were not affected by outlier pixels in the image. Noise filtering and GFP-RyR2 enhancement was performed by applying a two-dimensional convolution using a Gaussian template with a σ value of ∼1 μm (twice the diameter of the microscope's point spread function). The resulting convolved image was rescaled to the interval [0.1], and all regions above 0.5 were marked as candidates for GFP-RyR2. Regions smaller than 0.1 μm2 were discarded, and regions containing more than one local maxima (because of noise) were smoothed by means of a median filter until left with a single central maxima. Spatial resolution ranged from 0.03 to 0.1 μm.
Cluster Size Measurement
For each detected GFP-RyR2 cluster, cluster size was defined as the distance at which the intensity decays to 80% of its maximum, measured by Gaussian fits to eight cross-sections of the cluster taken in angular increments of 45°.
Automated Spark Detection and Localization
Line scan images were normalized using a time-dependent basal fluorescence level to correct for temporal drifts in the basal fluorescence. Sparks were detected from the normalized images by using a custom watershed segmentation method with a size-dependent stopping rule. Background noise was estimated to filter sparks using amplitude thresholding. Sparks producing a goodness of fit in the exponential decay fit R̂2 < 0.85 were excluded from the analysis. All detected sparks were validated manually. The distance from the spark initiation focus to the nearest RyR2 cluster was measured.
Statistical Analysis
All values shown are means ± S.E. unless indicated otherwise. To test for differences between groups, we used unpaired Student's t tests (two-tailed). A p value of <0.05 was considered to be statistically significant.
Results
Generation of a Knock-in Mouse Model Expressing a GFP-tagged RyR2
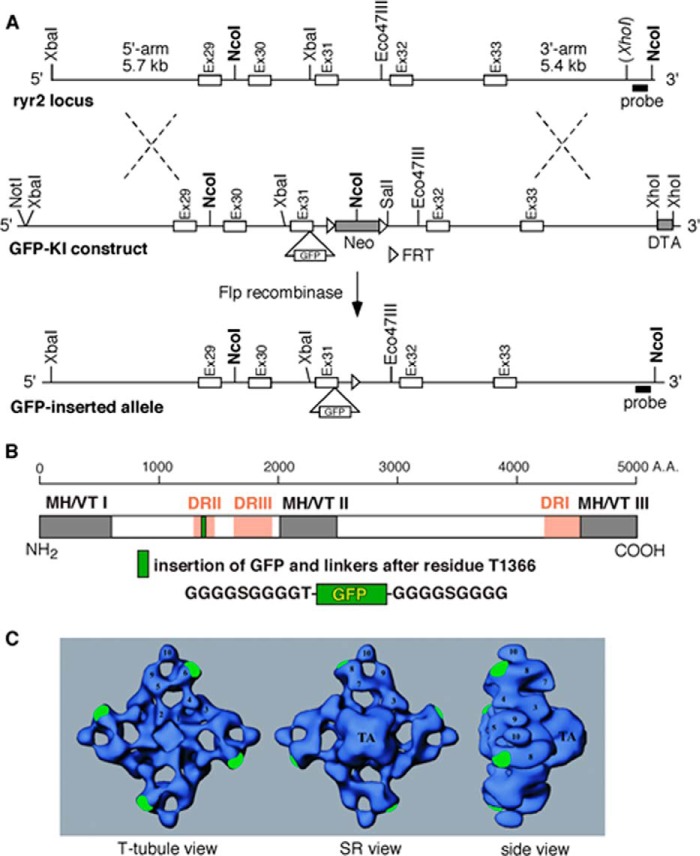
To study the distribution of RyR2 clusters and the correlation of their distribution to function in living cells, we generated a knock-in mouse model expressing a GFP-tagged RyR2 (Fig. 1A). The GFP was inserted into RyR2 after residue Thr-1366 (Fig. 1B). To minimize potential steric hindrance, the GFP sequence was flanked by 10-residue Gly-rich linkers on both sides of the GFP (Fig. 1B). The three-dimensional location of the inserted GFP was mapped previously to subdomain 6 in the “clamp” region of the three-dimensional structure of RyR2 (Fig. 1C) (34). The GFP-tagged RyR2 formed caffeine- and ryanodine-sensitive functional Ca2+ release channel (34), indicating that the insertion of GFP did not grossly alter the structure and function of the RyR2 channel. We also did not observe gross defects in the GFP-tagged RyR2 mice.
FIGURE 1.
Generation of GFP-tagged RyR2 knock-in mice. A, in-frame insertion of GFP into exon 31 of RyR2 was achieved via homologous recombination as illustrated. B, a linear structure of RyR2 showing disease hot spot regions (gray boxes; MH/VT I–III) harboring mutations associated with malignant hypothermia (MH) or ventricular tachyarrhythmias (VT). Divergent regions in RyR (pink boxes; DR I-III) are also indicated. GFP flanked by glycine-rich linkers was inserted into RyR2 after residue Thr-1366. C, localization of the inserted GFP to the “clamp region” in the cytosolic assembly of the three-dimensional structure of RyR, viewing from the T-tubule (left), SR (center), and the side of the channel (right).
Distribution of RyR2 Clusters in Live and Fixed Ventricular Myocytes
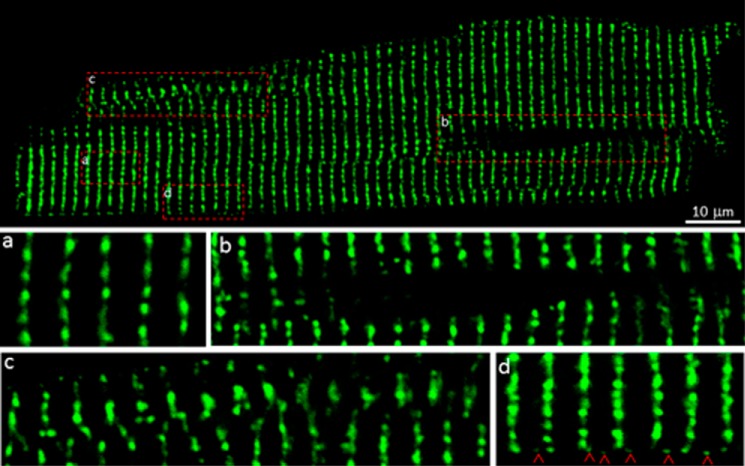
To determine the distribution of RyR2 in living cells, we isolated ventricular myocytes from GFP-RyR2 mouse hearts in the presence of low concentrations of Ca2+ (0.5–1.5 mm) to minimize spontaneous contraction. The GFP fluorescence signal was then detected using a confocal microscope in a line scan mode. As shown in Fig. 2, GFP-RyR2s were clearly detected as highly organized discrete clusters in the interior and at the periphery of the cell (Fig. 2). A majority of these clusters were distributed in highly ordered transverse rows with an average spacing of 1.88 μm (Fig. 2a and Table 1). Some of the GFP-RyR2 clusters were dislocated, particularly within or near the perinuclear region (Fig. 2b) or in other regions of the cell (Fig. 2c). These observations are consistent with those reported previously (19–23). We also detected intercalated GFP-RyR2 clusters at the periphery of isolated live ventricular myocytes (Fig. 2d), similar to those described previously in fixed cardiac cells (22, 23).
FIGURE 2.
Distribution of GFP-RyR2 clusters in live ventricular myocytes. A representative confocal fluorescence image of a live ventricular myocyte (n = 109) isolated from GFP-RyR2 knock-in mice (top panel) shows the distribution of GFP-RyR2 clusters. Panels a–d show organization details in different regions: the cell interior (panel a), the perinuclear region (panel b), regions with disordered cluster distributions (panel c), and the subsarcolemmal region (panel d). Red arrowheads indicate intercalated GFP-RyR2 clusters at the periphery of the cell.
TABLE 1.
GFP-RyR2 cluster distribution in live and fixed ventricular myocytes
The properties of GFP-RyR2 cluster distribution were determined from confocal fluorescence images of live and fixed ventricular cardiomyocytes isolated from the same GFP-tagged RyR2 knock-in mice. The data shown are means ± S.E.
| Longitudinal distance between GFP-RyR2 cluster rows | Mean nearest neighbor | Mean cluster radius | Cluster density | No. of cells | |
|---|---|---|---|---|---|
| μm | μm | μm | No. per μm2 | ||
| Live cells | 1.880 ± 0.172 | 0.759 ± 0.029 | 0.383 ± 0.049 | 0.294 ± 0.054 | 10 |
| Fixed cells | 1.855 ± 0.096 | 0.771 ± 0.023 | 0.394 ± 0.052 | 0.314 ± 0.063 | 11 |
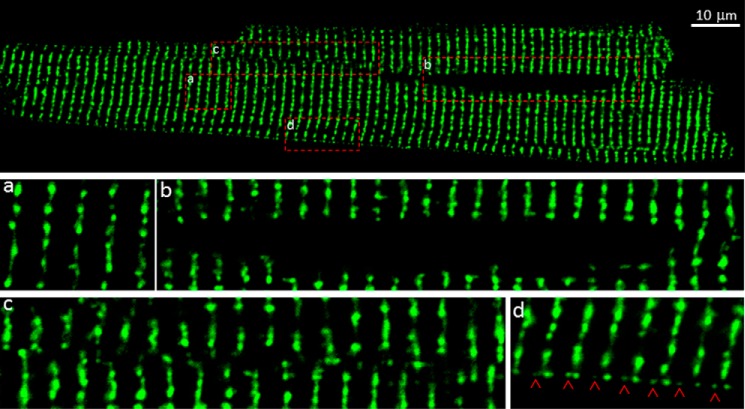
To ascertain whether the fixation procedure commonly used in immunostaining studies of RyR2 distribution in cardiac cells would alter the distribution of RyR2 clusters, we repeated the confocal imaging studies on isolated, fixed ventricular myocytes from the GFP-RyR2 mouse heart (Fig. 3). The overall distribution, distance between rows of GFP-RyR2 clusters, the nearest distance, and the GFP-RyR2 cluster size in live and fixed ventricular myocytes were found to be similar (Table 1). Thus, fixation does not significantly alter the distribution of RyR2 clusters in ventricular myocytes. It should be noted that no green clusters were detected in wild type ventricular myocytes (not shown).
FIGURE 3.
Distribution of GFP-RyR2 clusters in fixed ventricular myocytes. A representative confocal fluorescence image of a fixed ventricular myocyte (n = 84) isolated from GFP-RyR2 mice (top panel) shows the distribution of GFP-RyR2 clusters. Panels a–d show GFP-RyR2 cluster distribution in the cell interior (panel a), the perinuclear region (panel b), regions with disordered clusters (panel c), and the subsarcolemmal region (panel d). Red arrowheads indicate intercalated GFP-RyR2 clusters at the periphery of the cell.
Localization of RyR2 Clusters in the z-line Zone in Ventricular Myocytes
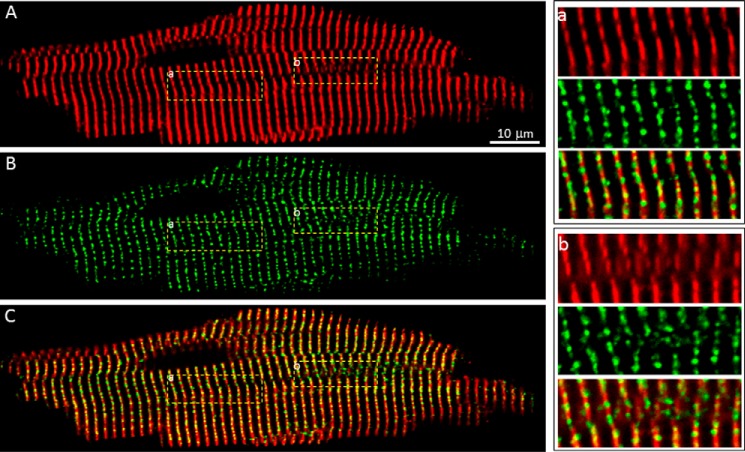
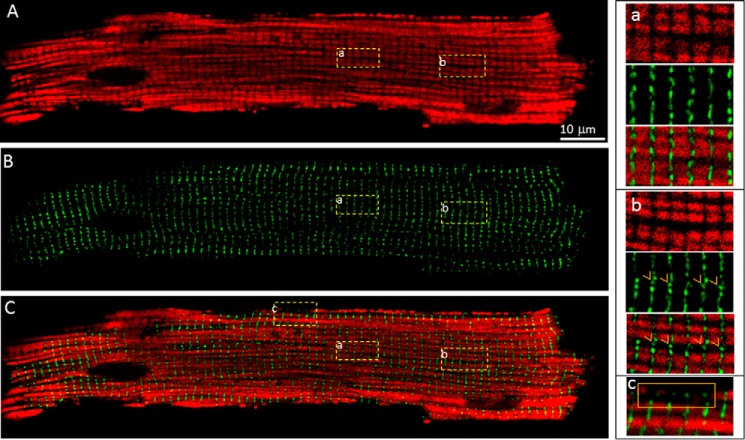
It has been proposed that a significant portion (∼20%) of RyR2 clusters is associated with the network SR and that these network SR-associated RyR2 clusters are located between z-lines (26). To directly determine the distribution of RyR2 clusters in relation to the z-line, we marked the z-line zone in fixed ventricular myocytes isolated from the GFP-RyR2 mouse heart by using an anti-α-actinin antibody, a commonly used marker for z-lines. Staining with the anti-α-actinin antibody revealed the z-line zone in a typical striated pattern (Fig. 4, A and a). Interestingly, regions with dislocated or coiled z-lines were frequently detected (Fig. 4, A and b), similar to those reported previously (28, 29). The distribution of GFP-RyR2 clusters in the same cell is shown in Fig. 4B. The merged image of α-actinin staining and GFP-RyR2 signals is shown in Fig. 4C. Remarkably, nearly all GFP-RyR2 clusters are localized within the z-line bands of α-actinin staining (Fig. 4, C and a), even in regions with dislocated or coiled z-lines (Fig. 4, C and b). There are only a few GFP-RyR2 clusters (∼0.6%) that were detected between z-lines. Therefore, these observations suggest that RyR2 clusters nearly strictly follow the z-lines.
FIGURE 4.
Co-localization of GFP-RyR2 clusters with the z-Line zone. A, a representative confocal fluorescence image of a fixed, permeabilized GFP-RyR2 ventricular myocyte (n = 39) stained with anti-α-actinin antibody. B, GFP-RyR2 cluster fluorescence signals of the same cell. C, merged image of the α-actinin and GFP-RyR2 signals. The panels at the right show ordered (panel a) and disordered (panel b) co-distributions of α-actinin and GFP-RyR2 clusters.
Co-localization of RyR2 Clusters with the Tubular System in Ventricular Myocytes
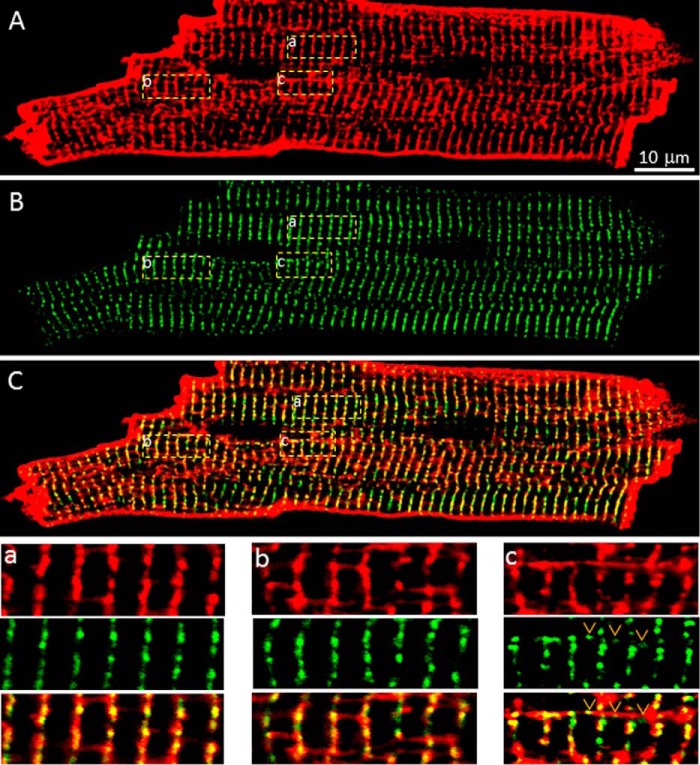
Previous immunostaining studies showed that RyR2 clusters were co-localized with both transverse and longitudinal tubules in fixed cardiomyocytes (25, 26, 35). To determine whether GFP-RyR2 clusters are co-localized with transverse and/or longitudinal tubules in living cells, we labeled the tubular-system in ventricular myocytes isolated from the GFP-RyR2 mouse heart with the di-8-ANEPPS dye. We then simultaneously detected the GFP and di-8-ANEPPS signals using confocal spectral imaging. As shown in Fig. 5A, the di-8-ANEPPS dye labeled the sarcolemma, and the transverse (Fig. 5A, panel a) and longitudinal tubules (Fig. 5A, boxes b and c), similar to those reported previously (25, 29, 35, 36). Fig. 5B shows the distribution of GFP-RyR2 clusters. Merging the GFP signals with those of di-8-ANEPPS revealed that nearly all the GFP-RyR2 clusters were co-localized with the transverse tubules (Fig. 5C, boxes a and b). Only few GFP-RyR2 clusters (<0.1%) were associated with the longitudinal tubules in a given confocal image of an entire cell (Fig. 5C, box c), similar to that described previously (29, 35). Therefore, RyR2 clusters are primarily co-localized with transverse, but not longitudinal tubules.
FIGURE 5.
Relative distribution of GFP-RyR2 clusters and the tubular system. A, the tubular membrane system in live GFP-RyR2 ventricular myocytes (n = 27) was labeled with di-8-ANEPPS and visualized with confocal fluorescence imaging. B, GFP-RyR2 cluster fluorescence signals of the same cell. C, merged image of the di-8-ANEPPS and GFP-RyR2 signals. The panels at the bottom show co-localization of GFP-RyR2 clusters with transverse tubules (panel a), no co-localization of GFP-RyR2 clusters with longitudinal tubules (panel b), and co-localization of a few GFP-RyR2 clusters with longitudinal tubules located near the perinuclear region (panel c).
Relative Distribution of RyR2 Clusters and Mitochondria in Ventricular Myocytes
It has been suggested that there is a tight Ca2+ transmission between mitochondria and SR via RyR2s (37). It is of interest then to examine the relative distribution of RyR2 clusters and mitochondria. To this end, we labeled the mitochondria using the MitoTracker Red dye in isolated ventricular myocytes from the GFP-RyR2 mutant heart. The GFP and MitoTracker Red signals were then simultaneously detected using confocal line scan imaging. The distribution of mitochondria and GFP-RyR2 clusters is shown in Fig. 6 (A and B, respectively). Interestingly, GFP-RyR2 clusters were located in regions between mitochondria (Fig. 6C, box a). Some GFP clusters were located in regions without mitochondria (Fig. 6C, boxes b and c). These results suggest that RyR2 clusters are not co-localized with mitochondria, although they are in close proximity with each other.
FIGURE 6.
Relative distribution of GFP-RyR2 clusters and mitochondria. A, mitochondria in live GFP-RyR2 ventricular myocytes (n = 24) were labeled with MitoTracker Red-FM and visualized with confocal fluorescence imaging. B, GFP-RyR2 cluster fluorescence signals of the same cell. C, merged image of the MitoTracker Red-FM and GFP-RyR2 signals. The panels at the bottom show GFP-RyR2 clusters located between mitochondria (panel a) or in areas that are devoid of mitochondria in the interior (panel b) or at the periphery (panel c) of the cell.
Co-localization of GFP-RyR2 Clusters and Ca2+ Sparks in Ventricular Myocytes
Previous studies showed that Ca2+ sparks primarily occurred along z-lines where RyR2 clusters were thought to be located (24, 38), suggesting that Ca2+ sparks originate from RyR2 clusters. To directly correlate the occurrence of Ca2+ sparks and the location of RyR2 clusters, we simultaneously recorded GFP and Ca2+ spark signals in ventricular myocytes isolated from GFP-RyR2 mouse hearts using confocal line scan imaging. As shown in Fig. 7, GFP-RyR2 clusters were depicted as green bands in the line scan images (middle green panel). Spontaneous Ca2+ sparks were clearly detected as brief, localized small Ca2+ transients (top panel). Close examination of the line scan image showed that all Ca2+ sparks were initiated within the green bands (bottom panel).
FIGURE 7.

Co-localization of Ca2+ sparks and GFP-RyR2 clusters in live ventricular myocytes. Ventricular myocytes (n = 101) isolated from GFP-RyR2 mice were loaded with the fluorescent Ca2+ dye Rhod-2/AM. The Rhod-2 fluorescence signals (top panel) and the GFP-RyR2 cluster fluorescence signals (middle panel) were simultaneously recorded using confocal line scanning. The merged image of Ca2+ sparks and GFP-RyR2 clusters is shown (bottom panel).
To quantify the distribution of Ca2+ sparks (n = 447) in relation to GFP-RyR2 clusters, we measured the distance from spark initiation sites to the center of the nearest GFP-RyR2 cluster (Fig. 8, A and B). We found that 99.6% of Ca2+ sparks were initiated within the mean GFP-RyR2 cluster size. Only 0.4% of Ca2+ sparks (2 of 447) were initiated outside the mean GFP-RyR2 cluster size (Fig. 8C). One off center Ca2+ spark was located very close to the boundary of the GFP-RyR2 cluster (Fig. 8D, panel a). The other off center Ca2+ spark was detected in a region with an irregular distribution of GFP-RyR2 clusters (Fig. 8D, panel b). Hence, it is possible that this single off center Ca2+ spark may come from an out of focus, misregistered GFP-RyR2 cluster. Therefore, simultaneous detection of GFP-RyR2 clusters and Ca2+ sparks reveals that Ca2+ sparks exclusively originate from the RyR2 clusters. Because nearly all GFP-RyR2 clusters are localized along z-lines (Fig. 4), the lack of Ca2+ sparks between GFP-RyR2 clusters indicates that Ca2+ sparks are unlikely to occur between z-lines.
FIGURE 8.
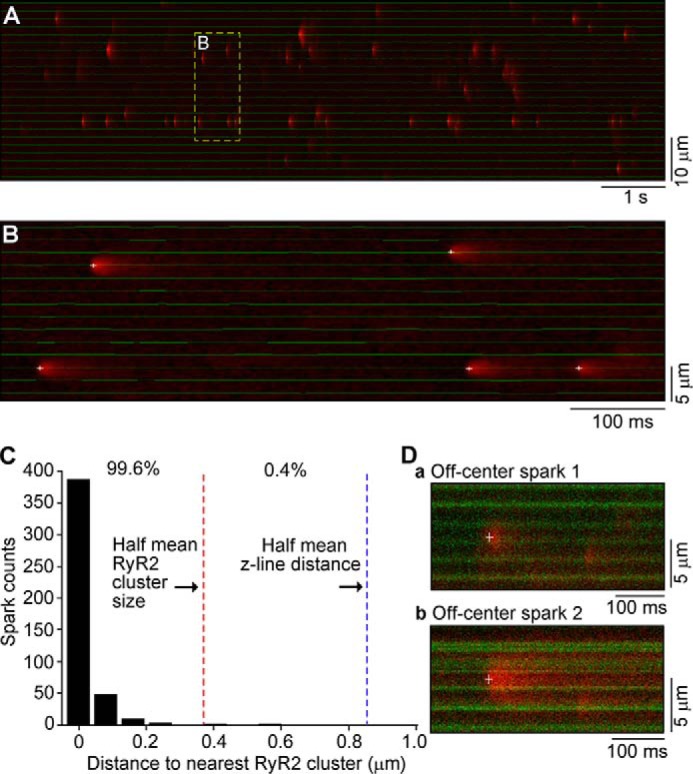
Distribution of Ca2+ sparks in relation to GFP-RyR2 clusters in live ventricular myocytes. A, a representative image of Ca2+ sparks and GFP-RyR2 clusters recorded simultaneously using confocal line scanning as described in the legend to Fig. 7. B, automated detection and localization of Ca2+ spark initiation sites (marked by white crosses) and centers of GFP-RyR2 clusters (indicated by a green line). C, distribution of the distance from spark initiation sites to the center of nearest GFP-RyR2 clusters. D, line scan images of off-center Ca2+ sparks and GFP-RyR2 clusters shown as green bands. Crosses mark the spark initiation sites.
Influence of Ca2+ Release from GFP-RyR2 Clusters on Mitochondrial Ca2+ Level in Ventricular Myocytes
Considering that GFP-RyR2 clusters are not co-localized with mitochondria (Fig. 6), it is of interest to determine whether Ca2+ release from GFP-RyR2 clusters could influence the Ca2+ level in mitochondria. To monitor mitochondrial Ca2+ level, we loaded the GFP-RyR2 ventricular myocytes with Rhod-2 AM using the protocol of Trollinger et al. (32) with cold loading followed by warm incubation. As shown in Fig. 9A, we observed a pattern of Rhod-2 loading similar to that of MitoTracker Red staining (Fig. 6), suggesting Rhod-2 loading to mitochondria as reported previously (31–33). Like the relative distribution of GFP-RyR2 clusters and MitoTracker Red staining (Fig. 6), GFP-RyR2 clusters are also not co-localized with Rhod-2 labeling (Fig. 9, B and C). To promote the occurrence of Ca2+ sparks, we electrically stimulated the GFP-RyR2 ventricular myocytes at 3 Hz in the presence of elevated extracellular Ca2+ (3 mm) and monitored mitochondrial Ca2+ level during and after the cessation of stimulation. We observed beat to beat mitochondrial Ca2+ transients during stimulation (Fig. 9, D–F). However, after cessation of stimulation, we could not detect significant local, transient elevations of Ca2+ or Ca2+ sparks in regions corresponding to either mitochondria or GFP-RyR2 clusters (Fig. 9D). On the other hand, Ca2+ sparks were readily detected after loading the cells with Fluo-4 AM (Fig. 9G). These observations suggest that Ca2+ release from GFP-RyR2 clusters in the form of Ca2+ sparks does not seem to substantially influence mitochondrial Ca2+ level.
FIGURE 9.
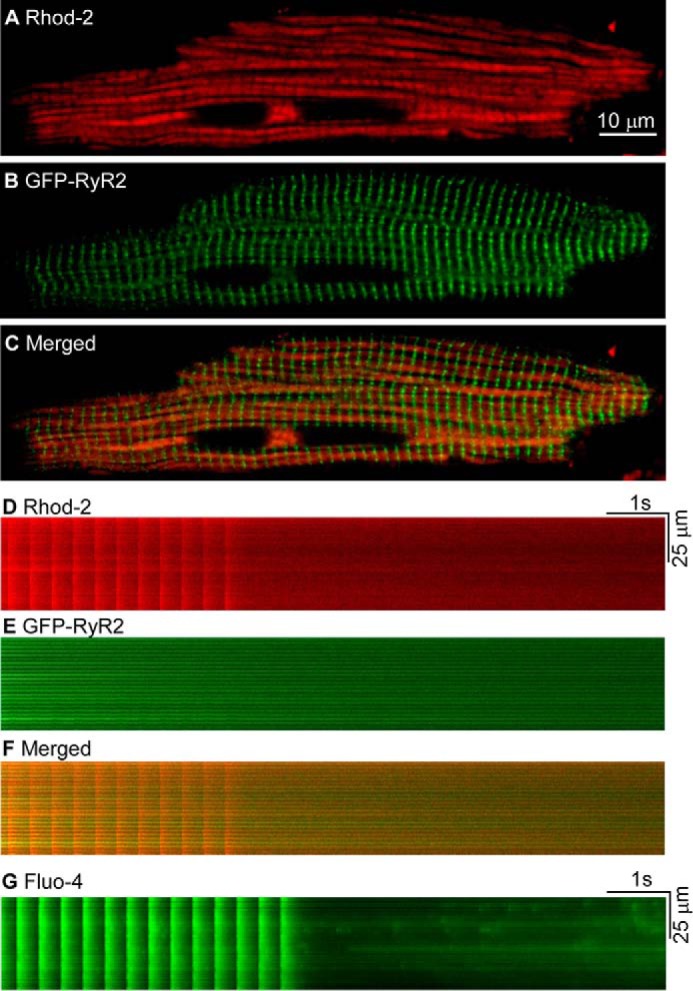
Influence of depolarization-induced Ca2+ release and Ca2+ sparks on mitochondrial Ca2+ level in GFP-RyR2 ventricular myocytes. A, mitochondria in live GFP-RyR2 ventricular myocytes (n = 16) were loaded with Rhod-2 AM and visualized with confocal fluorescence imaging. B, GFP-RyR2 cluster fluorescence signals of the same cell as in A. C, merged image of the Rhod-2 labeling and GFP-RyR2 signals. D, fluorescence signals of Rhod-2 loaded GFP-RyR2 ventricular myocytes (n = 28) during and after termination of pacing at 3 Hz in the presence of 3 mm extracellular Ca2+. E, GFP-RyR2 cluster fluorescence signals of the same cell as in D. F, merged image of the Rhod-2 and GFP-RyR2 signals. G, cytosolic Ca2+ transients and Ca2+ sparks revealed by Fluo-4 in GFP-RyR2 ventricular myocytes (n = 16) during and after termination of pacing at 3 Hz in the presence of 3 mm extracellular Ca2+.
Discussion
The present study investigates the distribution of RyR2 clusters and its function correlation in live ventricular myocytes using knock-in mice expressing a GFP-tagged RyR2. Nearly all studies on RyR2 distribution in cardiac cells have been carried out in fixed/permeabilized cells. It is unclear whether fixation and permeabilization could alter the distribution and organization of RyR2. To address this potential concern, we determined and compared the distribution of RyR2 clusters in live and fixed/permeabilized cardiomyocytes from GFP-tagged RyR2 mice. No differences in RyR2 distribution were detected between live and fixed cardiomyocytes. Furthermore, the distribution and organization of GFP-RyR2 clusters in live cardiomyocytes are very similar to those revealed by immunofluorescence labeling using anti-RyR2 antibodies. Thus, the fixation and permeation procedure is unlikely to grossly affect the distribution and organization of RyR2.
Our co-detection of GFP-RyR2 clusters and α-actinin, a commonly used marker for z-lines, revealed that virtually all GFP-RyR2 clusters are localized in the z-line zone. This strict co-localization of RyR2 clusters and the z-line zones has also been observed using fluorescent anti-RyR2 antibodies (28, 29). Different from these observations, Lukyanenko et al. (26) reported that a significant portion of Ry2 clusters (∼20%) were located between z-lines in the middle of the sarcomere, although no direct co-localization of RyR2 clusters and z-lines was shown in their study. These RyR2 clusters located at sites away from the z-lines were thought to play an important role in the spread of Ca2+ transients along the myofilaments (27). Chen-Izu et al. (22) did find some RyR2 clusters located between two rows of RyR2 clusters at the periphery, but not in the interior, of isolated, fixed cardiomyocytes. Similarly, we also observed these intercalated GFP-RyR2 clusters at the periphery of isolated live cardiomyocytes. However, very few GFP-RyR2 clusters were detected between z-lines in the interior of the cell. The reason for this potential discrepancy is unclear. It is interesting to note that the distribution and organization of RyR2 clusters and z-lines are not always in a regular striated pattern in cardiomyocytes. There are regions in which both the RyR2 clusters and z-lines are dislocated. Some of the dislocated RyR2 clusters in one area of the cell appeared to be located between the z-lines of the adjacent area, but they were in fact strictly co-localized with the z-line bands of α-actinin despite their irregular patterns of distribution. Thus, some of the RyR2 clusters that appear to be located in the middle of the sarcomere may have resulted from dislocated or misregistered RyR2 clusters/z-lines.
Ca2+ sparks have been detected mainly along z-lines in cardiomyocytes (24, 38). This is consistent with the distribution of RyR2 clusters along z-lines. However, Lukyanenko et al. (26) showed that a significant portion of Ca2+ sparks occurred between z-lines, suggesting that functional groups of RyR2s may exist between z-lines or in the middle of the sarcomere. It is important to point out that in the study of Lukyanenko et al., mitochondria were used as an indirect structural marker for localizing the site of Ca2+ sparks in relation to z-lines. Given the existence of dislocated RyR2 clusters/z-lines, it is unclear whether Ca2+ sparks detected in the middle of the sarcomere truly originated from functional groups of RyR2 resided between z-lines. To determine whether Ca2+ sparks occur between z-lines, we co-detected GFP-RyR2 clusters and Ca2+ sparks simultaneously in GFP-RyR2 cardiomyocytes. We found no Ca2+ sparks occurring between GFP-RyR2 clusters. Ca2+ sparks originated exclusively from GFP-RyR2 clusters. Because nearly all GFP-RyR2 clusters are localized in the z-line zones, it follows that Ca2+ sparks originated from GFP clusters would also be localized in the z-line zones. Thus, our data are inconsistent with the proposition that Ca2+ sparks occur between z-lines.
Ventricular myocytes contain transverse and longitudinal tubules. RyR2 clusters were primarily co-localized with transverse tubules in fixed cardiac cells (29, 35). Consistent with this, we also found that GFP-RyR2 clusters were mainly co-localized with the transverse tubules in live cardiomyocytes. Only a few GFP-RyR2 clusters were co-localized with the longitudinal tubules. There is also no close co-localization between RyR2 clusters and mitochondria in live cardiomyocytes. GFP-RyR2 clusters were detected in areas without mitochondria or were absent in a zone with mitochondria. Nearly all GFP-RyR2 clusters were located in regions that are devoid of mitochondria. In line with the lack of co-localization of GFP-RyR2 clusters and mitochondria, we could not detect significant local, transient elevations of mitochondrial Ca2+ level as a result of Ca2+ sparks from GFP-RyR2 clusters. Taken together, RyR2 clusters appear to follow the z-lines, but not the tubular system or the mitochondria.
In summary, in the present study, we employed a novel GFP-tagged RyR2 mouse model to directly visualize RyR2 clusters in live and fixed ventricular myocytes. The distribution of GFP-RyR2 clusters was similar in live and fixed cardiomyocytes. GFP-RyR2 clusters nearly strictly follow the z-lines and are closely associated with the transverse, but not longitudinal tubules. GFP-RyR2 clusters are located in areas that are devoid of mitochondria. Co-detection of GFP-RyR2 clusters and Ca2+ sparks reveals that Ca2+ sparks exclusively originate from RyR2 clusters. The GFP-RyR2 mice represent a useful model for studying the distribution, dynamics, and structure-function correlation of RyR2 clusters in the heart and other tissues in vivo.
Author Contributions
F. H., A. V., R. W., H. E. D. J. t. K., J. C., L. H.-M., R. B., and S. R. W. C. designed the research; F. H., A. V., R. W., and H. C. performed the research; F. H., A. V., R. W., L. H.-M., R. B., and S. R. W. C. analyzed the data; and F. H., A. V., R. W., H. E. D. J. t. K., L.H.-M., R. B., and S. R. W.C. wrote the paper.
This work was supported by research grants from the Natural Sciences and Engineering Research Council, Canadian Institutes of Health Research, the Canada Foundation for Innovation, and the Heart and Stroke Foundation/Libin Professorship in Cardiovascular Research (to S. R. W. C.), and Spanish Ministry of Science and Innovation Grants SAF2011-30312; CNIC-2009-08 (to L. H. M.) and DPI2013-44584-R (to R. B.). The authors declare that they have no conflicts of interest with the contents of this article.
- SR
- sarcoplasmic reticulum
- RyR
- ryanodine receptor
- ES cell
- embryonic stem cell
- KRH
- Krebs-Ringers-HEPES.
References
- 1. Bers D. M. (2001) Excitation-Contraction Coupling and Cardiac Contractile Force, 2nd Ed., Kluwer Academic Publishers, Dordrecht, The Netherlands [Google Scholar]
- 2. Bers D. M. (2002) Cardiac excitation-contraction coupling. Nature 415, 198–205 [DOI] [PubMed] [Google Scholar]
- 3. Cannell M. B., Cheng H., Lederer W. J. (1995) The control of calcium release in heart muscle. Science 268, 1045–1049 [DOI] [PubMed] [Google Scholar]
- 4. Cannell M. B., Soeller C. (1997) Numerical analysis of ryanodine receptor activation by L-type channel activity in the cardiac muscle diad. Biophys. J. 73, 112–122 [DOI] [PMC free article] [PubMed] [Google Scholar]
- 5. Niggli E., Lederer W. J. (1990) Voltage-independent calcium release in heart muscle. Science 250, 565–568 [DOI] [PubMed] [Google Scholar]
- 6. Stern M. D. (1992) Theory of excitation-contraction coupling in cardiac muscle. Biophys. J. 63, 497–517 [DOI] [PMC free article] [PubMed] [Google Scholar]
- 7. Stern M. D., Lakatta E. G. (1992) Excitation-contraction coupling in the heart: the state of the question. FASEB J. 6, 3092–3100 [DOI] [PubMed] [Google Scholar]
- 8. Sobie E. A., Dilly K. W., dos Santos Cruz J., Lederer W. J., Jafri M. S. (2002) Termination of cardiac Ca2+ sparks: an investigative mathematical model of calcium-induced calcium release. Biophys. J. 83, 59–78 [DOI] [PMC free article] [PubMed] [Google Scholar]
- 9. Bassani J. W., Yuan W., Bers D. M. (1995) Fractional SR Ca release is regulated by trigger Ca and SR Ca content in cardiac myocytes. Am. J. Physiol. 268, C1313–C1319 [DOI] [PubMed] [Google Scholar]
- 10. Stern M. D., Pizarro G., Ríos E. (1997) Local control model of excitation-contraction coupling in skeletal muscle. J. Gen. Physiol. 110, 415–440 [DOI] [PMC free article] [PubMed] [Google Scholar]
- 11. López-López J. R., Shacklock P. S., Balke C. W., Wier W. G. (1995) Local calcium transients triggered by single L-type calcium channel currents in cardiac cells. Science 268, 1042–1105 [DOI] [PubMed] [Google Scholar]
- 12. López-López J. R., Shacklock P. S., Balke C. W., Wier W. G. (1994) Local, stochastic release of Ca2+ in voltage-clamped rat heart cells: visualization with confocal microscopy. J. Physiol. 480, 21–29 [DOI] [PMC free article] [PubMed] [Google Scholar]
- 13. Wier W. G., Egan T. M., López-López J. R., Balke C. W. (1994) Local control of excitation-contraction coupling in rat heart cells. J. Physiol. 474, 463–471 [DOI] [PMC free article] [PubMed] [Google Scholar]
- 14. Franzini-Armstrong C., Protasi F., Ramesh V. (1999) Shape, size, and distribution of Ca2+ release units and couplons in skeletal and cardiac muscles. Biophys. J. 77, 1528–1539 [DOI] [PMC free article] [PubMed] [Google Scholar]
- 15. Cheng H., Lederer W. J., Cannell M. B. (1993) Calcium sparks: elementary events underlying excitation-contraction coupling in heart muscle. Science 262, 740–744 [DOI] [PubMed] [Google Scholar]
- 16. Cheng H., Lederer M. R., Xiao R. P., Gómez A. M., Zhou Y. Y., Ziman B., Spurgeon H., Lakatta E. G., Lederer W. J. (1996) Excitation-contraction coupling in heart: new insights from Ca2+ sparks. Cell Calcium 20, 129–140 [DOI] [PubMed] [Google Scholar]
- 17. Cheng H., Lederer W. J. (2008) Calcium sparks. Physiol. Rev. 88, 1491–1545 [DOI] [PubMed] [Google Scholar]
- 18. Smith G. D., Keizer J. E., Stern M. D., Lederer W. J., Cheng H. (1998) A simple numerical model of calcium spark formation and detection in cardiac myocytes. Biophys. J. 75, 15–32 [DOI] [PMC free article] [PubMed] [Google Scholar]
- 19. Carl S. L., Felix K., Caswell A. H., Brandt N. R., Ball W. J., Jr, Vaghy P. L., Meissner G., Ferguson D. G. (1995) Immunolocalization of sarcolemmal dihydropyridine receptor and sarcoplasmic reticular triadin and ryanodine receptor in rabbit ventricle and atrium. J. Cell Biol. 129, 672–682 [DOI] [PMC free article] [PubMed] [Google Scholar]
- 20. Sedarat F., Xu L., Moore E. D., Tibbits G. F. (2000) Colocalization of dihydropyridine and ryanodine receptors in neonate rabbit heart using confocal microscopy. Am. J. Physiol. Heart Circ. Physiol. 279, H202–H209 [DOI] [PubMed] [Google Scholar]
- 21. Scriven D. R., Dan P., Moore E. D. (2000) Distribution of proteins implicated in excitation-contraction coupling in rat ventricular myocytes. Biophys. J. 79, 2682–2691 [DOI] [PMC free article] [PubMed] [Google Scholar]
- 22. Chen-Izu Y., McCulle S. L., Ward C. W., Soeller C., Allen B. M., Rabang C., Cannell M. B., Balke C. W., Izu L. T. (2006) Three-dimensional distribution of ryanodine receptor clusters in cardiac myocytes. Biophys. J. 91, 1–13 [DOI] [PMC free article] [PubMed] [Google Scholar]
- 23. Dan P., Lin E., Huang J., Biln P., Tibbits G. F. (2007) Three-dimensional distribution of cardiac Na+-Ca2+ exchanger and ryanodine receptor during development. Biophys. J. 93, 2504–2518 [DOI] [PMC free article] [PubMed] [Google Scholar]
- 24. Parker I., Zang W. J., Wier W. G. (1996) Ca2+ sparks involving multiple Ca2+ release sites along Z-lines in rat heart cells. J. Physiol. 497, 31–38 [DOI] [PMC free article] [PubMed] [Google Scholar]
- 25. Asghari P., Schulson M., Scriven D. R., Martens G., Moore E. D. (2009) Axial tubules of rat ventricular myocytes form multiple junctions with the sarcoplasmic reticulum. Biophys. J. 96, 4651–4660 [DOI] [PMC free article] [PubMed] [Google Scholar]
- 26. Lukyanenko V., Ziman A., Lukyanenko A., Salnikov V., Lederer W. J. (2007) Functional groups of ryanodine receptors in rat ventricular cells. J. Physiol. 583, 251–269 [DOI] [PMC free article] [PubMed] [Google Scholar]
- 27. Subramanian S., Viatchenko-Karpinski S., Lukyanenko V., Györke S., Wiesner T. F. (2001) Underlying mechanisms of symmetric calcium wave propagation in rat ventricular myocytes. Biophys. J. 80, 1–11 [DOI] [PMC free article] [PubMed] [Google Scholar]
- 28. Soeller C., Crossman D., Gilbert R., Cannell M. B. (2007) Analysis of ryanodine receptor clusters in rat and human cardiac myocytes. Proc. Natl. Acad. Sci. U.S.A. 104, 14958–14963 [DOI] [PMC free article] [PubMed] [Google Scholar]
- 29. Jayasinghe I. D., Crossman D. J., Soeller C., Cannell M. B. (2010) A new twist in cardiac muscle: dislocated and helicoid arrangements of myofibrillar z-disks in mammalian ventricular myocytes. J. Mol. Cell. Cardiol. 48, 964–971 [DOI] [PubMed] [Google Scholar]
- 30. Hunt D. J., Jones P. P., Wang R., Chen W., Bolstad J., Chen K., Shimoni Y., Chen S. R. (2007) K201 (JTV519) suppresses spontaneous Ca2+ release and [3H]ryanodine binding to RyR2 irrespective of FKBP12.6 association. Biochem. J. 404, 431–438 [DOI] [PMC free article] [PubMed] [Google Scholar]
- 31. Griffiths E. J., Stern M. D., Silverman H. S. (1997) Measurement of mitochondrial calcium in single living cardiomyocytes by selective removal of cytosolic indo 1. Am. J. Physiol. 273, C37–C44 [DOI] [PubMed] [Google Scholar]
- 32. Trollinger D. R., Cascio W. E., Lemasters J. J. (1997) Selective loading of Rhod 2 into mitochondria shows mitochondrial Ca2+ transients during the contractile cycle in adult rabbit cardiac myocytes. Biochem. Biophys. Res. Commun. 236, 738–742 [DOI] [PubMed] [Google Scholar]
- 33. Griffiths E. J. (1999) Species dependence of mitochondrial calcium transients during excitation-contraction coupling in isolated cardiomyocytes. Biochem. Biophys. Res. Commun. 263, 554–559 [DOI] [PubMed] [Google Scholar]
- 34. Liu Z., Zhang J., Wang R., Wayne Chen S. R., Wagenknecht T. (2004) Location of divergent region 2 on the three-dimensional structure of cardiac muscle ryanodine receptor/calcium release channel. J. Mol. Biol. 338, 533–545 [DOI] [PubMed] [Google Scholar]
- 35. Jayasinghe I. D., Cannell M. B., Soeller C. (2009) Organization of ryanodine receptors, transverse tubules, and sodium-calcium exchanger in rat myocytes. Biophys. J. 97, 2664–2673 [DOI] [PMC free article] [PubMed] [Google Scholar]
- 36. Cordeiro J. M., Spitzer K. W., Giles W. R., Ershler P. E., Cannell M. B., Bridge J. H. (2001) Location of the initiation site of calcium transients and sparks in rabbit heart Purkinje cells. J. Physiol. 531, 301–314 [DOI] [PMC free article] [PubMed] [Google Scholar]
- 37. Szalai G., Csordás G., Hantash B. M., Thomas A. P., Hajnóczky G. (2000) Calcium signal transmission between ryanodine receptors and mitochondria. J. Biol. Chem. 275, 15305–15313 [DOI] [PubMed] [Google Scholar]
- 38. Cleemann L., Wang W., Morad M. (1998) Two-dimensional confocal images of organization, density, and gating of focal Ca2+ release sites in rat cardiac myocytes. Proc. Natl. Acad. Sci. U.S.A. 95, 10984–10989 [DOI] [PMC free article] [PubMed] [Google Scholar]


