

Abstract
OBJECTIVE
To assess the nutritional status of patients on maintenance hemodialysis by using modified quantitative subjective global assessment (MQSGA) and anthropometric measurements.
METHOD
We Conducted a cross sectional descriptive analytical study to assess the nutritional status of fifty four patients with chronic kidney disease undergoing maintenance hemodialysis by using MQSGA and different anthropometric and laboratory measurements like body mass index (BMI), mid-arm circumference (MAC), mid-arm muscle circumference (MAMC), triceps skin fold (TSF) and biceps skin fold (BSF), serum albumin, C-reactive protein (CRP) and lipid profile in a government tertiary hospital at Kathmandu, Nepal.
RESULTS
Based on MQSGA criteria, 66.7% of the patients suffered from mild to moderate malnutrition and 33.3% were well nourished. None of the patients were severely malnourished. CRP was positive in 56.3% patients. Serum albumin, MAC and BMI were (mean + SD) 4.0 + 0.3 mg/dl, 22 + 2.6 cm and 19.6 ± 3.2 kg/m2 respectively. MQSGA showed negative correlation with MAC (r = −0.563; P = <0.001), BMI (r = −0.448; P = <0.001), MAMC (r = −0.506; P = <.0001), TSF (r = −0.483; P = <.0002), and BSF (r = −0.508; P = <0.0001). Negative correlation of MQSGA was also found with total cholesterol, triglyceride, LDL cholesterol and HDL cholesterol without any statistical significance.
CONCLUSION
Mild to moderate malnutrition was found to be present in two thirds of the patients undergoing hemodialysis. Anthropometric measurements like BMI, MAC, MAMC, BSF and TSF were negatively correlated with MQSGA. Anthropometric and laboratory assessment tools could be used for nutritional assessment as they are relatively easier, cheaper and practical markers of nutritional status.
Keywords: nutritional status, CKD, MQSGA, anthropometric measuremen, hemodialysis
Introduction
Good nutritional status is a well-known marker of well-being in patients with chronic kidney disease (CKD). Protein energy malnutrition (PEM) develops during the course of CKD and is associated with adverse outcomes.1 Although most of the overt symptoms of uremia diminish or disappear after commencement of maintenance hemodialysis (MHD), the dialysis procedure in itself may promote wasting by various mechanisms.2,3 Te pathogenesis of PEM in MHD patients is multifactorial in which acidosis and increased catabolism play important roles.1,4 Nutritional status and dialysis adequacy index are considered major determinants of mortality and morbidity in patients undergoing MHD.5
Several methods are used to evaluate the nutritional status of hemodialysis patients. Among these nutritional assessment tools, the widely used are subjective global assessment (SGA), modified quantitative subjective global assessment (MQSGA), and malnutrition score (MS).6,7 SGA tool was developed by Detsky et al in 1984 that comprises subjective and objective aspects of nutritional status.8 National Kidney Foundation Kidney Disease/Dialysis Outcomes and Quality Initiative (NKF/KDOQI) recommends assessing nutritional status of patients undergoing MHD by using SGA at least every six months.9 Kalantar-Zadeh et al6 developed a fully quantitative method to assess nutritional status in MHD patients in a practical and inexpensive way. This new tool relies on clinical judgment derived from grading scales calculated from a brief history and physical examination,10 which aids in the prediction of nutrition-associated clinical outcomes in different conditions.11,12 The tool has many strengths in the clinical and research settings because it is inexpensive, easy to conduct, and can be used effectively by providers from different disciplines.13
Generally, patients with end-stage renal disease (ESRD) in Nepal receive two four-hour sessions of hemodialysis per week. Malnutrition is common among Nepali population, and it becomes more intense in the patients with CKD.14 Nutritional status of these patients could be improved by regular evaluation and creating nutritional awareness in these patients. So far, there is no published study on nutritional assessment of Nepalese CKD patients using MQSGA score. This study aims to assess the nutritional status of ESRD patients undergoing MHD in a government hospital using anthropometric measurement, laboratory parameters, and MQSGA score.
Methods
Sampling frame
This is a cross-sectional analysis of the patients with ESRD undergoing MHD in the Department of Nephrology, National Academy of Medical Sciences, Bir Hospital, Kathmandu, Nepal. The study was conducted after an approval from the institutional review board of National Academy of Medical Sciences and a written informed consent was obtained from each patient prior to enrollment in the study. The research complied with the principles of the Declaration of Helsinki.
Patients who were on MHD for more than six months were the population for this study. Fifty-eight of 60 patients undergoing MHD at the commencement of study agreed to participate (participation rate = 96%). Exclusions applied for patients with active infection at the time of study, history of admission to the hospital in the past three months, alcoholism, acute renal failure, cancer, major adverse cardiovascular events, severe gastrointestinal, and hepatic diseases. Four patients were excluded from the analysis leaving the final study sample at 54.
Clinical and laboratory assessment
Patient’s medical history, demographics, and duration of hemodialysis were obtained from the hospital registry. On the day of evaluation, predialysis blood samples were collected to estimate complete blood count, serum urea, creatinine, calcium, phosphate, total protein and albumin, qualitative CRP, and lipid profile. Patients were interviewed during dialysis for their dietary habit, change in weight, gastrointestinal symptoms, and all other information relevant to the MQSGA tool.6
Anthropometric measurements were carried out 10–20 minutes after completion of hemodialysis. Height and body weight were measured with light clothing. Body mass index (BMI) was calculated as the ratio of end dialysis body weight in kilogram and the square of the height in meters (kg/m2). Patient’s postdialysis dry weight six months prior to study date was collected from the hospital record. Measure ments of skin fold in the areas of biceps (BSF) and triceps muscle (TSF) were done with Vernier’s caliper to estimate body fat. Measurement of mid-arm circumference (MAC) was done with a measuring tape on the nonaccess arm to estimate muscle mass. MAC signifies the thickness of subcutaneous fat and muscle. Mid-arm muscle circumference (MAMC), which reflects the protein store in the body, was calculated using the following formula: MAMC = MAC − (3.1415 × TSF).15
Evaluation of nutritional status by MQSGA method
Nutritional status was assessed by MQSGA that relied on seven components—weight change, dietary intake, gastrointestinal symptoms, functional capacity, comorbidity, subcutaneous fat, and signs of muscle wasting. Each component was given a score from 1 (normal) to 5 (very severe). Tus, the MS, sum of all components, ranged from 7 (normal) to 35 (severely malnourished).6 Patients were categorized into three groups: normal nutrition (score of 7–10), mild-to-moderate malnutrition (score of 11–20), and severe malnutrition (score of 21–35).
Statistical analysis
Statistical analysis was done using SAS University Studio Edition software (SAS Institute). All categorical variables are expressed as percentages and compared across cohorts using the X2 test. Continuous variables are expressed as mean ± standard deviation and the statistical significance of mean differences is compared using ANOVA and t-test across cohorts as appropriate. Pearson’s correlation is used to assess the magnitude and direction of association between MQSGA scores and anthropometric measures. P-values <0.05 are considered statistically significant. Sensitivity analysis regarding the use of individual anthropometric measure to predict the MQSGA categories are compared using the receiver operating characteristic (ROC) analysis in the logistic regression framework.
Results
The final study sample included 54 patients, 38 males and 16 females with the mean age of 45.4 ± 12.3 years. The duration of hemodialysis ranged from six months to 12 years with a mean duration of 48.0 ± 32.8 months. Demographic and anthropometric parameters are shown in Table 1. Mean BMI was 19.57 ± 3.19. The bodily measurements such as height, weight, MAC, and MAMC were significantly higher in male, whereas measurements like BMI, BSF, and TSF did not differ by gender.
Table 1.
Demography and anthropometric measurement of study population.
| VARIABLES | TOTAL (N = 54) | FEMALE (N = 16) | MALE (N = 38) | MALE VS FEMALE |
|---|---|---|---|---|
| MEAN ± SD | MEAN ± SD | MEAN ± SD | P-VALUE | |
| Age (years) | 45.41 ± 12.31 | 44.69 ± 11.83 | 45.71 ± 12.64 | 0.783 |
| Height (cm) | 160.43 ± 6.03 | 154.8 ± 4.87 | 162.8 ± 4.8 | <.0001* |
| Weight (kg) | 50.64 ± 10.39 | 45.39 ± 7.99 | 52.84 ± 10.58 | 0.015* |
| BMI (kg/m2) | 19.57 ± 3.19 | 18.86 ± 2.59 | 19.87 ± 3.4 | 0.296 |
| BSF (mm) | 5.37 ± 1.73 | 4.69 ± 1.35 | 5.66 ± 1.81 | 0.059 |
| TSF (mm) | 7.37 ± 2.37 | 6.63 ± 1.89 | 7.68 ± 2.49 | 0.134 |
| MAC (cm) | 22.57 ± 2.56 | 20.81 ± 1.97 | 23.32 ± 2.43 | 0.001* |
| MAMC (cm) | 20.26 ± 2.15 | 18.73 ± 1.63 | 20.91 ± 2.03 | 0.000* |
| MQSGA | 12.17 ± 3.21 | 13.75 ± 3.36 | 11.5 ± 2.94 | 0.017* |
| MHD (months) | 48.03 ± 32.78 | 51.56 ± 32.99 | 46.55 ± 33.02 | 0.613 |
Abbreviations: BMI, body mass index; MQSGA, modified quantitative subjective global assessment; BSF, biceps skin fold; TSF, triceps skin fold; MAC, mid-arm circumference; MAMC, mid-arm muscle circumference.
Mean serum protein, albumin calcium and phosphate were within normal range (Table 2). C-reactive protein was positive in 56.3% of patients. All laboratory measurements had no significant difference between male and female.
Table 2.
Laboratory parameters of study population.
| VARIABLES | TOTAL (N = 54) | NORMAL RANGE (FOR REFERENCE) |
|---|---|---|
| MEAN ± SD | ||
| Total leukocyte count (cell/mm3) | 4961 ± 2281 | 4,000–11,000 |
| Platelet counts (cells/mm3) | 134128 ± 52798 | 150000–400000 |
| Hemoglobin (gram%) | 7.38 ± 1.12 | 12–14 |
| Neutrophils (%) | 65.94 ± 6.91 | 45–75 |
| Lymphocytes (%) | 28.19 ± 6.56 | 25–40 |
| Blood sugar (mg/dL) | 101.96 ± 35.05 | 70–110 |
| Urea (mg/dL) | 107.28 ± 33.04 | 7–20 |
| Creatinine (mg/dL) | 7.35 ± 2.52 | 135–145 |
| Sodium (mmol/L) | 138.72 ± 3.83 | 0.5–1.4 |
| Potassium (mmol/L) | 4.31 ± 0.79 | 3.5–5.5 |
| Uric acid (mg/dL) | 4.87 ± 1.8 | 3.4–7.2 |
| Total protein (gm/dL) | 7.24 ± 0.71 | 6.4–8.3 |
| Albumin (gm/dL) | 4.03 ± 0.3 | 3.5–4.5 |
| Calcium (mg/dL) | 8.53 ± 0.98 | 8.4–10.2 |
| Phosphate (mg/dL) | 5.13 ± 1.16 | 2.4–4.1 |
| Total cholesterol (mg/dL) | 138.65 ± 39.13 | <200 |
| HDLl cholesterol (mg/dL) | 41.69 ± 22.13 | 40–60 |
| LDL cholesterol (mg/dL) | 75.83 ± 27.75 | <100 |
| Triglycerides (mg/dL) | 107.35 ± 44.91 | <150 |
Overall MQSGA in the study population was 12.2 ± 3.2. One-third of the study population was classified as normal nutritional status, and two-thirds were classified as mild to moderately malnourished. Female patients had significantly higher mean MQSGA score than the males (13.8 ± 3.4 vs 11.5 ± 2.9; P = 0.017); suggesting a relatively worse nutritional status. However, a test of independence between gender and MQSGA categories showed no statistical significance (X2 = 2.18, P = 0.140). All anthropometric parameters of patients with normal nutrition were significantly higher than patients with mild-to-moderate malnutrition (Table 3). Laboratory parameters between normal and malnourished patients were not statistically significant.
Table 3.
Anthropometric, serum albumin, and lipid profile by MQSGA categories.
| VARIABLES | NORMAL NUTRITION (n = 18) | MILD TO MODERATE MALNUTRITION (n = 36) | P-VALUE |
|---|---|---|---|
| MEAN ± SD | MEAN ± SD | ||
| Sex (female%) | 16.7% | 36.1% | 0.146 |
| Age (years) | 43.61 ± 11.38 | 46.31 ± 12.81 | 0.453 |
| Height (cm) | 162.56 ± 5.58 | 159.36 ± 6.03 | 0.066 |
| Weight (kg) | 58.72 ± 10.66 | 46.59 ± 7.61 | <.0001* |
| MQSGA | 9.11 ± 1.23 | 13.69 ± 2.77 | <.0001* |
| BMI (kg/m2) | 22.12 ± 3.14 | 18.29 ± 2.37 | <.0001* |
| BSF (mm) | 6.61 ± 1.79 | 4.75 ± 1.34 | <.0001* |
| TSF (mm) | 8.94 ± 2.86 | 6.58 ± 1.61 | 0.004* |
| MAC (cm) | 24.72 ± 2.47 | 21.50 ± 1.84 | <.0001* |
| MAMC (cm) | 21.93 ± 2.21 | 19.43 ± 1.58 | <.0001* |
| Hemoglobin (gm/dL) | 7.37 ± 0.96 | 7.38 ± 1.21 | 0.960 |
| Total protein (gm/dL) | 7.14 ± 0.72 | 7.28 ± 0.71 | 0.512 |
| Albumin (gm/dL) | 4.07 ± 0.26 | 4.01 ± 0.32 | 0.482 |
| Total cholesterol (mg/dL) | 150.94 ± 39.49 | 132.50 ± 38.02 | 0.103 |
| HDL-cholesterol (mg/dL) | 50.56 ± 35.61 | 37.25 ± 8.08 | 0.135 |
| LDL-cholesterol (mg/dL) | 81.00 ± 30.98 | 73.25 ± 26.06 | 0.338 |
| Triglyceride (mg/dL) | 126.39 ± 54.61 | 97.83 ± 36.41 | 0.056 |
| MHD (months) | 42.89 ± 28.90 | 50.61 ± 34.65 | 0.420 |
| CRP (+ ve) | 22.2% | 44.4% | 0.070 |
Abbreviations: MQSGA, modified quantitative subjective global assessment; BMI, body mass index; BSF, biceps skin fold; TSF, triceps skin fold; MAC, mid-arm circumference; MAMC, mid-arm muscle circumference; MHD, maintenance hemodialysis.
Relationship between MQSGA and selected anthropometric measures and laboratory parameters is shown in Table 4. There was no statistical evidence for the correlation of serum albumin with MQSGA (P = 0.930). All assessed anthropometric measurements were negatively correlated with MQSGA and were statically significant.
Table 4.
Correlation of anthropometric assessments and lab parameters with MQSGA.
| VARIABLES | MQSGA | |
|---|---|---|
| r | P-VALUE | |
| BMI (kg/m2) | −0.448 | 0.001* |
| BSF (mm) | −0.508 | <.0001* |
| TSF (mm) | −0.483 | 0.0002* |
| MAC (cm) | −0.563 | <.0001* |
| MAMC (cm) | −0.506 | <.0001* |
| Hemoglobin (gm/dL) | 0.243 | 0.077 |
| Blood sugar (mg/dL) | −0.039 | 0.780 |
| Urea (mg/dL) | −0.293 | 0.031* |
| Creatinine (mg/dL) | 0.283 | 0.038* |
| Sodium (mmol/L) | −0.289 | 0.034* |
| Potassium (mmol/L) | −0.157 | 0.257 |
| Uric acid (mg/dL) | −0.274 | 0.045* |
| Total protein (gm/dL) | 0.275 | 0.044* |
| Albumin (mg/dL) | 0.012 | 0.930 |
| Calcium (mg/dL) | −0.033 | 0.813 |
| Phosphate (mg/dL) | −0.316 | 0.020* |
| Total cholesterol (mg/dL) | −0.180 | 0.194 |
| HDL-cholesterol (mg/dL) | −0.248 | 0.070 |
| LDL-cholesterol (mg/dL) | −0.122 | 0.380 |
| Triglyceride (mg/dL) | −0.197 | 0.153 |
Note: r for Pearson correlation coefficients (*P < 0.05).
Sensitivity analysis
The adequacy of individual anthropometric measures to predict nutritional status was compared through the regression modeling. Simple linear regression models were run for MQSGA score as dependent variable with respect to each of the five anthropometric measures (Fig. 1), and the goodness-of-fit of each model was compared. The MAC model (R2 = 0.320) had the strongest performance followed by BSF (R2 = 0.259) and MAMC (R2 = 0.256). Nearly all observation points fell within 95% prediction limits. BMI model performed the weakest among all measures in explaining the variation (R2 = 0.201). However, these R2 values are lower than the generally accepted range; these may not be as conclusive. Gender had no significant effect when included in the model, except for a weak relationship in the BMI model.
Figure 1.

Regression lines for MQSGA scores with respect to anthropometric measures.
Each anthropometric measure was converted into binary categories and used in the classification table with MQSGA categories. The strength of individual model in correctly identifying true positive or true negative cases in a classification matrix is measured by the lift on the ROC curve from a logistic regression model. ROC curve is plotted as sensitivity against the 1-specificity (Fig. 2). Sensitivity indicates the relative strength of the model in accurately predicting positive cases as positive, and specificity refers to the relative strength in predictive negative cases as negative. The values of area under ROC curve indicate how best the model can discriminate those true positive and true negative cases. A value of 1.0 indicates perfect discrimination while a value of 0.5 indicates random outcomes.16 Using this criteria, MAC was again the best performing in terms of prediction accuracy (AUC = 0.8773). Both MAMC (AUC = 0.8596) and BMI (AUC = 0.8519) performed very well. BSF (AUC = 0.7948) and TSF (AUC = 0.7855) had slightly lower but satisfactory lift.
Figure 2.
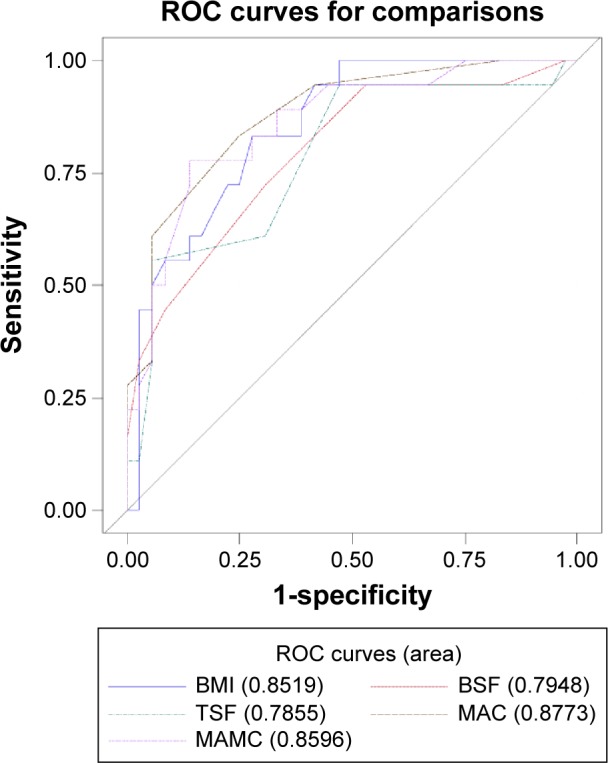
Comparison of area under ROC curve for all five anthropometric measures.
Discussion
Malnutrition is a common problem seen in patients with ESRD undergoing MHD. It has direct relationship with the quality of life and is associated with increased risk of mortality and morbidity in these groups of patients.17 Multiple factors play a role in the occurrence of malnutrition in patients undergoing hemodialysis,18–20 among which adequacy of dialysis, dietary intake, and recurrent infection are the important factors. Despite its immense clinical importance, evaluation of the nutritional status of dialysis patients is not considered as an important part in day-to-day practice.21
Several literatures show that the prevalence of PEM in dialysis patients is high22–24 ranging from 23% to 94% being malnourished.13,19,21,22,25,26 Evaluation of nutritional status of patients on MHD in a private teaching hospital of Nepal revealed malnutrition in 84.6%.13 In the present study, 66.7% of patients were mild to moderately malnourished. All the patients were receiving dialysis twice a week. As none of the patients with variable duration of dialysis were severely malnourished, poor dietary intake could have probably played a major role in mild-to-moderate malnutrition.
Strong negative correlation of MQSGA score with all anthropometric parameters like TSF, BSF, BMI, MAC, and MAMC in the current study was similar to previous studies13,27 suggesting that decrease in anthropometric measurements is associated with increased MQSGA scores. So, combination of these anthropometric assessments may be as effective as MQSGA for evaluation of malnutrition of hemodialysis population.
Although age was significantly correlated with MQSGA score, the difference was not evident in the nutritional status categories. Similar finding was demonstrated by Kalantar-Zadeh et al.6
Serum albumin is considered as an indicator of malnutrition but is not considered as a reliable index. Hypoalbuminemia is a relatively late manifestation of malnutrition, since albumin has a long half-life and hepatic synthetic reserve is very large. Several studies have demonstrated a negative correlation between the plasma albumin concentration and mortality in patients undergoing MHD or peritoneal dialysis.25,28–30 Overall MQSGA did not correlate with the serum albumin levels (r = 0.012; P = 0.930) and found similar across normal nutrition and malnutrition (P = 0.483). This was probably because of the fact that serum albumin and creatinine increase during the first half year of hemodialysis30 and a fall in serum albumin level lags much behind the onset of malnutrition. Similar findings were also reported in different studies from different parts of the world.24,31
Despite the higher risk of occurrence of dyslipidemia in ESRD32 and a few studies demonstrating its relationship with poor nutritional status,33,36 this study found no statistically significant association between nutritional status and lipid levels. However, lower total cholesterol and triglyceride observed in mild to moderately malnourished patients could be because of poor dietary intake.
Anemia generally develops in patients with chronic renal insufficiency and is associated with a wide range of complications. Almost all patients in both normal nutrition and moderately malnourished groups had moderate-to-severe anemia (P = 0.060) with overall mean hemoglobin level 7.38 ± 1.12. This particular finding differs from previous studies11,34 that demonstrated a significant relationship between anemia and severity of malnutrition. However, anemia is multifactorial in patients with ESRD and a low level of hemoglobin may result from many causes in these patients. Estimation of hemoglobin may not be reasonable during assessment of nutritional status.
Average values of anthropometric measures, such as height, weight, MAC, and MAMC, differ significantly by gender.35 Tough significant differences were detected in these measures, gender did not have a significant interaction with these variables in predicting MQSGA. This shows that the anthropometric measures can be used independent of gender, at least in the studies of Nepalese hemodialysis patients. MQSGA scoring showed mild-to-moderate malnutrition in two-thirds of the patients on MHD with no cases of severe malnutrition. Anthropometric assessment tools like BMI, MAC, MAMC, TSF, and BSF are relatively easier, cheaper, and practical markers of nutritional status. The ROC curve analysis and its lift show that these indicators may be used independently with high degree of accuracy in assessing the nutritional status among the Nepali MHD patients. A joint study is recommended for future, including patients from all area hospitals with MHD services, which would increase the sample size and be more representative of the population.
Limitation of the Study
Tough the study recruited 96% of the available population from one hospital in the study, there was no sample at the severely malnourished level. Owing to the small sample size, it is not ascertained at this time whether MHD population in Nepal, in general, is not severely malnourished. Another limitation of the study is the use of Engineer’s Vernier Caliper in place of skinfold caliper as the latter was not readily available in the local market. Engineer’s Vernier Caliper is still being used in many studies as per the 2001 guidelines in International Standards for Anthropometric Assessment by International Society for the Advancement of Kinanthropometry. The authors followed the guidelines and believed that the study includes valid measure of anthropometric indicators.
Acknowledgments
The authors would like to thank Dr. Dineshwori Shrestha for assisting in data collection, Abja Sapkota for compilation of data, all nursing staffs of the hemodialysis unit, Bir Hospital for helping in blood sample collection, and also all patients with ESRD undergoing hemodialysis at Bir hospital for their participation in the study.
Footnotes
ACADEMIC EDITOR: Joseph Zhou, Editor in chief
PEER REVIEW: Four peer reviewers contributed to the peer review report. Reviewers’ reports totaled 585 words, excluding any confidential comments to the academic editor.
FUNDING: Authors disclose no funding sources.
COMPETING INTERESTS: Authors disclose no potential conflicts of interest.
Paper subject to independent expert blind peer review. All editorial decisions made by independent academic editor. Upon submission manuscript was subject to antiplagiarism scanning. Prior to publication all authors have given signed confirmation of agreement to article publication and compliance with all applicable ethical and legal requirements, including the accuracy of author and contributor information, disclosure of competing interests and funding sources, compliance with ethical requirements relating to human and animal study participants, and compliance with any copyright requirements of third parties. This journal is a member of the committee on Publication Ethics (COPE).
Author Contributions
Conceived and designed the experiments: AS. Analyzed the data: GRB. Wrote the first draft of the manuscript: AS. Contributed to the writing of the manuscript: AS, GRB, RH and RKA. Agree with manuscript results and conclusions: AS, RH, RKA, GRB and AB. Jointly developed the structure and arguments for the paper: AS, RH, RKA and AB. Made critical revisions and approved final version: AS and GRB. All authors reviewed and approved of the final manuscript.
REFERENCES
- 1.National Kidney Foundation (NKF)/kidney disease outcome quality initiative (K/DOQI) K/DOQI clinical practice guidelines for chronic kidney disease: evaluation, classification and stratification. Am J Kidney Dis. 2002;39(suppl 1):S1–S266. [PubMed] [Google Scholar]
- 2.Must A, Dallal GE, Dietz WH. Reference data for obesity: 85th and 95th percentile for body mass index (wt/ht2) and triceps skin fold thickness. Am J Clin Nutr. 1991;53:839–846. doi: 10.1093/ajcn/53.4.839. [DOI] [PubMed] [Google Scholar]
- 3.Indian Society of Nephrology. Guidelines for the management of nutrition. Indian J Nephrol. 2005;15(Supl 1):S42–S46. [Google Scholar]
- 4.Todigo G, Aparicio M, Attman P-O, et al. Expert working group report on nutrition in adult patients with renal insufficiency (part 1 of 2) Clin Nutr. 2000;19(3):197–207. doi: 10.1054/clnu.1999.0130. [DOI] [PubMed] [Google Scholar]
- 5.Kopple JD. Nutritional status as a predictor of morbidity and mortality in maintenance dialysis patients. ASAIO J. 1997;43(3):246–250. [PubMed] [Google Scholar]
- 6.Kalantar-Zadeh K, Kleiner M, Dunn E, Lee GH, Luft FC. A modified quantitative subjective global assessment of nutrition for dialysis patients. Nephrol Dial Transplant. 1999;14(7):1732–1738. doi: 10.1093/ndt/14.7.1732. [DOI] [PubMed] [Google Scholar]
- 7.Steiber AL, Kalantar-Zadeh K, Secker D, McCarthy M, Sehgal A, McCann L. Subjective global assessment in chronic kidney disease: a review. J Renal Nutr. 2004;14(4):191–200. [PubMed] [Google Scholar]
- 8.Detsky AS, Baker JP, Mendelson RA, Wolman SL, Wesson DE, Jeejeebhoy KN. Evaluating the accuracy of nutritional assessment techniques applied to hospitalized patients: methodology and comparisons. JPEN J Parenter Enteral Nutr. 1984;8:153–159. doi: 10.1177/0148607184008002153. [DOI] [PubMed] [Google Scholar]
- 9.K/DOQI Nutrition in chronic renal failure. Am J Kidney Dis. 2000;35(6, suppl 2):S16–S25. doi: 10.1053/ajkd.2000.v35.aajkd03517. [DOI] [PubMed] [Google Scholar]
- 10.Enia G, Sicuso C, Alati G, Zoccali C. Subjective global assessment of nutrition in dialysis patients. Nephrol Dial Transplant. 1993;8(10):1094–1098. [PubMed] [Google Scholar]
- 11.Detsky AS, McLaughlin JR, Baker JP, et al. What is subjective global assessment of nutritional status? J Parenter Enteral Nutr. 1987;11(1):8–13. doi: 10.1177/014860718701100108. [DOI] [PubMed] [Google Scholar]
- 12.Canada-USA (CANUSA) Peritoneal Dialysis Study Group Adequacy of dialysis and nutrition in continuous peritoneal dialysis: association with clinical outcomes. J Am Soc Nephrol. 1996;7(2):198–207. doi: 10.1681/ASN.V72198. [DOI] [PubMed] [Google Scholar]
- 13.Jones C, Wolfenden R, Wells L. Is subjective global assessment a reliable measure of nutritional status in hemodialysis? J Ren Nutr. 2004;14(4):26–30. doi: 10.1053/j.jrn.2003.09.006. [DOI] [PubMed] [Google Scholar]
- 14.Manandhar DN, Chhetri PK, Pahari LR, Tiwari R, Chowdhary SK. Nutritional assessment of patients under hemodialysis in Nepal Medical College Teaching Hospital. Nepal Med Coll J. 2008;10(3):164–169. [PubMed] [Google Scholar]
- 15.Weber J, Kelley J. Assessing nutrition. In: Nieginski E, editor. Health Assessment in Nursing. 3rd ed. Philadelphia, PA: Lippincott Williams & Wilkins; 2003. pp. 165–174. [Google Scholar]
- 16.Hosmer DW, Lemeshow S. Applied Logistic Regression. 2nd ed. New York: Wiley; 2000. [Google Scholar]
- 17.Neumayer LA, Smout RJ, Horn HG, Horn SD. Early and sufficient feeding reduces length of stay and charges in surgical patients. J Surg Res. 2001;95(1):73–77. doi: 10.1006/jsre.2000.6047. [DOI] [PubMed] [Google Scholar]
- 18.Qureshi AR, Alvestrand A, Danielsson A, et al. Factors predicting malnutrition in hemodialysis patients: a cross-sectional study. Kidney Int. 1998;53(3):773–782. doi: 10.1046/j.1523-1755.1998.00812.x. [DOI] [PubMed] [Google Scholar]
- 19.Morais AA, Silva MA, Faintuch J, et al. Correlation of nutritional status and food intake in hemodialysis patients. Clinics. 2005;60(3):185–192. doi: 10.1590/s1807-59322005000300002. [DOI] [PubMed] [Google Scholar]
- 20.Hakim R, Tevin N. Malnutrition in hemodialysis patients. Am J Kidney Dis. 1993;21:125–137. doi: 10.1016/s0272-6386(12)81083-3. [DOI] [PubMed] [Google Scholar]
- 21.Mohammed FA, Farhood HF, AtheemWtwt MA. Prediction of malnutrition using modified subjective global assessment-dialysis malnutrition score in patients on chronic hemodialysis. J Community Med Health Educ. 2014;4(3):291. [Google Scholar]
- 22.Yamada K, Furuya R, Takita T, et al. Simplified nutritional screening tools for patients on maintenance hemodialysis. J Clin Nutr. 2008;87(1):106–113. doi: 10.1093/ajcn/87.1.106. [DOI] [PubMed] [Google Scholar]
- 23.Marckmann P. Nutritional status of patients on hemodialysis and peritoneal dialysis. Clin Nephrol. 1988;29(2):75–78. [PubMed] [Google Scholar]
- 24.Aparicio M, Cano N, Chauveau P, et al. Nutritional status of hemodialysis patients: a French national cooperative study. French Study Group for nutrition in dialysis. Nephrol Dial Transplant. 1999;14(7):1679–1686. doi: 10.1093/ndt/14.7.1679. [DOI] [PubMed] [Google Scholar]
- 25.Lowrie EG, Lew NL. Death risk in hemodialysis patients: the predictive value of commonly measured variables and an evaluation of death rate differences between facilities. Am J Kidney Dis. 1990;15(5):458–482. doi: 10.1016/s0272-6386(12)70364-5. [DOI] [PubMed] [Google Scholar]
- 26.Tapiawala S, Vora H, Patel Z, Badve S, Shah B. Subjective global assessment of nutritional status of patients with chronic renal insufficiency and end stage renal disease on dialysis. J Assoc Physicians India. 2006;54:923–926. [PubMed] [Google Scholar]
- 27.Chen J, Peng H, Yuan Z, et al. Combination with anthropometric measurements and MQSGA to assess nutritional status in Chinese hemodialysis population. Int J Med Sci. 2013;10(8):974–980. doi: 10.7150/ijms.5811. [DOI] [PMC free article] [PubMed] [Google Scholar]
- 28.Owen WF, Jr, Lew NL, Liu Y, Lowrie EG, Lazarus JM. The urea reduction ratio and serum albumin concentration as predictors of mortality in patients undergoing hemodialysis. N Engl J Med. 1993;329(14):1001–1006. doi: 10.1056/NEJM199309303291404. [DOI] [PubMed] [Google Scholar]
- 29.Goldwasser P, Mittman N, Antignani A, et al. Predictors of mortality in hemodialysis patients. J Am Soc Nephrol. 1993;3(9):1613–1622. doi: 10.1681/ASN.V391613. [DOI] [PubMed] [Google Scholar]
- 30.Goldwasser P, Kaldas AI, Barth RH. Rise in serum albumin and creatinine in the first half year on hemodialysis. Kidney Int. 1999;56(6):2260–2268. doi: 10.1046/j.1523-1755.1999.00768.x. [DOI] [PubMed] [Google Scholar]
- 31.Covinsky KE, Covinsky MH, Palmer RM, Sehgal AR. Serum albumin concentration and clinical assessments of nutritional status in hospitalized older people: different sides of different coins. J Am Geriatr Soc. 2002;50(4):631–637. doi: 10.1046/j.1532-5415.2002.50156.x. [DOI] [PubMed] [Google Scholar]
- 32.Saltisi D, Morgan C, Rigby RJ, Westhuyzen J. Safet y and efficacy of simvastatin in hypercholesterolemic patients undergoing chronic renal dialysis. Am J Kidney Dis. 2002;39(2):283–290. doi: 10.1053/ajkd.2002.30547. [DOI] [PubMed] [Google Scholar]
- 33.Basaleem HO, Alwan SM, Ahmed AA, Al-Sakkaf KA. Assessment of the nutritional status of end-stage renal disease patients on maintenance hemodialysis. Saudi J Kidney Dis Transpl. 2004;15(4):455–462. [PubMed] [Google Scholar]
- 34.Anees M, Ahmed A, Rizwan S. Evaluation of nutritional status of patients on hemodialysis. J Coll Physicians Surg Pak. 2004;14(11):665–669. [PubMed] [Google Scholar]
- 35.Center for Disease Control Anthropometric reference data for children and adults: United States, 2007–2010. Vital Health Stat. 2012;(252):1–48. [PubMed] [Google Scholar]
- 36.Zhang K, Cheng G, Cai X, et al. Malnutrition, a new inducer for arterial calcification in hemodialysis patients. J Transl Med. 2013;11:66. doi: 10.1186/1479-5876-11-66. [DOI] [PMC free article] [PubMed] [Google Scholar]