

Abstract
OBJECTIVES
Cancer continues to be the leading disease-related cause of death among children and adolescents in the United States. More current information is needed to describe recent cancer trends and identify demographic and geographic variations.
METHODS
We analyzed data from the National Program of Cancer Registries and Surveillance, Epidemiology, and End Results statewide registries representing 94.2% of the US population to identify cancers diagnosed among persons aged 0 to 19 years during 2001–2009. Age-adjusted rates and annual percentage change for trends were calculated. Data were stratified by age, gender, race, ethnicity, and geography.
RESULTS
We identified 120 137 childhood and adolescent cancer cases during 2001–2009 with an age-adjusted incidence rate of 171.01 per million. The overall rate of all cancers combined remained stable over time (annual percent change [APC], 0.3%; 95% confidence interval [CI], −0.1 to 0.7). There was an increase in the overall cancer trend among African American children and adolescents (APC, 1.3%; 95% CI, 0.2 to 2.5). An increasing trend for thyroid cancer was observed among both genders (APC, 4.9%; 95% CI, 3.2 to 6.6) and specifically among adolescents and those in the Northeast, South, and West regions of the United States. Renal carcinoma incidence was increasing significantly overall (APC, 5.4%; 95% CI, 2.8 to 8.1). Extracranial and extragonadal germ cell tumors and melanoma were both significantly decreasing.
CONCLUSIONS
This study reports the novel finding that renal carcinoma rates are increasing among children and adolescents. This study confirms that thyroid cancer rates are increasing and further describes rising cancer rates among African Americans.
Keywords: adolescent, cancer, children, incidence, pediatric
Although cancer continues to be the leading disease-related cause of death among children and adolescents in the United States, it is difficult to describe its incidence accurately without national cancer data.1,2 Using 2001–2003 National Program of Cancer Registries (NPCR) and Surveillance, Epidemiology, and End Results (SEER) data, Li et al3 demonstrated regional differences in the incidence of childhood cancer and that the incidence varied by age, gender, and race. Additional studies have looked at recent childhood cancer trends by using smaller data sets, or have included the overall childhood cancer rates without detailing the specific types of cancer.4–8 Although several of these studies have examined trends in overall cancer incidence rates among children and adolescents, study findings vary partially because of differing time range and population coverage.4–6,9,10 By focusing analysis on specific cancers and subgroups among individuals aged 0 to 19 years, Linabery and Ross4 reported increases in incidence rates of leukemia (acute lymphoblastic leukemia, in particular), hepatoblastoma, and melanoma from 1992 to 2004 and concluded that ongoing population-based evaluation is needed to further understand these dynamic and subgroup-based trends.
Although the diagnosis, age, gender, and race characteristics of pediatric cancer are well reported, the change of these characteristics over time is less defined. Determining recent cancer-specific trends is important in identifying high-risk populations and in developing research hypotheses. However, information about pediatric cancers and cancer subtypes by demographic and temporal factors across the nation is lacking.3 This study aimed to describe cancer rates and trends among children and adolescents by demographic characteristics by using data for more than 90% of the US population.
METHODS
Data Source
We analyzed data from 47 population-based state cancer registries affiliated with the Centers for Disease Control and Prevention’s NPCR and the National Cancer Institute’s SEER Program. These data met US Cancer Statistics publication criteria for 2001–2009. Case ascertainment is 90% or more complete, with a margin of error of +/−5% per the quality standards for these registries (www.cdc.gov/cancer/npcr/uscs/technical_notes/criteria.htm). Data from Mississippi, Tennessee, Virginia, and Washington, DC, were excluded from our study. The 47 registries included in the study covered 94.2% of the US population. All cases in this study were collected by NPCR and SEER programs by using medical records as the source of information for tumor and demographic characteristics.11,12
Case Definition
Cases were restricted to children (aged 0–14 years) and adolescents (aged 15–19 years) who were diagnosed with a primary neoplasm in the United States during 2001–2009. Diagnoses were grouped by histology and primary site according to the International Classification of Childhood Cancer (ICCC), third edition. The ICCC-3 applied the rules, nomenclature, and topographic, morphologic, and behavioral codes of the International Classification of Diseases for Oncology, Third Edition.13 Race was categorized as white, African American, American Indian/Alaskan Native, or Asian/Pacific Islander. We first analyzed ethnicity grouped by Hispanic or non-Hispanic, which was not mutually exclusive from race. We then analyzed the data by race and ethnicity by using the following groupings: non-Hispanic white, non-Hispanic black, and Hispanic. Results were not displayed for American Indian/Alaska Natives or Asian/Pacific Islanders because of small sample sizes.
Analyses
New cases in the ICCC-3 groups were presented by age, gender, race, ethnicity, and geography. We calculated rates with SEER*Stat Software, version 8.1.2 by using annual population estimates as our denominator (www.seer.cancer.gov/seerstat).14 All rates were expressed per million persons and were age-adjusted to the 2000 US standard population. Incidence trends were quantified by using annual percent change (APC). The APC and corresponding 95% confidence intervals (CIs) were calculated with SEER*Stat. The APC was calculated by fitting a straight line to the data, in which the dependent variable was the natural logarithm of the data, and calendar year was the independent variable. Statistical significance was determined if the 95% CI of APC did not include zero (P < .05). We compared childhood and adolescent cancer incidence rates and trends according to ICCC-3 group, subgroup, gender, age, race, ethnicity, and US Census region. Rates were not displayed if there were <16 cases total from 2001 to 2009. APC for the study interval was not calculated if there were <16 cases per year in any 1 calendar year, which is consistent with previous studies using SEER*Stat.5,6
RESULTS
During 2001–2009, there were 120 137 childhood and adolescent cancer cases diagnosed in the United States. Overall incidence rates and APC according to ICCC-3 group, subgroup, and gender are presented in Table 1. The overall age-adjusted cancer incidence rate was 171.01 per million persons, and boys had a higher childhood cancer rate than girls. Adolescents aged 15 to 19 years had a higher rate than children aged 0 to 14 years, white children had a higher rate than African American children, and the Northeast had the highest incidence rate among US regions (data not shown). Rates for leukemias were the highest, followed by rates for central nervous system (CNS) neoplasms, and then rates for lymphomas (45.36, 30.28, and 24.91 per 1 000 000 persons aged 0–19 years, respectively). Overall and age-specific cancer rates are presented in Fig 1. The overall cancer incidence rates were stable (APC, 0.3%; 95% CI, −0.1 to 0.7) from 2001 to 2009. Of all cancers and among all children and adolescents, thyroid carcinoma rates (APC, 4.9%; 95% CI, 3.2 to 6.6) and renal carcinoma rates (APC, 5.4%; 95% CI, 2.8 to 8.1) increased significantly, as did the group of unspecified intracranial and intraspinal neoplasms among the CNS tumors (APC, 4.4%; 95% CI, 0.1 to 8.9). Extracranial and extragonadal germ cell tumors (APC, −2.0%; 95% CI, −3.9 to −0.2) and malignant melanomas (APC, −3.8%; 95% CI, −6.7 to −0.9) were decreasing overall. Selected overall significant trends are presented in Fig 2.
TABLE 1.
Cancer Incidence Rates and APC of Rates in Children and Adolescents (Ages 0–19 Years) by Gender, United States, 2001–2009
| ICCC Group | Boys and Girls
|
Boys
|
Girls
|
|||||||
|---|---|---|---|---|---|---|---|---|---|---|
| Count | Ratea | APCb (95% CI) | Count | Ratea | APCb (95% CI) | Count | Ratea | APCb (95% CI) | ||
| All ICCC groups combined | 120 137 | 171.01 | 0.3 (−0.1 to 0.7) | 64 651 | 179.63 | 0.2 (−0.4 to 0.8) | 55 486 | 161.96 | 0.4 (−0.1 to 0.9) | |
| I Leukemias, myeloproliferative, myelodysplastic diseases | 31 824 | 45.36 | 0.5 (20.3 to 1.3) | 17 871 | 49.74 | 0.4 (−0.5 to 1.3) | 13 953 | 40.75 | 0.6 (−0.6 to 1.9) | |
| I(a) Lymphoid leukemias | 22 834 | 32.59 | 0.7 (−0.2 to 1.5) | 13 052 | 36.37 | 0.7 (−0.2 to 1.5) | 9782 | 28.60 | 0.7 (−0.6 to 1.9) | |
| I(b) Acute myeloid leukemias | 5542 | 7.88 | 0.2 (−1.4 to 0.9) | 2939 | 8.16 | −1.2 (−3.5 to 1.1) | 2603 | 7.58 | 0.9 (−0.3 to 2.1) | |
| I(c) Chronic myeloproliferative diseases | 1549 | 2.20 | 1.7 (−0.9 to 4.3) | 813 | 2.25 | 2.8 (−0.5 to 6.2) | 736 | 2.14 | 0.4 (−3.3 to 4.2) | |
| I(d) Myelodysplastic syndrome, other myeloproliferative | 1049 | 1.49 | 0.2 (−3.0 to 2.6) | 584 | 1.61 | −0.4 (−4.4 to 3.9) | 465 | 1.35 | 0.0 (−4.3 to 4.5) | |
| I(e) Unspecified and other specified leukemias | 850 | 1.21 | 0.1 (−3.8 to 4.1) | 483 | 1.34 | 0.6 (−4.2 to 5.6) | 367 | 1.07 | −0.7 (−5.1 to 4.0) | |
| II Lymphomas and reticuloendothelial neoplasms | 17 445 | 24.91 | 0.5 (−0.2 to 1.3) | 10 387 | 28.97 | 0.8 (−0.3 to 1.9) | 7058 | 20.64 | 0.1 (−0.9 to 1.2) | |
| II(a) Hodgkin’s lymphomas | 8780 | 12.50 | 0.5 (−0.3 to 1.3) | 4678 | 13.01 | 0.5 (−0.7 to 1.7) | 4102 | 11.98 | 0.5 (−1.1 to 2.0) | |
| II(b) Non-Hodgkin’s lymphomas (except Burkitt lymphoma) | 6047 | 8.66 | 0.7 (−0.5 to 1.8) | 3821 | 10.67 | 1.3 (0.0 to 2.5) | 2226 | 6.53 | −0.4 (−1.3 to 0.6) | |
| II(c) Burkitt lymphoma | 1712 | 2.47 | −0.1 (−2.7 to 2.7) | 1359 | 3.83 | 0.0 (−2.9 to 2.9) | 353 | 1.04 | 0.1 (−4.7 to 5.1) | |
| II(d) Miscellaneous lymphoreticular neoplasms | 663 | 0.93 | 1.2 (−4.0 to 6.6) | 392 | 1.08 | 2.4 (−4.0 to 9.2) | 271 | 0.78 | −0.3 (−6.3 to 6.1) | |
| II(e) Unspecified lymphomas | 243 | 0.35 | 0.4 (−5.7 to 6.8) | 137 | 0.38 | — | 106 | 0.31 | — | |
| III CNS and miscellaneous intracranial and intraspinal neoplasms | 21 135 | 30.28 | −0.1 (−1.0 to 0.8) | 11 377 | 31.84 | −0.3 (−1.4 to 0.9) | 9758 | 28.65 | 0.1 (−1.1 to 1.4) | |
| III(a) Ependymomas and choroid plexus tumor | 1800 | 2.56 | −1.5 (−4.5 to 1.7) | 986 | 2.74 | 0.0 (−3.4 to 3.5) | 814 | 2.37 | −3.2 (−7.1 to 0.8) | |
| III(b) Astrocytomas | 10 533 | 15.10 | −0.1 (−1.2 to 0.9) | 5529 | 15.48 | −0.4 (−1.6 to 0.9) | 5004 | 14.71 | 0.1 (−1.6 to 1.8) | |
| III(c) Intracranial and intraspinal embryonal tumors | 4364 | 6.24 | −0.6 (−1.9 to 0.8) | 2591 | 7.25 | −1.1 (−2.0 to −0.1)c | 1773 | 5.18 | 0.2 (−2.1 to 2.5) | |
| III(d) Other gliomas | 3653 | 5.26 | 0.9 (−0.6 to 2.4) | 1856 | 5.22 | 0.3 (−1.4 to 1.9) | 1797 | 5.30 | 1.6 (−0.6 to 3.8) | |
| III(e) Other specified intracranial/intraspinal neoplasms | 462 | 0.66 | −1.2 (−4.9 to 2.7) | 246 | 0.69 | −1.0 (−5.4 to 3.6) | 216 | 0.63 | −1.4 (−6.5 to 4.0) | |
| III(f) Unspecified intracranial and intraspinal neoplasms | 323 | 0.46 | 4.4 (0.1 to 8.9)c | 169 | 0.47 | — | 154 | 0.45 | — | |
| IV Neuroblastoma, other peripheral nervous cell tumors | 5870 | 8.21 | −1.2 (−3.0 to 0.8) | 3121 | 8.53 | −0.5 (−2.9 to 2.0) | 2749 | 7.87 | −2.0 (−4.0 to 0.1) | |
| IV(a) Neuroblastoma and ganglioneuroblastoma | 5726 | 8.00 | −1.2 (−3.1 to 0.6) | 3043 | 8.31 | −0.5 (−3.0 to 1.9) | 2683 | 7.68 | −2.1 (−4.1 to 0.0)c | |
| IV(b) Other peripheral nervous cell tumors | 144 | 0.20 | — | 78 | 0.22 | — | 66 | 0.19 | — | |
| V Retinoblastoma | 2169 | 3.01 | −0.2 (−1.8 to 1.5) | 1100 | 2.99 | −1.6 (−3.6 to 0.3) | 1069 | 3.03 | 1.4 (−1.1 to 3.9) | |
| VI Renal tumors | 4697 | 6.64 | 0.5 (−0.3 to 1.3) | 2228 | 6.15 | 0.0 (−1.5 to 1.5) | 2469 | 7.15 | 1.1 (−1.3 to 3.2) | |
| VI(a) Nephroblastoma, other nonepithelial renal tumors | 4248 | 6.00 | 0.0 (−0.7 to 0.8) | 2006 | 5.53 | −0.4 (−1.9 to 1.1) | 2242 | 6.49 | 0.4 (−1.7 to 2.5) | |
| VI(b) Renal carcinomas | 426 | 0.61 | 5.4 (2.8 to 8.1)c | 210 | 0.59 | 4.2 (1.4 to 7.0)c | 216 | 0.63 | — | |
| VI(c) Unspecified malignant renal tumors | 23 | 0.03 | — | — | — | — | — | — | — | |
| VII Hepatic tumors | 1477 | 2.07 | 1.7 (−1.7 to 5.3) | 874 | 2.40 | 2.8 (−1.4 to 7.2) | 603 | 1.73 | 0.1 (−4.1 to 4.4) | |
| VII(a) Hepatoblastoma | 1050 | 1.46 | 1.6 (−2.2 to 5.6) | 634 | 1.73 | 2.4 (−1.9 to 6.8) | 416 | 1.18 | 0.3 (−4.8 to 5.7) | |
| VII(b) Hepatic carcinomas | 411 | 0.59 | 2.1 (−0.7 to 4.9) | 229 | 0.64 | 3.8 (−0.7 to 8.5) | 182 | 0.53 | 0.2 (−3.8 to 4.4) | |
| VII(c) Unspecified malignant hepatic tumors | 16 | 0.02 | — | — | — | — | — | — | — | |
| VIII Malignant bone tumors | 6285 | 9.02 | −0.6 (−1.3 to 0.2) | 3582 | 10.00 | −0.5 (−2.1 to 1.1) | 2703 | 7.98 | −0.7 (−1.8 to 0.5) | |
| VIII(a) Osteosarcomas | 3546 | 5.09 | −0.4 (−1.7 to 1.0) | 2016 | 5.63 | −0.9 (−2.7 to 0.9) | 1530 | 4.52 | 0.3 (−2.3 to 3.1) | |
| VIII(b) Chondrosarcomas | 248 | 0.35 | −3.1 (−11.1 to 5.6) | 158 | 0.44 | — | 90 | 0.26 | — | |
| VIII(c) Ewing tumor and related sarcomas of bone | 2054 | 2.95 | −1.0 (−3.2 to 1.4) | 1185 | 3.31 | −0.3 (−4.0 to 3.7) | 869 | 2.56 | −1.9 (−3.8 to 0.0)c | |
| VIII(d) Other specified malignant bone tumors | 300 | 0.43 | −1.3 (−6.8 to 4.5) | 146 | 0.41 | — | 154 | 0.45 | — | |
| VIII(e) Unspecified malignant bone tumors | 137 | 0.20 | — | 77 | 0.21 | — | 60 | 0.18 | — | |
| IX Soft tissue and other extraosseous sarcomas | 8419 | 12.01 | 0.3 (−0.4 to 1.0) | 4620 | 12.86 | 0.0 (−1.0 to 1.1) | 3799 | 11.12 | 0.6 (−1.1 to 2.4) | |
| IX(a) Rhabdomyosarcomas | 3299 | 4.71 | −0.7 (−3.0 to 1.7) | 1942 | 5.42 | −1.1 (−3.0 to 1.0) | 1357 | 3.97 | −0.1 (−4.2 to 4.2) | |
| IX(b) Fibrosarcomas, peripheral nerve, other fibrous | 940 | 1.33 | −0.7 (−3.8 to 2.6) | 495 | 1.37 | −2.3 (−5.6 to 1.0) | 445 | 1.30 | 1.2 (−3.5 to 6.2) | |
| IX(c) Kaposi sarcoma | 26 | 0.04 | — | 20 | 0.06 | — | — | — | — | |
| IX(d) Other specified soft tissue sarcomas | 3304 | 4.71 | 0.9 (−1.0 to 2.9) | 1725 | 4.80 | 1.5 (−1.4 to 4.5) | 1579 | 4.63 | 0.3 (−2.3 to 3.0) | |
| IX(e) Unspecified soft tissue sarcomas | 850 | 1.21 | 2.8 (−0.4 to 6.2) | 438 | 1.22 | 1.0 (−4.4 to 6.7) | 412 | 1.21 | 5.1 (−0.6 to 11.0) | |
| X Germ cell, trophoblastic tumors, neoplasms of gonads | 7814 | 11.05 | 0.7 (−0.5 to 2.0) | 4968 | 13.65 | 1.1 (−0.7 to 2.6) | 2846 | 8.30 | 0.5 (−1.3 to 2.2) | |
| X(a) Intracranial and intraspinal germ cell tumors | 1133 | 1.62 | 0.8 (−1.6 to 3.2) | 831 | 2.32 | −1.7 (−1.3 to 4.8) | 302 | 0.89 | −1.3 (−7.3 to 5.0) | |
| X(b) Extracranial and extragonadal germ cell tumors | 1046 | 1.46 | −2.0 (−3.9 to −0.2)c | 457 | 1.25 | 1.7 (−3.8 to 0.4) | 589 | 1.68 | −2.3 (−4.5 to −0.1)c | |
| X(c) Malignant gonadal germ cell tumors | 5142 | 7.27 | 1.1 (−0.6 to 2.9) | 3618 | 9.91 | 1.0 (−1.1 to 3.2) | 1524 | 4.48 | 1.5 (−0.5 to 3.5) | |
| X(d) Gonadal carcinomas | 281 | 0.40 | 5.3 (−0.5 to 11.4) | 24 | 0.07 | — | 257 | 0.75 | 5.9 (−0.3 to 12.4) | |
| X(e) Other and unspecified malignant gonadal tumors | 212 | 0.30 | — | 38 | 0.11 | — | 174 | 0.51 | — | |
| XI Other malignant epithelial neoplasms and melanomas | 12 428 | 17.64 | 0.8 (0.1 to 1.5)c | 4277 | 11.85 | −0.1 (−1.6 to 1.4) | 8151 | 23.77 | 1.3 (0.4 to 2.2)c | |
| XI(a) Adrenocortical carcinomas | 151 | 0.21 | — | 55 | 0.15 | — | 96 | 0.28 | — | |
| XI(b) Thyroid carcinomas | 4812 | 6.83 | 4.9 (3.2 to 6.6)c | 934 | 2.59 | 4.7 (0.9 to 8.7)c | 3878 | 11.31 | 4.9 (3.2 to 6.5)c | |
| XI(c) Nasopharyngeal carcinomas | 412 | 0.59 | 0.0 (−4.8 to 5.1) | 275 | 0.76 | 2.7 (−3.0 to 8.7) | 137 | 0.40 | — | |
| XI(d) Malignant melanomas | 4047 | 5.74 | −3.8 (−6.7 to −0.9)c | 1699 | 4.70 | −5.3 (−8.4 to −2.1)c | 2348 | 6.84 | −2.8 (−6.4 to 1.1) | |
| XI(e) Skin carcinomas | 58 | 0.08 | — | 28 | 0.08 | — | 30 | 0.09 | — | |
| XI(f) Other and unspecified carcinomas | 2948 | 4.19 | 1.1 (−0.1 to 2.3) | 1286 | 3.56 | 2.4 (0.2 to 4.6)c | 1662 | 4.86 | 0.1 (−2.2 to 2.4) | |
| XII Other and unspecified malignant neoplasms | 574 | 0.81 | 0.6 (−2.9 to 4.3) | 246 | 0.68 | 3.8 (0.4 to 7.3)c | 328 | 0.95 | −1.6 (−6.7 to 3.9) | |
Rates are per million and were age-adjusted to the 2000 US standard population (19 age groups, Census P25–1130) standard. Rate statistics were not displayed if case count was <16 cases.
APCs were calculated by using weighted least squares method. Statistical significance was determined if the 95% CI of APC did not include zero (P < .05). APC was not calculated if case count was <16 cases in any 1 year. Some significant values appear to include zero because APC was rounded to the nearest 10th.
Denotes significant APC.
FIGURE 1.
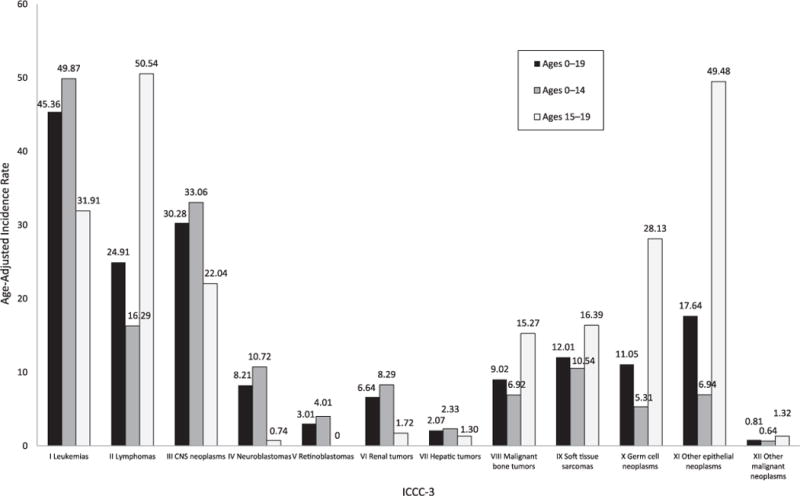
Cancer incidence rates per million in the United States, 2001–2009. Age-adjusted incidence of pediatric cancers stratified by age group. Rates are per million and were age-adjusted to the 2000 US standard population (19 age groups, Census P25–1130) standard. Data are from population-based cancer registries that participate in the NPCR or the SEER program. Data include malignant tumors only and cover 94.2% of the US population. The ICCC-3 is displayed by abbreviated title.
FIGURE 2.
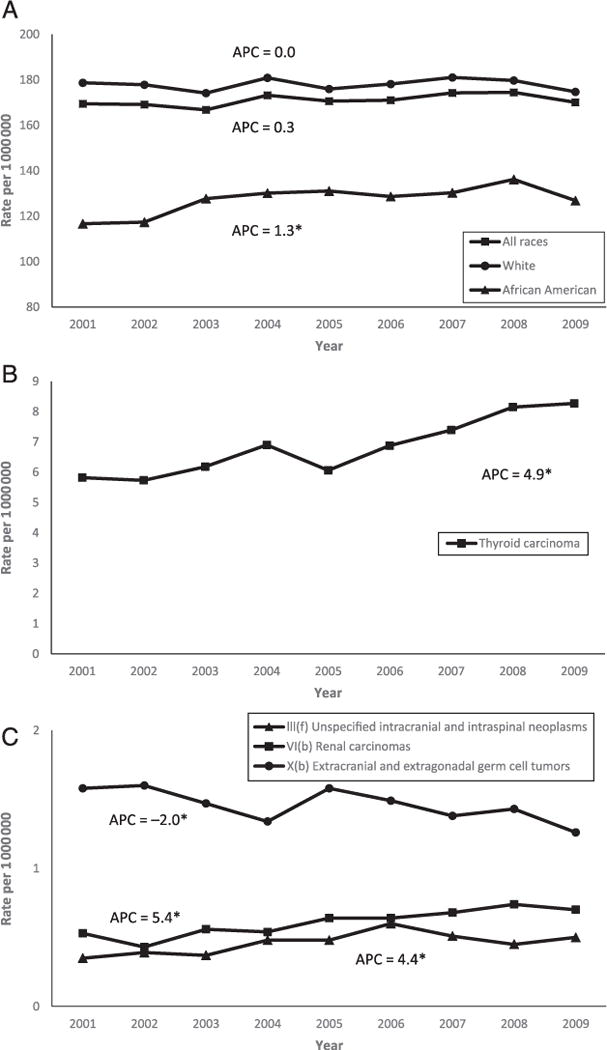
Cancer rates and APC in children and adolescents (ages 0–19 years) in the United States, 2001–2009. A, Overall rates and APC by race. B, Overall thyroid carcinoma rates and APC. C, Overall rates and APC of unspecified intracranial and intraspinal neoplasms, renal carcinomas, and extracranial and extragonadal germ cell tumors. Rates are per million and were age-adjusted to the 2000 US standard population (19 age groups, Census P25–1130) standard. Data are from population-based cancer registries that participate in the NPCR or the SEER program. Data include malignant tumors only and cover 94.2% of the US population. *Denotes significant APC. APCs were calculated by using weighted least squares method. Statistical significance was determined if the 95% CI of APC did not include zero (P < .05).
Rates of renal carcinomas, thyroid carcinomas, other unspecified epithelial carcinomas, and other unspecified malignant neoplasms increased significantly for boys, and the trend for thyroid carcinomas increased significantly for girls (Table 1). Rates of intracranial and intraspinal embryonal tumors and malignant melanomas decreased significantly among boys. Among girls, the rates of neuroblastoma, Ewing tumor and related sarcomas, and extracranial and extragonadal germ cell tumors were all significantly decreasing.
Age-specific trend analyses (data not shown) revealed that rates for cancers in the malignant gonadal germ cell tumors group increased among children aged 0 to 14 years (APC, 1.9%; 95% CI, 0.2 to 3.6). Among adolescents aged 15 to 19 years, the rates for renal tumors (APC, 6.2%; 95% CI, 1.3 to 11.4), thyroid carcinomas (APC, 5.7%; 95% CI, 3.7 to 7.7), and unspecified epithelial carcinomas (APC, 1.2%; 95% CI, 0.3 to 2.1) increased, whereas the rates for intracranial and intraspinal embryonal tumors (APC, −5.9%; 95% CI, −9.5 to −2.2) and malignant melanoma (APC, −5.1%; 95% CI, −8.1 to −2.0) decreased.
Trends by race and ethnicity are displayed in Table 2 and reveal a significant increase in the overall cancer rates for African American children and adolescents (APC, 1.3%; 95% CI, 0.2 to 2.5). The significant increases in African Americans held for children of the 0- to 14- year age group (APC, 1.3%; 95% CI, 0.1 to 2.5) but not the 15- to 19-year age group (APC, 1.4%; 95% CI, −0.1 to 2.9). Among African American children and adolescents, we found a significant increase in the rates for Hodgkin’s lymphoma, renal tumors (specifically the nephroblastoma and other nonepithelial renal tumors group), and thyroid carcinomas. Among white children and adolescents, there was a significant increase in unspecified intracranial and intraspinal neoplasms and in thyroid carcinoma and a significant decrease in malignant melanoma. Among non-Hispanic children and adolescents, we found significantly increasing trends of lymphomas and reticuloendothelial neoplasms, other gliomas, renal carcinomas, and unspecified epithelial carcinomas and decreasing trends of bone tumors and malignant melanomas. In the Hispanic group, there were significantly increasing trends of leukemias and decreasing trends in the fibrosarcomas and the extracranial and extragonadal germ cell tumors groups. Regardless of ethnicity, rates of thyroid carcinoma significantly increased. For rates by race and ethnicity (non-Hispanic white children and non-Hispanic black children compared with the above analysis), findings were similar overall (Supplemental Table 3).
TABLE 2.
Cancer Incidence Rates and APC of Rates in Children and Adolescents (Ages 0–19 Years) by Race or Ethnicity, United States, 2001–2009
| ICCC Group | White
|
African American
|
Non-Hispanic
|
Hispanic
|
||||||||
|---|---|---|---|---|---|---|---|---|---|---|---|---|
| Count | Ratea | APCb (95% CI) | Count | Ratea | APCb (95% CI) | Count | Ratea | APCb (95% CI) | Count | Ratea | APCb (95% CI) | |
| All ICCC groups combined | 97 765 | 177.91 | 0.0 (−0.5 to 0.5) | 13 779 | 127.29 | 1.3 (0.2 to 2.5)c | 95716 | 171.66 | 0.3 (−0.2 to 0.7) | 24 421 | 168.94 | 0.6 (0.0 to 1.3) |
| I Leukemias, myeloproliferative, myelodysplastic diseases | 26 283 | 47.94 | 0.3 (−0.6 to 1.2) | 3022 | 27.97 | 1.2 (−0.3 to 2.7) | 23 391 | 42.49 | 0.0 (−0.7 to 0.8) | 8433 | 56.62 | 1.3 (0.1 to 2.6)c |
| I(a) Lymphoid leukemias | 19 252 | 35.16 | 0.4 (−0.5 to 1.3) | 1820 | 16.89 | 1.9 (0.0 to 3.9) | 16 508 | 30.15 | 0.1 (−0.8 to 1.1) | 6326 | 42.25 | 1.6 (0.1 to 3.1)c |
| I(b) Acute myeloid leukemias | 4331 | 7.87 | −0.4 (−1.6 to 0.8) | 770 | 7.10 | −0.4 (−5.2 to 4.7) | 4270 | 7.67 | −0.5 (−2.0 to 1.1) | 1272 | 8.72 | 0.2 (−1.7 to 2.1) |
| I(c) Chronic myeloproliferative diseases | 1197 | 2.17 | 1.6 (−1.8 to 5.1) | 212 | 1.95 | 1.5 (−3.8 to 7.1) | 1189 | 2.10 | 1.4 (−0.3 to 3.0) | 360 | 2.51 | 1.9 (−4.7 to 9.0) |
| I(d) Myelodysplastic syndrome, other myeloproliferative | 826 | 1.50 | −0.6 (−5.2 to 4.2) | 125 | 1.15 | — | 821 | 1.48 | 0.3 (−3.0 to 3.7) | 228 | 1.49 | −2.0 (−6.5 to 2.8) |
| I(e) Unspecified and other specified leukemias | 677 | 1.23 | 0.8 (−3.2 to 4.9) | 95 | 0.88 | — | 603 | 1.09 | −1.4 (−5.5 to 2.9) | 247 | 1.65 | 3.0 (−2.5 to 8.8) |
| II Lymphomas and reticuloendothelial neoplasms | 14015 | 25.53 | 0.1 (−0.6 to 0.8) | 2306 | 21.30 | 2.0 (−0.5 to 4.5) | 14 425 | 25.45 | 0.9 (0.6 to 1.7)c | 3020 | 22.23 | −0.9 (−1.9 to 0.2) |
| II(a) Hodgkin’s lymphomas | 7256 | 13.17 | 0.1 (−0.7 to 1.0) | 1067 | 9.84 | 2.9 (0.2 to 5.7)c | 7360 | 12.83 | 0.7 (−0.1 to 1.5) | 1420 | 10.83 | −0.2 (−2.5 to 2.1) |
| II(b) Non-Hodgkin’s lymphomas (except Burkitt lymphoma) | 4610 | 8.42 | 0.2 (−0.7 to 1.0) | 974 | 9.00 | 0.6 (−2.9 to 4.2) | 4958 | 8.81 | 0.9 (−0.4 to 2.2) | 1089 | 7.99 | −0.2 (−3.0 to 2.6) |
| II(c) Burkitt lymphoma | 1437 | 2.65 | −1.0 (−4.4 to 2.6) | 169 | 1.57 | — | 1460 | 2.64 | 1.2 (−1.4 to 3.7) | 252 | 1.77 | −5.6 (−13.1 to 2.6) |
| II(d) Miscellaneous lymphoreticular neoplasms | 532 | 0.96 | 2.1 (−3.7 to 8.1) | 54 | 0.49 | — | 461 | 0.84 | 3.6 (−0.7 to 8.1) | 202 | 1.22 | — |
| II(e) Unspecified lymphomas | 180 | 0.33 | — | 42 | 0.39 | — | 186 | 0.33 | — | 57 | 0.41 | — |
| III CNS and miscellaneous intracranial and intraspinal neoplasms | 17 322 | 31.76 | −0.5 (−1.6 to 0.7) | 2458 | 22.86 | 1.2 (−1.0 to 3.4) | 17416 | 31.63 | 0.3 (−0.7 to 1.2) | 3719 | 25.22 | −1.0 (−2.6 to 0.6) |
| III(a) Ependymomas and choroid plexus tumor | 1471 | 2.68 | −1.8 (−4.8 to 1.3) | 213 | 1.97 | −1.6 (−9.6 to 7.1) | 1393 | 2.53 | −1.2 (−4.3 to 2.0) | 407 | 2.68 | −2.3 (−6.5 to 2.2) |
| III(b) Astrocytomas | 8716 | 15.99 | −0.6 (−1.8 to 0.7) | 1163 | 10.81 | 2.3 (−1.5 to 6.4) | 8860 | 16.06 | 0.2 (−1.1 to 1.4) | 1673 | 11.53 | −0.5 (−2.9 to 1.9) |
| III(c) Intracranial and intraspinal embryonal tumors | 3636 | 6.66 | −0.8 (−2.5 to 1.0) | 446 | 4.14 | −0.6 (−3.0 to 1.9) | 3489 | 6.38 | −0.1 (−1.7 to 1.5) | 875 | 5.76 | −2.1 (−5.2 to 1.1) |
| III(d) Other gliomas | 2940 | 5.41 | 0.6 (−1.4 to 2.6) | 462 | 4.32 | 1.7 (−2.1 to 5.6) | 3025 | 5.49 | 1.5 (0.1 to 2.9)c | 628 | 4.32 | −1.4 (−6.5 to 4.0) |
| III(e) Other specified intracranial/intraspinal neoplasms | 316 | 0.58 | −2.4 (−7.0 to 2.5) | 120 | 1.12 | — | 389 | 0.70 | −1.8 (−6.1 to 2.8) | 73 | 0.50 | — |
| III(f) Unspecified intracranial and intraspinal neoplasms | 243 | 0.44 | 5.9 (0.2 to 12.0)c | 54 | 0.50 | — | 260 | 0.47 | 3.7 (−2.2 to 10.0) | 63 | 0.43 | — |
| IV Neuroblastoma, other peripheral nervous cell tumors | 4739 | 8.50 | −1.5 (−3.4 to 0.5) | 756 | 6.93 | 0.7 (−3.4 to 5.0) | 4950 | 9.08 | −0.6 (−2.4 to 1.4) | 920 | 5.40 | −2.3 (−5.9 to 1.4) |
| IV(a) Neuroblastoma and ganglioneuroblastoma | 4627 | 8.30 | −1.6 (−3.5 to 0.3) | 734 | 6.73 | 0.7 (−3.3 to 4.9) | 4833 | 8.88 | −0.6 (−2.4 to 1.3) | 893 | 5.21 | −2.9 (−6.5 to 0.9) |
| IV(b) Other peripheral nervous cell tumors | 112 | 0.20 | — | 22 | 0.20 | — | 117 | 0.21 | — | 27 | 0.19 | — |
| V Retinoblastoma | 1587 | 2.83 | −0.2 (−2.5 to 2.2) | 379 | 3.43 | −0.3 (−2.9 to 2.3) | 1569 | 2.88 | −0.1 (−1.2 to 1.1) | 600 | 3.43 | −0.7 (−5.1 to 3.9) |
| VI Renal tumors | 3537 | 6.41 | −0.4 (−1.2 to 0.4) | 855 | 7.92 | 2.5 (1.6 to 3.5)c | 3872 | 7.11 | 0.8 (−0.4 to 2.0) | 825 | 5.05 | 0.5 (−3.0 to 4.0) |
| VI(a) Nephroblastoma, other nonepithelial renal tumors | 3252 | 5.89 | −0.7 (−1.5 to 0.0) | 726 | 6.73 | 2.3 (0.6 to 3.6)c | 3485 | 6.42 | 0.3 (−0.8 to 1.5) | 763 | 4.58 | −1.0 (−3.6 to 3.6) |
| VI(b) Renal carcinomas | 267 | 0.49 | 3.8 (−2.2 to 10.2) | 125 | 1.15 | — | 367 | 0.65 | 5.8 (3.3 to 8.4)c | 59 | 0.45 | — |
| VI(c) Unspecified malignant renal tumors | 18 | 0.03 | — | — | — | — | 20 | 0.04 | — | — | — | — |
| VII Hepatic tumors | 1162 | 2.09 | 1.5 (−2.5 to 5.6) | 156 | 1.43 | — | 1114 | 2.02 | 1.3 (−1.2 to 3.9) | 363 | 2.25 | 3.5 (−5.6 to 13.4) |
| VII(a) Hepatoblastoma | 842 | 1.51 | 1.2 (−3.0 to 5.5) | 100 | 0.91 | — | 776 | 1.42 | 1.3 (−1.9 to 4.5) | 274 | 1.59 | 3.1 (−6.5 to 13.7) |
| VII(b) Hepatic carcinomas | 308 | 0.56 | 2.6 (−2.4 to 8.0) | 55 | 0.51 | — | 324 | 0.57 | 1.3 (−2.6 to 5.2) | 87 | 0.65 | — |
| VII(c) Unspecified malignant hepatic tumors | — | — | — | — | — | — | — | — | — | — | — | — |
| VIII Malignant bone tumors | 5085 | 9.32 | −0.7 (−1.8 to 0.3) | 781 | 7.22 | −0.8 (−4.9 to 3.5) | 5030 | 8.91 | −0.9 (−1.7 to 0.0)c | 1255 | 9.49 | 0.5 (−1.7 to 2.7) |
| VIII(a) Osteosarcomas | 2670 | 4.89 | −0.4 (−1.8 to 1.1) | 622 | 5.75 | −0.7 (−5.6 to 4.4) | 2776 | 4.91 | −0.8 (−2.2 to 0.6) | 770 | 5.87 | 0.8 (−1.7 to 3.3) |
| VIII(b) Chondrosarcomas | 206 | 0.37 | — | 25 | 0.23 | — | 210 | 0.37 | — | 38 | 0.29 | — |
| VIII(c) Ewing tumor and related sarcomas of bone | 1874 | 3.44 | −1.1 (−3.1 to 0.9) | 70 | 0.65 | — | 1705 | 3.03 | −1.2 (−3.8 to 1.5) | 349 | 2.60 | 0.7 (−3.2 to 4.7) |
| VIII(d) Other specified malignant bone tumors | 233 | 0.43 | −2.8 (−8.8 to 3.7) | 40 | 0.37 | — | 240 | 0.42 | −0.2 (−5.7 to 5.8) | 60 | 0.45 | — |
| VIII(e) Unspecified malignant bone tumors | 102 | 0.19 | — | 24 | 0.22 | — | 99 | 0.18 | — | 38 | 0.28 | — |
| IX Soft tissue and other extraosseous sarcomas | 6543 | 11.93 | −0.1 (−0.8 to 0.7) | 1359 | 12.55 | 1.4 (−0.4 to 3.1) | 6791 | 12.15 | 0.5 (−0.4 to 1.5) | 1628 | 11.49 | −0.2 (−2.2 to 1.8) |
| IX(a) Rhabdomyosarcomas | 2599 | 4.75 | −1.7 (−3.7 to 0.3) | 526 | 4.88 | 2.8 (−1.7 to 7.6) | 2645 | 4.79 | −0.8 (−3.5 to 1.9) | 654 | 4.42 | 0.2 (−4.7 to 5.4) |
| IX(b) Fibrosarcomas, peripheral nerve, other fibrous | 736 | 1.34 | 0.1 (−3.0 to 3.3) | 159 | 1.46 | — | 742 | 1.32 | 1.0 (−2.6 to 4.7) | 198 | 1.40 | −6.7 (−10.9 to −2.3)c |
| IX(c) Kaposi sarcoma | — | — | — | — | — | — | 22 | 0.04 | — | — | — | — |
| IX(d) Other specified soft tissue sarcomas | 2553 | 4.65 | 0.8 (−1.4 to 3.0) | 520 | 4.79 | 1.1 (−2.2 to 4.6) | 2688 | 4.76 | 1.1 (−0.9 to 3.0) | 616 | 4.53 | 0.6 (−2.3 to 3.7) |
| IX(e) Unspecified soft tissue sarcomas | 644 | 1.17 | 3.2 (−0.5 to 7.0) | 142 | 1.31 | — | 694 | 1.23 | 3.1 (−0.5 to 6.7) | 156 | 1.11 | — |
| X Germ cell, trophoblastic tumors, neoplasms of gonads | 6546 | 11.81 | 0.6 (−1.0 to 2.2) | 662 | 6.07 | 1.4 (−0.2 to 3.1) | 5914 | 10.35 | 0.3 (−1.0 to 1.6) | 1900 | 14.26 | 1.6 (−0.6 to 3.8) |
| X(a) Intracranial and intraspinal germ cell tumors | 900 | 1.65 | 0.5 (−2.7 to 3.7) | 100 | 0.92 | — | 890 | 1.58 | 1.1 (−1.9 to 4.2) | 243 | 1.81 | −0.3 (−4.8 to 4.4) |
| X(b) Extracranial and extragonadal germ cell tumors | 784 | 1.40 | −1.8 (−4.4 to 0.7) | 152 | 1.38 | — | 800 | 1.44 | −1.3 (−3.9 to 1.4) | 246 | 1.66 | −4.5 (−7.8 to −1.2)c |
| X(c) Malignant gonadal germ cell tumors | 4468 | 8.05 | 1.0 (−0.9 to 2.8) | 349 | 3.21 | 3.5 (−0.3 to 8.0) | 3838 | 6.66 | 0.4 (−1.3 to 2.2) | 1304 | 9.96 | 2.5 (−0.7 to 5.8) |
| X(d) Gonadal carcinomas | 235 | 0.42 | 4.0 (−1.8 to 10.1) | 18 | 0.17 | — | 216 | 0.37 | 3.6 (−1.8 to 9.2) | 65 | 0.51 | — |
| X(e) Other and unspecified malignant gonadal tumors | 159 | 0.29 | — | 43 | 0.39 | — | 170 | 0.30 | — | 42 | 0.32 | — |
| XI Other malignant epithelial neoplasms and melanomas | 10511 | 19.02 | 0.7 (−0.3 to 1.7) | 960 | 8.83 | 1.4 (−2.8 to 5.9) | 10 789 | 18.77 | 0.4 (−0.5 to 1.3) | 1639 | 12.67 | 4.9 (2.7 to 7.1)c |
| XI(a) Adrenocortical carcinomas | 130 | 0.24 | — | — | — | — | 121 | 0.22 | — | 30 | 0.20 | — |
| XI(b) Thyroid carcinomas | 4182 | 7.57 | 4.9 (2.9 to 6.9)c | 255 | 2.35 | 6.6 (0.7 to 12.8)c | 3974 | 6.89 | 4.1 (2.3 to 5.9)c | 838 | 6.53 | 9.1 (5.4 to 12.8)c |
| XI(c) Nasopharyngeal carcinomas | 194 | 0.35 | 2.0 (−1.5 to 5.6) | 180 | 1.65 | — | 351 | 0.61 | −0.8 (−6.4 to 5.1) | 61 | 0.48 | — |
| XI(d) Malignant melanomas | 3694 | 6.68 | −3.9 (−6.8 to −0.9)c | 54 | 0.50 | — | 3829 | 6.66 | −3.5 (−6.3 to −0.6)c | 218 | 1.64 | −2.0 (−5.7 to 1.0) |
| XI(e) Skin carcinomas | 44 | 0.08 | — | — | — | — | 51 | 0.09 | — | — | — | — |
| XI(f) Other and unspecified carcinomas | 2267 | 4.11 | 1.0 (−0.6 to 2.6) | 455 | 4.18 | −0.5 (−4.3 to 3.5) | 2463 | 4.29 | 1.2 (0.0 to 2.4)c | 485 | 3.78 | 1.1 (−1.9 to 4.1) |
| XII Other and unspecified malignant neoplasms | 435 | 0.79 | −1.0 (−3.7 to 1.8) | 85 | 0.78 | — | 455 | 0.81 | 0.4 (−4.3 to 5.2) | 119 | 0.83 | — |
Rates are per million and were age-adjusted to the 2000 US standard population (19 age groups, Census P25–1130) standard. Rate statistics were not displayed if case count was <16 cases.
APCs were calculated by using weighted least squares method. Statistical significance was determined if the 95% CI of APC did not include zero (P < .05). APC was not calculated if case count was <16 cases in any 1 year. Some significant values appear to include zero because APC was rounded to the nearest 10th.
Denotes significant APC.
Figure 3 reveals all significant cancer trends stratified by US Census region. Thyroid carcinomas were increasing in all regions except the Midwest region, with APCs ranging from 4.3% to 6.6%. There were decreased rates of acute myeloid leukemia, Ewing tumor, and malignant melanoma in the Northeast. In the Midwest, there was an increase in rates for lymphomas and reticuloendothelial neoplasms, other gliomas, and intracranial and intraspinal germ cell tumors. In the South, there was an increase in the rates for chronic myeloproliferative diseases, unspecified soft tissue sarcomas, and other malignant epithelial neoplasms and melanomas. In the West, there was a rate decrease in intracranial and intraspinal germ cell tumors and also in malignant melanomas. Regional trends subdivided by race are displayed in Supplemental Table 4, and is significant for increasing rates for overall cancers in African Americans in the South and increasing rates overall in Hispanics in the West.
FIGURE 3.
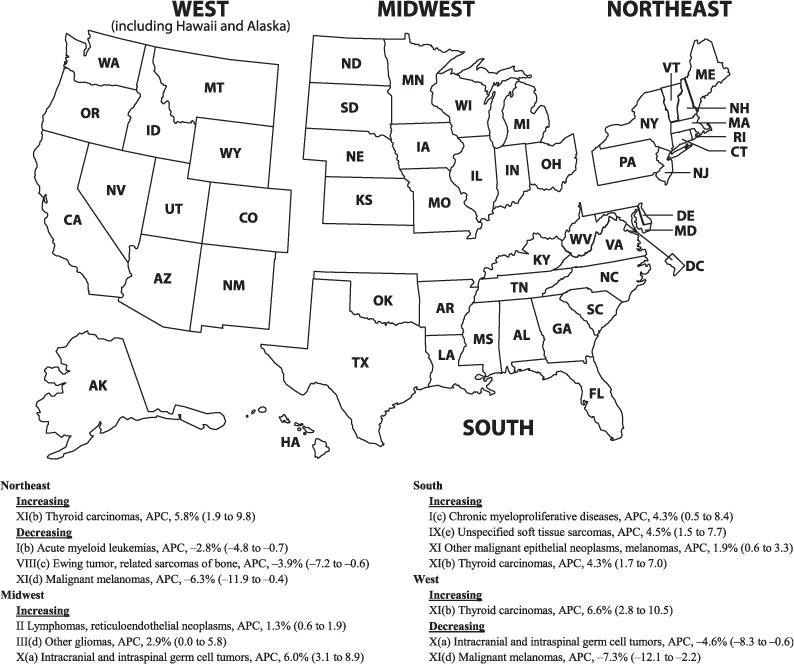
Significant APC of cancer rates in children and adolescents (ages 0–19 years) by ICCC-3 code displayed by US Census region, 2001–2009. Data are from population-based cancer registries that participate in the NPCR or the SEER program. Data include malignant tumors only and cover 94.2% of the US population. APCs were calculated by using weighted least squares method. Statistical significance was determined if the 95% CI of APC did not include zero (P < .05). APCs are expressed with 95% CIs. Some significant values appear to include zero because APC was rounded to the nearest 10th.
DISCUSSION
Specific Findings
Our study revealed that overall incidence rates of pediatric cancer have increased among African American children and adolescents, which has been previously documented.4,15 Previous reports have commented on decreased pediatric cancer survival among minorities, including African American children and adolescents, and suggested this could be caused by differences in drug metabolism, delayed detection, tumor characteristics, or barriers associated with socioeconomic status.16–18 Given that no increases in race-combined cancer incidence rates were observed for the entire pediatric population, further investigation is needed to better understand the underlying causes for this increase and better guide the development of preventive measures among African Americans.
Increased rates of thyroid cancers were found among the overall pediatric population in most geographic regions, in both genders, in adolescents aged 15 to 19 years, and among white, African American, Hispanic, and non-Hispanic populations. Holmes et al7 previously reported increased pediatric thyroid cancer incidence rates during 1973–2007 among girls and adolescents aged 15 to 19 years, but that report only included 11% population coverage. Previous studies also have revealed increased rates of thyroid cancers among adults of both genders.19–21 It is unclear if this increase in pediatric thyroid cancer is caused by the same forces that are driving the increase in adult thyroid cancer. There is evidence that exposure to radiation by computed tomography scans or dental radiographs may be associated with thyroid cancer, although many studies looking at radiographs and cancer were unable to find a significant association.22–26 Previous studies have suggested obesity as a possible cause for the increase in adult thyroid cancers.27,28 As both thyroid cancer rates and obesity prevalence increase among the pediatric population, further research is needed to investigate an association between these 2 variables.29 Other potential causes of an increase in thyroid cancer rates include environmental exposures, such as exposures to perchlorate or polybrominated diphenyl ethers.30,31 Reproductive or hormonal factors have been inconsistently associated with thyroid cancer in the literature, but this potential cause may explain why girls are more affected than boys.7,19,32 Alternatively, some studies suggest that increasing incidence could reflect enhanced detection through improved diagnostic tests, although other studies disagree.21,33
Our study is consistent with previous reports that girls, people in their 20s, and African Americans have higher incidence rates of renal carcinoma.34,35 There are few studies about the epidemiology of pediatric renal carcinomas because of their rarity, making our finding of increased renal carcinoma rates among boys and those aged 15 to 19 years a novel finding.6,34,36 Renal cancers are known to be increasing among both male and female adults.6,37 Recent research has suggested that the increase of renal cancers among adults may be related to obesity and a lack of sufficient physical activity.6,38 Increased rates of obesity among adolescents might explain increases in renal carcinomas observed overall and among those aged 15 to 19 years. Our study revealed that the incidence of nephroblastoma (Wilms tumor) remained stable in the 0- to 14-year age range (APC, −0.1%; 95% CI, −1.1 to 0.8) from 2001 to 2009. However, this finding does not necessarily contradict the observation that Wilms tumor may have decreased after the fortification of grains with folic acid in the United States from 1996 to 1998.39
A significant decrease in melanoma was seen overall, in boys, white patients, non-Hispanic patients, persons aged 15 to 19, and in both the Northeast and the West. Although previous studies using SEER have documented an increasing incidence of melanoma, these studies examined a much longer period (19–36 years) and did not include NPCR data.40–42 It is possible that pediatric melanoma is decreasing after an increase seen at the end of the last century. However, melanoma is often an outpatient disease that adds registry data late into SEER and NPCR. It is important to monitor this trend to distinguish significant decrease from an artifact of late reporting.
The extracranial and extragonadal germ cell tumor group was decreasing overall and in girls and Hispanics. This group contains sacrococcygeal teratomas and germ cell tumors located in the mediastinum, retroperitoneal area, and uterus. Sacrococcygeal teratomas are the most common of this group, are often diagnosed prenatally, and are more common in girls.43 Unspecified intracranial and intraspinal neoplasms were increasing overall, which is a small group of unspecified CNS neoplasms that is difficult to attribute to any 1 type of CNS tumor. Rates of pediatric acute lymphoblastic leukemia, acute myeloid leukemia, non-Hodgkin’s lymphoma, and testicular germ cell tumors have been previously reported as increasing from 1975 to 2010, but our study did not reveal an overall increase in these cancers looking at the last decade of this time period.10
Overall Findings
This study summarizes childhood and adolescent cancer incidence and trends by using nationwide NPCR and SEER data. Overall and subgroup cancer incidence rates were similar to previous studies of pediatric cancer incidence using SEER and NPCR (leukemia was the highest, followed by CNS neoplasms).3,4,10,44 Incidence variance by age, gender, and race were similar to previous reports.3,4,10
Our findings indicate that overall cancer rates among children and adolescents are stable. Several studies have revealed significant increases in cancer rates among children and adolescents during the past 2 decades,5,15,44 but other studies have revealed an increase4,45 or decrease, neither of which were significant.46 These different findings may be due to different study years and population coverage. Consistent with the 2013 Annual Report to the Nation on the Status of Cancer (years 2000–2009), our study revealed that overcall cancer incidence rates for children and adolescents were stable from 2001 to 2009.8
Strengths and Limitations
The NPCR and SEER databases have quality standards that help to minimize misclassification of gender, age, and race.3,11 Because the International Classification of Diseases for Oncology, Third Edition, coding standard was introduced in 2001, limiting our analysis to 2001–2009 further minimized misclassification artifacts that were potentially caused by the coding standard change.3 Additionally, restricting our analysis to use no data beyond 2009 allowed us to avoid a change in demographic denominators that would be included with 2010 data using the 2010 census.15 Using the SEER and NPCR databases allowed us to analyze cancer incidence and trends by US Census region.3
Despite using high-quality data, the NPCR and SEER database may have some variation in the coding of individual races and ethnicities, especially when considering the Hispanic and American Indians/Alaska Natives designations.3,47,48 Changes in diagnostic accuracy or coding changes during this period, such as a change in the coding of astrocytomas, may have had a small effect on the trend result.4,9,49 Late-diagnosed cancers, such as melanomas, might be underrepresented in the later years contained in this study and may explain differences in findings from other studies that evaluated trends over a longer period of time or that used a delay-adjustment model to estimate late-reported cases.5,8,40 Because our study did not use delay-adjusted data, the finding of significantly decreasing rates of melanoma must be interpreted critically.
Given the rarity of pediatric cancer, there is a greater possibility of a type I error when analyzing subgroup analyses with small numbers. Some significant findings in the present study demonstrate significance that is very close to the cutoff margin, such as the finding of increasing leukemia among the Hispanic group or increasing Hodgkin’s lymphoma among the African American population. Although these trends may be true, these findings must be further validated to distinguish rate changes secondary to coding or diagnostic artifact versus a change that could be caused from behavioral, environmental, genetic, or population-based factors. The cause of changing incidence rates is often unknown. Findings such as the increase of thyroid carcinoma that hold true across several age, geographic, and racial subgroups may need to be the subject of future investigations that would help us better understand the forces driving this change.
CONCLUSIONS
This study illustrates recent childhood and adolescent cancer incidence rates and trends in the United States and demonstrates, previously unreported, that renal carcinoma rates are increasing. In addition, this study supplements previous research of increasing overall cancer incidence rates in African Americans and provides data with more comprehensive population coverage demonstrating increasing rates of thyroid carcinoma among children and adolescents. These findings highlight an opportunity to improve our knowledge of the driving factors of these cancer incidence rate trends, and this understanding may help develop new preventive measures.
Supplementary Material
WHAT’S KNOWN ON THIS SUBJECT
Cancer continues to be the leading disease-related cause of death among children and adolescents in the United States. More information is needed about recent trends.
WHAT THIS STUDY ADDS
This study provides recent, robust data supporting the increasing incidence of pediatric thyroid cancer and rising overall cancer rates among African American children and adolescents and is the first study to describe increasing rates of pediatric renal carcinoma.
Acknowledgments
FUNDING: No external funding.
ABBREVIATIONS
- APC
annual percent change
- CI
confidence interval
- CNS
central nervous system
- ICCC
International Classification of Childhood Cancer
- NPCR
National Program of Cancer Registries
- SEER
Surveillance, Epidemiology, and End Results
Footnotes
Dr Siegel contributed to study design, carried out the initial analyses, drafted the initial manuscript, and edited the final manuscript as submitted; Ms King conceptualized changes made in revision, contributed to study design, carried out data analysis, and critically reviewed the manuscript; Dr Li brought in the research idea, conceptualized and designed the study, oversaw this study, carried out initial data analysis, and critically reviewed the manuscript; Drs Tai, Buchanan, and Ajani conceptualized and designed the study and critically reviewed the manuscript; and all authors approved the final manuscript as submitted.
The findings and conclusions in this report are those of the authors and do not necessarily represent the official position of the Centers for Disease Control and Prevention.
FINANCIAL DISCLOSURE: The authors have indicated they have no financial relationships relevant to this article to disclose.
POTENTIAL CONFLICT OF INTEREST: The authors have indicated they have no potential conflicts of interest to disclose.
References
- 1.Heron M, Sutton PD, Xu J, Ventura SJ, Strobino DM, Guyer B. Annual summary of vital statistics: 2007. Pediatrics. 2010;125(1):4–15. doi: 10.1542/peds.2009-2416. [DOI] [PubMed] [Google Scholar]
- 2.National Vital Statistics System, Centers of Disease Control and Prevention. 10 leading causes of death by age group, United States – 2008. Available at: www.cdc.gov/injury/wisqars/leadingcauses.html. Accessed February 9, 2012.
- 3.Li J, Thompson TD, Miller JW, Pollack LA, Stewart SL. Cancer incidence among children and adolescents in the United States, 2001–2003. Pediatrics. 2008;121(6) doi: 10.1542/peds.2007-2964. Available at: www.pediatrics.org/cgi/content/full/121/6/e1470. [DOI] [PubMed] [Google Scholar]
- 4.Linabery AM, Ross JA. Trends in childhood cancer incidence in the U.S. (1992–2004) Cancer. 2008;112(2):416–432. doi: 10.1002/cncr.23169. [DOI] [PubMed] [Google Scholar]
- 5.Kohler BA, Ward E, McCarthy BJ, et al. Annual report to the nation on the status of cancer, 1975–2007, featuring tumors of the brain and other nervous system. J Natl Cancer Inst. 2011;103(9):714–736. doi: 10.1093/jnci/djr077. [DOI] [PMC free article] [PubMed] [Google Scholar]
- 6.Eheman C, Henley SJ, Ballard-Barbash R, et al. Annual Report to the Nation on the status of cancer, 1975–2008, featuring cancers associated with excess weight and lack of sufficient physical activity. Cancer. 2012;118(9):2338–2366. doi: 10.1002/cncr.27514. [DOI] [PMC free article] [PubMed] [Google Scholar]
- 7.Holmes L, Jr, Hossain J, Opara F. Pediatric thyroid carcinoma incidence and temporal trends in the USA (1973–2007): race or shifting diagnostic paradigm? ISRN Oncol. 2012;2012:906197. doi: 10.5402/2012/906197. [DOI] [PMC free article] [PubMed] [Google Scholar]
- 8.Jemal A, Simard EP, Dorell C, et al. Annual Report to the Nation on the Status of Cancer, 1975–2009, featuring the burden and trends in human papillomavirus (HPV)-associated cancers and HPV vaccination coverage levels. J Natl Cancer Inst. 2013;105(3):175–201. doi: 10.1093/jnci/djs491. [DOI] [PMC free article] [PubMed] [Google Scholar]
- 9.Spector LG, Linabery AM. Childhood cancer incidence: is it really going up? Pediatr Blood Cancer. 2009;53(1):1–2. doi: 10.1002/pbc.21994. [DOI] [PubMed] [Google Scholar]
- 10.Ward E, DeSantis C, Robbins A, Kohler B, Jemal A. Childhood and adolescent cancer statistics, 2014. CA Cancer J Clin. 2014;64(2):83–103. doi: 10.3322/caac.21219. [DOI] [PubMed] [Google Scholar]
- 11.Merrill RM, Dearden KA. How representative are the surveillance, epidemiology, and end results (SEER) program cancer data of the United States? Cancer Causes Control. 2004;15(10):1027–1034. doi: 10.1007/s10552-004-1324-5. [DOI] [PubMed] [Google Scholar]
- 12.Wingo PA, Jamison PM, Hiatt RA, et al. Building the infrastructure for nationwide cancer surveillance and control—a comparison between the National Program of Cancer Registries (NPCR) and the Surveillance, Epidemiology, and End Results (SEER) Program (United States) Cancer Causes Control. 2003;14(2):175–193. doi: 10.1023/a:1023002322935. [DOI] [PubMed] [Google Scholar]
- 13.Steliarova-Foucher E, Stiller C, Lacour B, Kaatsch P. International Classification of Childhood Cancer, Third Edition. Cancer. 2005;103(7):1457–1467. doi: 10.1002/cncr.20910. [DOI] [PubMed] [Google Scholar]
- 14.Surveillance, Epidemiology, and End Results (SEER) Program. National Cancer Institute SEER*Stat Software, version 8.1.2. Bethesda, MD: National Cancer Institute; 2013. Available at: www.seer.cancer.gov/seerstat. Accessed February 3, 2014. [Google Scholar]
- 15.Edwards BK, Noone AM, Mariotto AB, et al. Annual Report to the Nation on the status of cancer, 1975–2010, featuring prevalence of comorbidity and impact on survival among persons with lung, colorectal, breast, or prostate cancer. Cancer. 2014;120(9):1290–1314. doi: 10.1002/cncr.28509. [DOI] [PMC free article] [PubMed] [Google Scholar]
- 16.Pui CH, Pei D, Pappo AS, et al. Treatment outcomes in black and white children with cancer: results from the SEER database and St Jude Children’s Research Hospital, 1992 through 2007. J Clin Oncol. 2012;30(16):2005–2012. doi: 10.1200/JCO.2011.40.8617. [DOI] [PMC free article] [PubMed] [Google Scholar]
- 17.Kadan-Lottick NS, Ness KK, Bhatia S, Gurney JG. Survival variability by race and ethnicity in childhood acute lymphoblastic leukemia. JAMA. 2003;290(15):2008–2014. doi: 10.1001/jama.290.15.2008. [DOI] [PubMed] [Google Scholar]
- 18.Linabery AM, Ross JA. Childhood and adolescent cancer survival in the US by race and ethnicity for the diagnostic period 1975–1999. Cancer. 2008;113(9):2575–2596. doi: 10.1002/cncr.23866. [DOI] [PMC free article] [PubMed] [Google Scholar]
- 19.Holman DM, Soman A, Watson M, Weir H, Trivers KF, White MC. Examination of the increase in thyroid cancer incidence among younger women in the United States by age, race, geography, and tumor size, 1999–2007. J Adolesc Young Adult Oncol. 2011;1(2):95–102. doi: 10.1089/jayao.2011.0014. [DOI] [PubMed] [Google Scholar]
- 20.Siegel R, Ma J, Zou Z, Jemal A. Cancer statistics, 2014. CA Cancer J Clin. 2014;64(1):9–29. doi: 10.3322/caac.21208. [DOI] [PubMed] [Google Scholar]
- 21.Vergamini LB, Frazier AL, Abrantes FL, Ribeiro KB, Rodriguez-Galindo C. Increase in the incidence of differentiated thyroid carcinoma in children, adolescents, and young adults: a population-based study. J Pediatr. 2014;164(6):1481–1485. doi: 10.1016/j.jpeds.2014.01.059. [DOI] [PubMed] [Google Scholar]
- 22.Hammer GP, Seidenbusch MC, Regulla DF, et al. Childhood cancer risk from conventional radiographic examinations for selected referral criteria: results from a large cohort study. AJR Am J Roentgenol. 2011;197(1):217–223. doi: 10.2214/AJR.10.4979. [DOI] [PubMed] [Google Scholar]
- 23.Hammer GP, Seidenbusch MC, Schneider K, et al. A cohort study of childhood cancer incidence after postnatal diagnostic x-ray exposure. Radiat Res. 2009;171(4):504–512. doi: 10.1667/RR1575.1. [DOI] [PubMed] [Google Scholar]
- 24.Brenner D, Elliston C, Hall E, Berdon W. Estimated risks of radiation-induced fatal cancer from pediatric CT. AJR Am J Roentgenol. 2001;176(2):289–296. doi: 10.2214/ajr.176.2.1760289. [DOI] [PubMed] [Google Scholar]
- 25.Schonfeld SJ, Lee C, Berrington de González A. Medical exposure to radiation and thyroid cancer. Clin Oncol (R Coll Radiol) 2011;23(4):244–250. doi: 10.1016/j.clon.2011.01.159. [DOI] [PubMed] [Google Scholar]
- 26.Memon A, Godward S, Williams D, Siddique I, Al-Saleh K. Dental x-rays and the risk of thyroid cancer: a case-control study. Acta Oncol. 2010;49(4):447–453. doi: 10.3109/02841861003705778. [DOI] [PubMed] [Google Scholar]
- 27.Meinhold CL, Ron E, Schonfeld SJ, et al. Nonradiation risk factors for thyroid cancer in the US Radiologic Technologists Study. Am J Epidemiol. 2010;171(2):242–252. doi: 10.1093/aje/kwp354. [DOI] [PMC free article] [PubMed] [Google Scholar]
- 28.Almquist M, Johansen D, Björge T, et al. Metabolic factors and risk of thyroid cancer in the Metabolic syndrome and Cancer project (Me-Can) Cancer Causes Control. 2011;22(5):743–751. doi: 10.1007/s10552-011-9747-2. [DOI] [PubMed] [Google Scholar]
- 29.Sokol RJ. The chronic disease of childhood obesity: the sleeping giant has awakened. J Pediatr. 2000;136(6):711–713. [PubMed] [Google Scholar]
- 30.De Groef B, Decallonne BR, Van der Geyten S, Darras VM, Bouillon R. Perchlorate versus other environmental sodium/iodide symporter inhibitors: potential thyroid-related health effects. Eur J Endocrinol. 2006;155(1):17–25. doi: 10.1530/eje.1.02190. [DOI] [PubMed] [Google Scholar]
- 31.Zhang Y, Guo GL, Han X, et al. Do polybrominated diphenyl ethers (PBDEs) increase the risk of thyroid cancer? Biosci Hypotheses. 2008;1(4):195–199. doi: 10.1016/j.bihy.2008.06.003. [DOI] [PMC free article] [PubMed] [Google Scholar]
- 32.La Vecchia C, Ron E, Franceschi S, et al. A pooled analysis of case-control studies of thyroid cancer. III. Oral contraceptives, menopausal replacement therapy and other female hormones. Cancer Causes Control. 1999;10(2):157–166. doi: 10.1023/a:1008832513932. [DOI] [PubMed] [Google Scholar]
- 33.Li N, Du XL, Reitzel LR, Xu L, Sturgis EM. Impact of enhanced detection on the increase in thyroid cancer incidence in the United States: review of incidence trends by socioeconomic status within the surveillance, epidemiology, and end results registry, 1980–2008. Thyroid. 2013;23(1):103–110. doi: 10.1089/thy.2012.0392. [DOI] [PMC free article] [PubMed] [Google Scholar]
- 34.Silberstein J, Grabowski J, Saltzstein SL, Kane CJ. Renal cell carcinoma in the pediatric population: results from the California Cancer Registry. Pediatr Blood Cancer. 2009;52(2):237–241. doi: 10.1002/pbc.21779. [DOI] [PubMed] [Google Scholar]
- 35.Grabowski J, Silberstein J, Saltzstein SL, Saenz N. Renal tumors in the second decade of life: results from the California Cancer Registry. J Pediatr Surg. 2009;44(6):1148–1151. doi: 10.1016/j.jpedsurg.2009.02.019. [DOI] [PubMed] [Google Scholar]
- 36.Selle B, Furtwängler R, Graf N, Kaatsch P, Bruder E, Leuschner I. Population-based study of renal cell carcinoma in children in Germany, 1980–2005: more frequently localized tumors and underlying disorders compared with adult counterparts. Cancer. 2006;107(12):2906–2914. doi: 10.1002/cncr.22346. [DOI] [PubMed] [Google Scholar]
- 37.Chow WH, Dong LM, Devesa SS. Epidemiology and risk factors for kidney cancer. Nat Rev Urol. 2010;7(5):245–257. doi: 10.1038/nrurol.2010.46. [DOI] [PMC free article] [PubMed] [Google Scholar]
- 38.World Cancer Research Fund/American Institute for Cancer Research. Food, Nutrition, Physical Activity, and the Prevention of Cancer: A Global Perspective. Washington, DC: American Institute for Cancer Research; 2007. [Google Scholar]
- 39.Linabery AM, Johnson KJ, Ross JA. Childhood cancer incidence trends in association with US folic acid fortification (1986–2008) Pediatrics. 2012;129(6):1125–1133. doi: 10.1542/peds.2011-3418. [DOI] [PMC free article] [PubMed] [Google Scholar]
- 40.Wong JR, Harris JK, Rodriguez-Galindo C, Johnson KJ. Incidence of childhood and adolescent melanoma in the United States: 1973–2009. Pediatrics. 2013;131(5):846–854. doi: 10.1542/peds.2012-2520. [DOI] [PMC free article] [PubMed] [Google Scholar]
- 41.Strouse JJ, Fears TR, Tucker MA, Wayne AS. Pediatric melanoma: risk factor and survival analysis of the surveillance, epidemiology and end results database. J Clin Oncol. 2005;23(21):4735–4741. doi: 10.1200/JCO.2005.02.899. [DOI] [PubMed] [Google Scholar]
- 42.Austin MT, Xing Y, Hayes-Jordan AA, Lally KP, Cormier JN. Melanoma incidence rises for children and adolescents: an epidemiologic review of pediatric melanoma in the United States. J Pediatr Surg. 2013;48(11):2207–2213. doi: 10.1016/j.jpedsurg.2013.06.002. [DOI] [PubMed] [Google Scholar]
- 43.Olson TA, Schneider DT, Perlman EJ. Germ cell tumors. In: Pizzo PA, Poplack DG, editors. Principles and Practice of Pediatric Oncology. 6th. Philadelphia, PA: Wolters Kluwer Health/Lippincott Williams & Wilkins; 2010. pp. 1045–1067. [Google Scholar]
- 44.Howlader N, Krapcho M, Neyman N, et al., editors. SEER Cancer Statistics Review, 1975–2008. Bethesda, MD: National Cancer Institute; Available at: http://seer.cancer.gov/csr/1975_2008/. Accessed March 20, 2012. [Google Scholar]
- 45.Kaatsch P, Steliarova-Foucher E, Crocetti E, Magnani C, Spix C, Zambon P. Time trends of cancer incidence in European children (1978–1997): report from the Automated Childhood Cancer Information System project. Eur J Cancer. 2006;42(13):1961–1971. doi: 10.1016/j.ejca.2006.05.014. [DOI] [PubMed] [Google Scholar]
- 46.Bao PP, Zheng Y, Gu K, et al. Trends in childhood cancer incidence and mortality in urban Shanghai, 1973–2005. Pediatr Blood Cancer. 2010;54(7):1009–1013. doi: 10.1002/pbc.22383. [DOI] [PubMed] [Google Scholar]
- 47.Clegg LX, Reichman ME, Hankey BF, et al. Quality of race, Hispanic ethnicity, and immigrant status in population-based cancer registry data: implications for health disparity studies. Cancer Causes Control. 2007;18(2):177–187. doi: 10.1007/s10552-006-0089-4. [DOI] [PubMed] [Google Scholar]
- 48.Gomez SL, Glaser SL. Misclassification of race/ethnicity in a population-based cancer registry (United States) Cancer Causes Control. 2006;17(6):771–781. doi: 10.1007/s10552-006-0013-y. [DOI] [PubMed] [Google Scholar]
- 49.McKean-Cowdin R, Razavi P, Barrington-Trimis J, et al. Trends in childhood brain tumor incidence, 1973–2009. J Neurooncol. 2013;115(2):153–160. doi: 10.1007/s11060-013-1212-5. [DOI] [PMC free article] [PubMed] [Google Scholar]
Associated Data
This section collects any data citations, data availability statements, or supplementary materials included in this article.