Abstract
In virtual colonoscopy, CT scans are typically acquired with the patient in both supine (facing up) and prone (facing down) positions. The registration of these two scans is desirable so that the user (physician) can clarify situations or confirm polyp findings at a location in one scan with the same location in the other, thereby improving polyp detection rates and reducing false positives. However, this supine-prone registration is challenging because of the substantial distortions in the colon shape due to the patient’s position shifting. We present an efficient algorithm and framework for performing this registration through the use of conformal geometry to guarantee the registration is a diffeomorphism (a one-to-one and onto mapping). The taenia coli and colon flexures are automatically extracted for each supine and prone surface employing the colon geometry. The two colon surfaces are divided into several segments using the flexures. Each of the colon segments is conformally flattened to the rectangular domain using holomorphic differentials with the taenia coli. For both, the mean curvature are color encoded as texture images, from which feature points are automatically detected using graph cut segmentation, mathematic morphological operations, and principal component analysis. Using these corresponding features, the conformal flattening is adjusted to be quasi-conformal such that the features become aligned. We demonstrate the efficiency and efficacy of our registration method by illustrating matched views on both the 2D flattened colon images and in the 3D volume rendered colon interior view. We evaluate the correctness of the results by measuring the distance between features on the registered colons.
1 Introduction
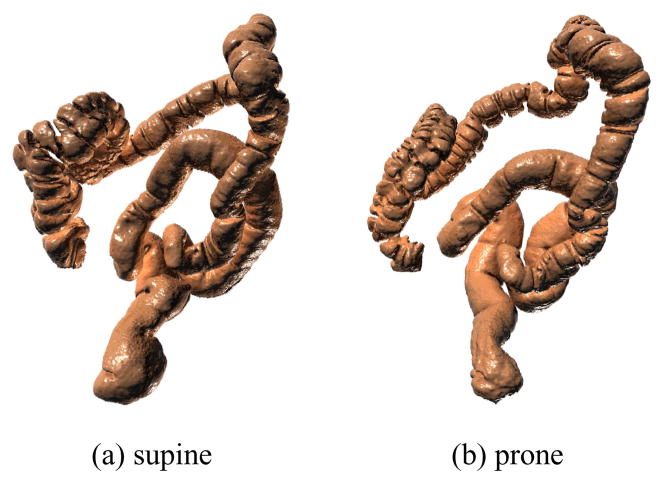
Colorectal cancer is the third most incident cancer and the second leading cause of cancer related mortality in the United States [14]. Optical colonoscopy (OC), whereby precancerous polyps can be located and removed, has been recommended for screening and has helped to greatly reduce the mortality rate of colorectal cancer [3]. Virtual colonoscopy (VC) techniques have been developed as viable non-invasive alternatives to OC for screening purposes [11, 19]. For a VC procedure, computed tomography (CT) scans of the abdomen are commonly acquired with the patient in both the supine (facing up) and prone (facing down) positions. From these scans, the colon wall can be extracted as in Figure 2 and presented to the VC user as a volume rendered endoluminal view, mimicing the endoscopic view of an OC.
Fig. 2.
The same colon reconstructed from supine (a) and prone (b) scans.
The use of computer-aided detection (CAD) of colonic polyps has also been suggested [13, 31]. A CAD scheme can help to reduce the necessary reading and interpretation time of the user and can act as a second reader to improve detection rates of VC. Though various CAD methods can achieve different accuracies, a common problem among them is the presence of false positives in the results. A reduction of these false positives would help the user to focus on true suspicious areas and not waste time on unimportant regions.
Throughout the development of VC, the registration of the supine and prone scans has remained a constant and challenging problem [1, 5, 24]. Being able to register these two scans is useful for both a routine VC system and for a CAD system. In the case of a VC system, providing the user the ability to jump from one area in one scan to the same area in the other scan would allow for the easy comparison of these areas when something might be unclear in one of the scans, or for confirming a finding. For a CAD system, a proper registration could help achieve greater accuracy while at the same time reducing false positive results.
In this paper, we present a method of supine-prone registration based on conformal geometry. Conformal colon flattening has been introduced as an enhancement for VC navigation [12] and has been utilized successfully for CAD [13]. According to conformal geometry theory, there exists an angle preserving map which periodically flattens the colon surface onto a planar rectangle. This mapping minimizes the total stretching energy. Because the conformal mapping is local shape preserving, it offers an effective way to visualize the entire colon surface, and exposes all the geometric structures hidden in the original shape embedded in 3D.
The characteristics of the deformation between the supine and the prone is determined by the elasticity properties of the tissue and muscle. The strain-stress relations for different types of tissues or muscles are different. If the strain-stress relation deformation is independent of the orientation, then local deformation is practically a scaling, and the global deformation is conformal. In that case, we can flatten each supine and prone surface to a planar rectangle conformally, and those two rectangles should be similar. By aligning the planar rectangles, we can get a one-to-one and onto mapping, and obtain the registration between them. In this work, we introduce this registration approach and carefully design experiments to test whether the deformation between supine and prone is conformal or not. Our experimental results show that the deformation is not conformal, but close to conformal.
Intuitively, an elastic deformation with bounded angle distortion is called a quasi-conformal map. The angle distortion for a quasi-conformal map can be represented as a complex valued function, the so-called Beltrami coefficient. The Beltrami coefficient fully controls the quasi-conformal map, which is determined by the elasticity of the underlying material. By better understanding the deformation between supine and prone, we can understand the elasticity of the tissue and muscle and vice versa.
The non-rigid elastic deformation of supine-prone colons poses a great challenge for shape registration. In this work, we locate and match the anatomical feature curves and internal feature points on the conformally flattened supine and prone surfaces, and compute a harmonic map with these feature constraints in the linear computational complexity. The resulting supine-prone registration is a quasi-conformal map (diffeomorphism), which reflects the elastic deformation of the muscle and tissue. The distortion is evaluated by the Beltrami coefficients. Our experiments on 6 pairs of supine-prone colons obtained an average ℝ3 distance error of 7.85mm in terms of the feature points and ployps evaluation. Our registration method performs better than other existing methods. To the best of our knowledge, it is the first work to apply geometric mapping for supine-prone colon registration by converting the 3D registration problem to a 2D image matching problem. The whole process is efficient and automatic.
Figure 3 shows our registration pipeline, which primarily consists of 5 stages. As the input, the supine and prone CT scans are subjected to the pre-processing steps, including cleansing, segmentation with topological simplification, and surface mesh reconstruction, which are outside the scope of this paper. Given the supine and prone surfaces, anatomical landmarks are extracted (see Section 4.1). Along these landmarks, the colon surfaces of both supine and prone are decomposed to segments. For each segment, a flat rectangular conformal mapping is obtained (see Section 4.2). Based on the flat mapping images, internal feature points are detected and their correspondences are also obtained between the supine and prone (see Section 4.3). With the feature correspondence constraints, the supine-prone colon registration is performed using a harmonic map (see Section 4.4).
Fig. 3.

Our pipeline for supine-prone colon registration.
2 Related Works
Early work on supine-prone registration for VC applications focused on using the centerlines and various landmarks. A basic method applies linear stretching and shrinking operations to the centerline, where local extrema are matched and used to drive the deformations [1]. Improved methods of centerline correlation were also investigated for use in reducing false positive results [24]. Correlating individual points along the centerline through the use of dynamic programming has also been suggested [5, 23].
More recently, the taenia coli (three bands of smooth muscle along the colon surface) have been used as features which can be correlated between the two scans [15, 16]. This relies on a manual identification of one of the three taenia coli, and then an automatic algorithm repeats the line representing the identified taenia coli at equal distances. Further progress has been made where the haustral folds and the points between them can be automatically detected, and the taenia coli are identified by connecting these points [30]. However, this method is only feasible on the ascending and transverse portions of the colon.
Deformation fields have also been suggested for use in supine-prone registration. Motion vectors can be identified for matched centerline regions, interpolated for non-matched regions, and then propagated to the entire volume [26]. It has also been proposed to use a free-form deformation grid to model the possible changes in the colon shape from supine to prone [25].
Conformal mapping has been successfully used for many medical applications, such as brain cortex surface morphology study [9] and colonic polyp detection [13]. In this work, we perform the supine-prone registration through the conformal mapping based on the holomorphic 1-forms. The colon surface is reconstructed from CT images, represented as a topological cylinder in the discrete form of triangular mesh, and conformally mapped to a planar rectangle. The computing of conformal mapping using holomorphic 1-forms has linear complexity. The subsequent registration is carried out through the 2D conformal mapping images of the supine and prone colons.
Discrete holomorphic forms were introduced [10] to compute global conformal surface parameterizations for general surfaces. Optimal holomorphic 1-forms were used to reduce area distortion for visualization purposes [18]. Work has been done to generalize 1-forms to parameterize genus one meshes [8] and to incorporate cone singularities [28]. Discrete 1-forms have been applied for meshing point clouds [27], surface tiling [6], and quadriangulation [28]. It has also been applied in computer vision [32, 34] for 3D shape matching, recognition, and stitching. The holomorphic 1-form method has been applied for CAD of colonic polyps in [13], where the use of planar conformal mapping improved the efficiency and accuracy for detecting polyps. In terms of surface registration by conformal mapping, the smooth one-to-one maps between closed surfaces of the same topology have been computed [22]. However, the work employed non-linear mapping computation and did not provide solution to handle open surfaces.
Because the deformation from supine to prone is not conformal, we generalize the conformal colon flattening method to a quasi-conformal flattening for registration purpose. Most existing colon registration methods cannot guarantee the mapping to be a diffeomorphism (one-to-one and onto mapping). Due to the complicated geometric structures of the colon surface, the existing methods often introduce folding or singularities in the mapping. Our proposed method is based on the biophysical nature of the deformation from supine to prone. The deformation is physically elastic and anisotropic. Due to the material properties of the muscles and tissues, the deformation can be exactly modeled as a quasi-conformal map. Our experimental results validate the fact that the mapping is indeed quasi-conformal. The elasticity properties of the tissues can be applied to determine the mapping, and vice versa, a better understanding of the deformation is helpful in obtaining the elasticity information. To the best of our knowledge, this work is the first to use quasi-conformal mapping theory for supine-prone registration.
3 Theoretic Background
3.1 Conformal Mapping
Suppose (S1, g1) and (S2, g2) are two surfaces embedded in ℝ3. A map φ : S1 → S2 is called conformal, if the pull back metric of g2 induced by φ on S1 differs from g1 by a positive scalar function:
where λ : S1 → ℝ is a scalar function, called the conformal factor.
Let γ1 and γ2 be two intersecting curves on S1. Then, their intersection angle is θ, and φ (γ1) and φ (γ2) are two curves on S2 with the same intersecting angle. Therefore, conformal mappings are angle preserving.
Let (S, g) be a surface embedded in ℝ3, g is the induced Euclidean metric. S is with an atlas {(Uα, φα)}, where (Uα, φα) is a local chart, Uα ⊂ S, φα: Uα → ℝ2. If each mapping φα is conformal, namely the Riemannian metric has local representation
then the local parameters are called isothermal coordinates of the surface. The atlas is called a conformal atlas. A surface with a conformal atlas is called a Riemann surface. All surfaces embedded in ℝ3 are Riemann surfaces.
3.2 Holomorphic Differential Forms
Let f : S → ℝ be a function defined on S. The harmonic energy is defined as
where ▽f is the gradient of f on the surface and dA is the area element. If f is a critical point of the harmonic energy, then it is called a harmonic function. A harmonic function satisfies the following Dirichlet condition,
where Δg is the Laplace-Beltrami operator determined by the Riemannian metric g,
Let (xα, yα) and (xβ, yβ) be two local parameters of a Riemann surface. A differential form has a local representation
such that
If ω satisfies the following condition
the ω is a closed 1-form. The Hodge star operator is defined as
If *ω is also closed, then ω is called a harmonic 1-form. Locally, a harmonic 1-form is the gradient of a harmonic function. A pair consisting of a harmonic 1-form and its conjugate form a holomorphic 1-form
3.3 Conformal Module
Suppose a surface S is a topological cylinder, genus zero with two boundaries ∂ S = γ1 − γ2. Let f be a harmonic function f : S → ℝ, such that f equals to 0 on γ1 and 1 on γ2. Then the gradient of f, ω = df is a harmonic 1-form, and is a holomorphic 1-form.
Let S̃ be an infinite simply connected surface with two boundaries. η : S̃ → S is the projection map. For each point p̃ ∈ S̃, there exists an open set Ũ(p̃), such that the restriction of η on Ũ(p̃) is a homeomorphism. Then, S̃ is called the universal covering space of S. The pull back η*g is a Riemannian metric on S̃. Similarly, the pull back of the holomorphic 1-form τ η*τ is a holomorphic 1-form on (S̃,η*g). We can construct the conformal mapping φ̃: S̃ → ℝ2, fix a base point p̃0 ∈ S̃, for any point p̃ ∈ S̃,
This constructs an isothermal coordinates for S̃, by projection; this also produces an isothermal atlas for S.
A fundamental domain D̃ on the universal covering space is a simply connected region, such that η(D̃) covers S once. A fundamental domain can be chosen in a way such that φ̃ maps it to a rectangle, then the height width ratio of the rectangle is the conformal module of S, Mod(S). Two topological cylinders are conformal equivalent, if and only if they share the same conformal module. Figure 4 shows the computing process of conformal mapping a topological cylinder.
Fig. 4.
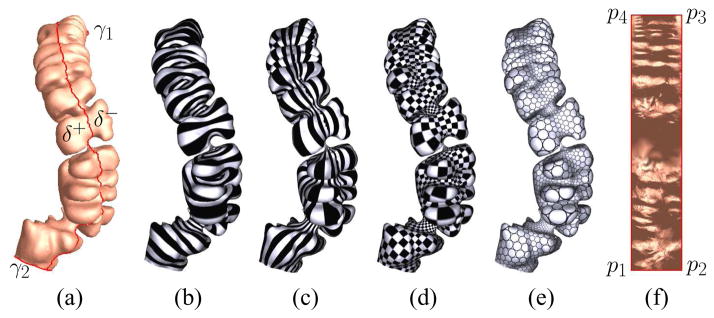
Conformal mappings for a colon surface: (a) the colon surface, which is a topological cylinder, reconstructed from CT images; (b) the level set of the harmonic 1-form ω; (c) the conjugate harmonic 1-form *ω; (d) the checker-board texture mapping for the resulting holomorphic 1-form τ, where the right angles are preserved; (e) the circle-packing texture mapping, where the shape of circles are preserved, (f) the rectangle fundamental domain D̃.
3.4 Quasi-Conformal Deformation
Given two surfaces with Riemannian metrics (S1, g1), (S2, g2). φ : S1 → S2 is a conformal mapping, if there is no angle distortion. Intuitively, if φ introduce bounded angle distortion, then φ is a quasi-conformal map, which maps the infinitesimal circles to ellipses.
Suppose (x, y) are the local isothermal coordinates of S1, then the complex coordinates is ,
We choose isothermal coordinates of both S1 and S2, the derivatives of φ satisfies the following Beltrami equation
| (1) |
where μ is called the Beltrami coefficients, |μ| < 1. If μ is zero, then the mapping is conformal. The μ has geometric meaning. Suppose φ maps an infinitesimal circle to an infinitesimal ellipse. The stretching of the deformation is defined as the ratio between the length of the longer axis and that of the shorter axis, and the angle distortion between the longer axis of the ellipse and the real axis is half of the arg μ, as shown in Figure 5.
Fig. 5.
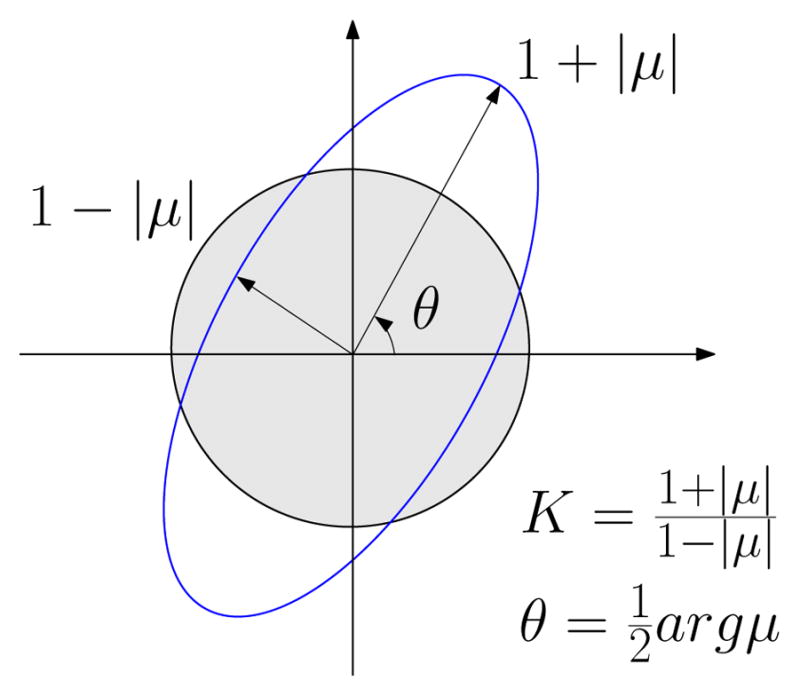
Geometric meaning for Beltrami coefficients μ. The quasi-conformal deformation can be measured by the local stretching K and the angle distortion θ through mapping infinitesimal circles to ellipses.
4 Computational Algorithms
This section explains in detail the algorithm pipeline for supine and prone colon registration. In practice, all surfaces are approximated by piecewise linear polygonal meshes. We denote a mesh with M, (V, E, F) for its vertex, edge, and face sets. We use vi to denote the ith vertex, ei j the half-edge from vi to vj, fi jk the face formed by vi, vj, vk, and the corner angle at vertex vi in the face fi jk.
4.1 Flexures and Taenia Coli Extraction
The taenia coli and the flexures are important anatomical landmarks of colon. Corresponding anatomical landmarks in supine and prone colons are automatically extracted, which are then used to cut each colon to its anatomical segments as well as slicing the colon open for flattening.
Taenia coli are three bands of longitudinal muscle on the surface of the colon. They form a triple helix structure from the appendix to the sigmoid colon and are ideal references for virtual navigation. The taenia coli are named taenia omentalis, taenia mesolica, and taenia libera according to the position on the transverse colon. Taenia coli can be regarded as ridge breakers for the haustral folds (they are located where haustral folds meet). It is relatively easy to extract the taenia omentalis as it is clearly visible on the transverse colon. Similar to reported approaches [4, 20], we identify the taenia coli by detecting the haustral folds, which are computed initially by using the heat diffusion and fuzzy C-means clustering algorithms [20]. Using these haustral folds, we extract the taenia omentalis and the other two taenia coli [15]. Although we extract all the three bands of taenia coli, we mostly use the taenia omentalis for subsequent processing.
In this paper, we present a method to identify the locations of four major flexures in the colon. These flexures are further anatomical landmarks which help in virtual navigation and supine-prone alignment and cutting. The first major flexure occurs between the ascending colon and the transverse colon (A–T flexure). This is the flexure close to the liver and is called the hepatic flexure. The second major flexure occurs between the transverse colon and the descending colon (T–D flexure). This flexure is close to the spleen and is named the splenic flexure. The third flexure occurs between the descending colon and the sigmoid (D–S flexure) and the final flexure is between the sigmoid and the rectum (S–R flexure). All of these flexures form very sharp bends and are distinguishable from other smaller bends. Theoretically, the A–T flexure forms the topmost point of the ascending colon and the T–D flexure forms the topmost point of the descending colon.
We utilize the centerline of the colon for the detection of these flexures. Initially the colon 3D centerline is detected (using e.g. [17]). This centerline is projected onto a 2D coordinate system in positive z –x and positive y –z planes. The bends in this centerline are identified by iteratively evaluating the slopes along the projected curves in the two planes. Not all the bends are important and so based on a threshold all small bends are discarded and only the major bends are retained. All of these detected bends are sorted based on their z-coordinate (up direction). We identify the T–D flexure as the bend with the highest z-coordinate and identify the A–T flexure as the bend with second highest z-coordinate. The S–R flexure is the bend with the lowest z-coordinate. The next bend in the sorted order after the T–D flexure whose y-coordinate is comparable to that of the T–D flexure forms the D–S flexure. These four positions are then mapped back to the 3D coordinate system and the corresponding 3D coordinates of the centerline are obtained.
However, the points that we obtained are those on the centerline and not on the surface. Using these points, the areas on the surface where the flexures are present have to be marked. For each point, we define a plane passing through the point perpendicular to the centerline tangent at that point. The intersection of the plane with the mesh surface is computed and a polyline is marked by joining the intersection points using Dijkstra’s algorithm. Consequently, the flexures on the surface are extracted.
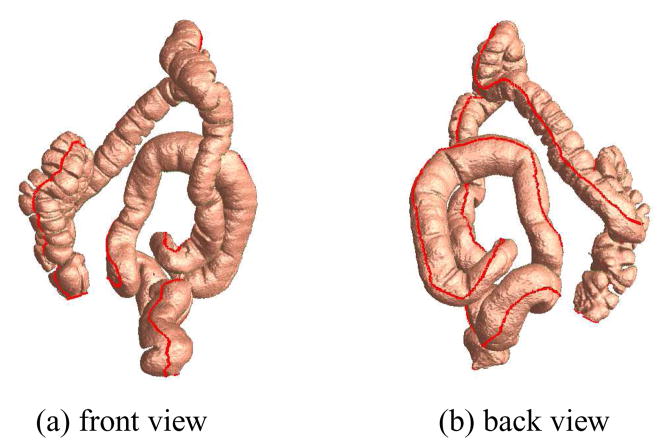
Once extracted, we have obtained four flexures between the five segments of the colon and one taenia coli as anatomical landmarks. Figure 6 shows the front and back views of a taenia coli on the prone colon surface. Figure 7 shows the four flexures on the prone colon surface and the five colon segments with their names.
Fig. 6.
Taenia coli (in red) on the prone colon surface.
Fig. 7.
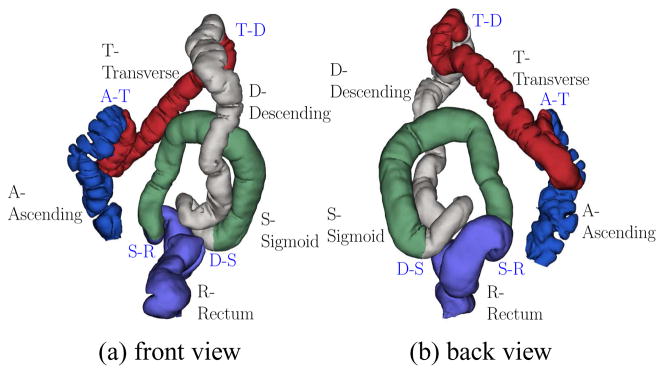
Flexures on the prone colon, which divide the colon surface into five segments, depicted in different colors. The segments are Ascending (A), Transverse (T), Descending (D), Sigmoid (S), and Rectum (R). There are four flexures A–T, T–D, D–S, and S–R.
4.2 Conformal Mapping
As shown in Figure 4, the colon segment (a) is a topological cylinder with two boundaries, cut from the flexures. We slice it open to a topological disk along the taenie coli, which connects the two boundaries. Then, we compute the harmonic functions (b–c) and holomorphic differentials (d–e) to conformally map the surface to a rectangle (f).
Given a triangular mesh Q of genus zero with two boundaries, γ1, γ2. Assume the boundary of Q is ∂ Q = γ1 − γ2, where γ1 denotes the outer boundary, γ2 the inner boundary. δ is the slicing line between γ1 and γ2, which cuts Q open to Q̃, and δ+, δ− are the two splits of δ. In order to to find a conformal mapping φ : Q → ℂ, which maps Q to a planar rectangle, we compute two harmonic functions f1, f2 : Q → ℝ, such that
Here, f1 is computed on Q, f2 on Q̃. Figures 4(b) and (c) show the level sets of the harmonic functions f1, f2, respectively.
We use the cotan formula to approximate the Laplace-Beltrami operator. Basically, for each edge [vi, v j], the two adjacent triangles are [vi, v j, vk] and [vj, vi, vl], the angles against the edge are and in each triangle respectively, then
The Laplacian of a function f : V → ℝ is then defined as:
Then, ▽f1 is a closed harmonic 1-form, and ▽f2 is an exact harmonic 1-form. We need to find a scalar λ, such that *▽f1 = λ ▽f2. This can be achieved by minimizing the following energy
where ▽f1 and ▽f2 are the constant gradient vector of f1 and f2 on the face [vi, vj, vk]; n is the normal vector to the face, and Ai jk is the area of the face. By solving a linear equation, λ can be obtained.
The desired holomorphic 1-form is . The induced conformal mapping φ : Q → ℂ is given by
where q is the base point and the path from q to p is arbitrarily chosen. Then, the surface is conformally mapped to a planar domain. By tracing the straight line perpendicular to the two boundaries γ1,γ2, we obtain a rectangular fundamental domain, as shown in Figure 4(f). The checker-board (d) and circle-packing (e) texture mapping results demonstrate the conformality of the mapping, where the right angles and the circles are preserved.
The conformal mapping based holomorphic differentials has linear computational complexity. We use the conjugate gradient method to solve the linear system. Figure 8 shows the conformal modules of different segments of the supine and prone colon surfaces. By comparing the corresponding conformal modules, it is clear that the deformation from the supine to prone is not conformal, let alone isometric.
Fig. 8.
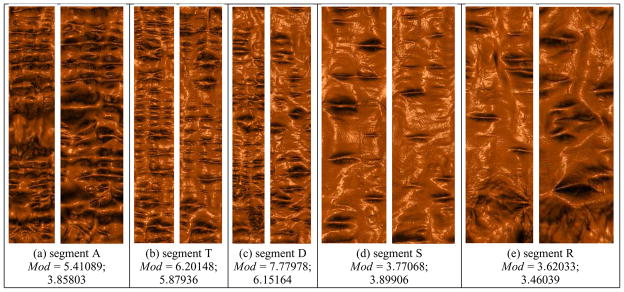
Conformal modulus comparison between different segments of the supine and the corresponding segments of the prone. In each column, the left image shows the flattened rendering of the supine and the right image shows the flattened rendering result of the prone. The conformal module for each segment is defined as the ratio of height and width over the flat rectangle map, Mod = height/width. Each of the segment pairs are not conformally equivalent.
4.3 Feature Points Detection
The computational process of detecting feature points internal to the flat rectangle and finding correspondences between them is illustrated in Figures 9 and 10.
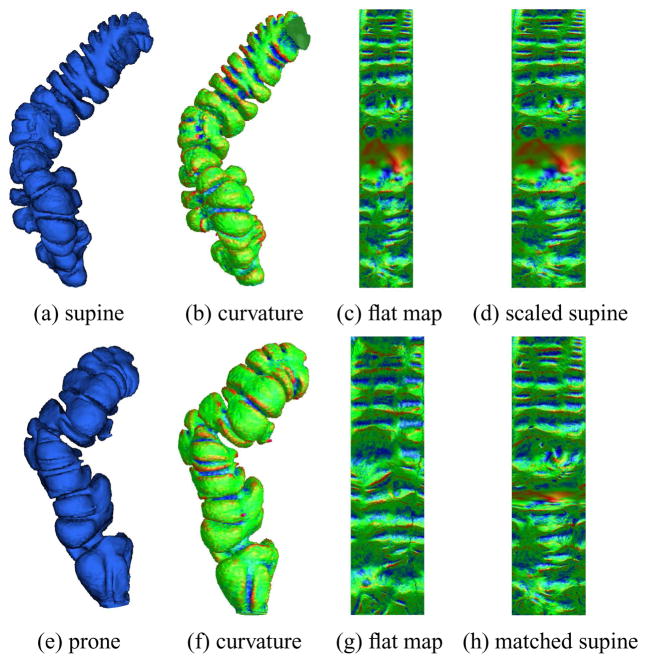
Fig. 9.
Color encoding mean curvature on corresponding supine and prone segments. (a) and (e) The original colon surface segments; (b) and (f) The color encoded mean curvatures; (c) and (g) The color encoded mean curvature on the flattened surfaces; (d) The scaled flat image of (c) with the same size as (g); (h) The deformed flat image of (c) after registration to (g).
Fig. 10.
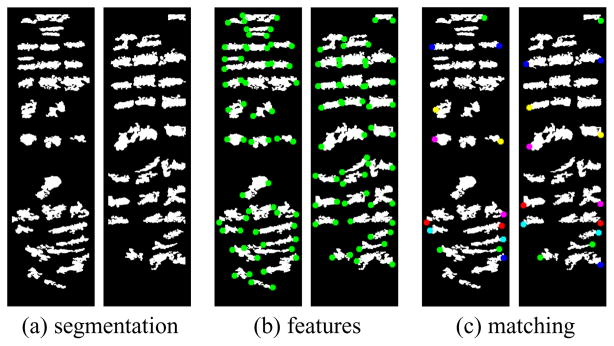
Feature detection and matching for the flat images between supine and prone (see Figures 9(d) and (g)). In each frame, the supine is on the left, the prone is on the right. (a) segmentation results using graph cut; (b) feature detection results, and (c) feature matching results using graph matching. Two corresponding feature points are encoded in the same color on the supine and prone flat images.
After we map each colon segment onto a planar rectangle, we color encode the mean curvature to generate color images. Figures 9(b) and (f) show the mean curvature images of supine (a) and prone (e). The mean curvature on vi H(vi) is approximated by
where ni is the normal at the vertex vi, <,> is the inner product in ℝ3, and wi j is the cotangent weight in Eqn.4.2. Figures 9(c) and (g) show the color encoded mean curvature image for the flattened colon surface; (d) is the scaled image of (c), with the same size of (g). Then, we use the flat images (d) and (g) for the feature points detection. (h) shows the deformed flat image of the supine (c) after the registration to the prone (g).
We analyze these color coded flattened colon segments to obtain specific feature points for better registration. We use the well known graph cut approach from computer vision to find the regions of interest. The required regions of interest on the flattened supine and prone images are the folds. A graph is constructed using the pixels of the image as the nodes. Assuming a virtual sink and source, edges are constructed with appropriately assigned weights. Using the max-flow min-cut method [2] to solve the energy minimization problem, we obtain all the pixels belonging to the folds. The appropriate assignment of weights ensures efficient detection of the folds. Due to the drastic change in position of the patient in supine and prone, the colon tends to stretch, contract and move, resulting in the distortion of the folds. In addition, some areas might be densely populated with folds, while other areas are sparsely populated. To prevent any ambiguities, we only choose the significant folds which have a lower chance of distortion. Therefore, we discard all the folds whose length and size are below a certain threshold. For this, a pre-processing is done by using breadth-first search to find all the connected components among the extracted folds. The prominent folds form larger connected components and thus by defining an experimental threshold value, all the smaller components are discarded. Hence, by varying the threshold we can monitor the number of detected folds based on our requirement. Figure 10(a) shows the segmentation results for both the supine and prone surfaces.
After applying the threshold we now have all the significant folds detected. These folds can be approximated as ellipses and hence the axial end points form good feature points for registration. These axial points of the detected folds are extracted and form our feature point set. Figure 10(b) shows the detected features (in green) on both supine and prone surfaces.
Finding a correspondence between the extracted feature points in supine and prone is again formulated as an energy minimization problem by defining an objective function. This energy optimization is viewed as an instance of the graph matching problem which is solved using [29]. The distance between the feature points is used as the cost function. However, this causes certain problems due to the uneven distribution of the feature points. In order to prevent these discrepancies, we use only the left most and right most feature points. By using only these border feature points, we have a better and more accurate cost function for our graph matching problem. Finally, we obtain the set of all feature point pairs that form a correspondence between supine and prone. These pairs serve as constraints for registration. Figure 10(c) illustrates the correspondences between features on both the supine and prone surfaces. A corresponding pair of feature points is encoded in the same color.
4.4 Surface Registration with Internal Features
Suppose the feature points are {p0, p1, · · · pn} on the supine surface and {q0, q1, · · ·, qn} on the prone surface, such that pk corresponds to qk. In order to enforce the alignments among these internal features, first we use an affine map η : ℝ2 → ℝ2, which maps the rectangle of the supine to that of the prone. Then we compute two harmonic functions, h = (h1, h2), such that
and furthermore
and
Then, the final registration map from supine to prone Φ : S1 → S2is given by
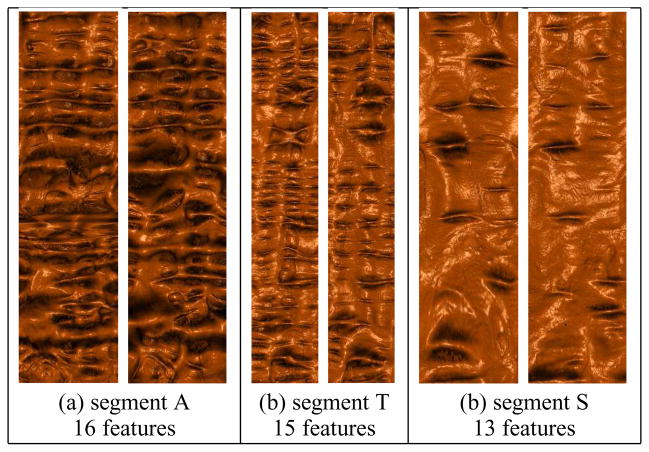
This step adjusts the conformal mapping to be quasi-conformal. It also has the linear complexity. Figure 11 shows the registration results for 3 segments based on such harmonic maps. Compared to the conformal mapping results in Figure 8, it is clear that the registration achieves greater accuracy when using the internal features.
Fig. 11.
Registration visualization for segments A, T and S. The numbers of internal feature constraints are 16, 15, and 13, respectively.
4.5 Consistent View in VC
In order to visualize both supine and prone in a consistent manner, we need to map the camera frustum viewing the supine inner surface (mucosa) to the camera frustum viewing the prone mucosa. We achieve this by first matching the centerlines through the entire colon lumen, and then matching the camera orthonormal coordinate frames.
We map both supine and prone onto the same rectangles on the plane, then each horizontal line segment on the first rectangle maps to a horizontal line segment on the second one. Horizontal line segments correspond to loop curves on the colon surface. This gives the correspondence between the family of such loops on the supine and those on the prone. The mass center of a loop on the supine matches the mass center of the corresponding loop on the prone. The path of all such mass centers forms the centerline. Therefore, we obtain the correspondence between the two centerlines.
We assume the optical center of the camera is at the centerline as in a typical VC navigation. Suppose o is the optical center of the camera for supine, c is the point corresponding to o on the centerline of prone. Furthermore, the z-axis of the camera for supine intersects the surface at the point p0, and the y-axis intersects the supine at p1, then let q0 and q1 be the corresponding points on the prone. Then we can compute the frame of the camera on prone as follows:
then the camera frame is given by {c; e1, e2, e3}. These camera coordinates and frame are used by our GPU accelerated ray caster to render the final endoluminal images. Figure 12 demonstrates the consistent volume rendering results using this camera frame matching method. Then, the VC users can jump from a position on the supine to the same position on the prone.
Fig. 12.
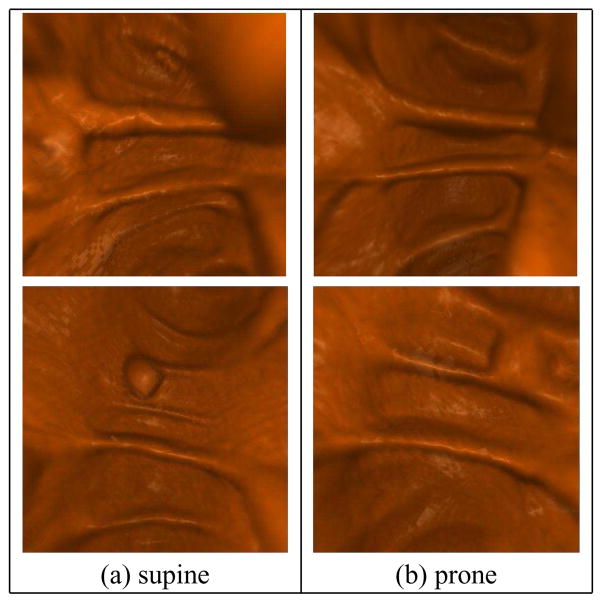
Consistent view for supine (a) and prone (b) colons. The last row shows a potential registration; the correspondence of a polyp neighborhood in both supine and prone colons can be found visually, within an acceptable distance (here, the 3D distance error is 7mm).
5 Experimental Results
We validate our algorithms using real VC colon data from the publicly available National Institute of Biomedical Imaging and Bioengineering (NIBIB) Image and Clinical Data Repository provided by the National Institute of Health (NIH). We perform electronic colon cleansing incorporating the partial volume effect [33], segmentation with topological simplification [13], and reconstruction of the colon surface via surface nets [7] on the original CT images in a pre-processing step. Though the size and resolution of each CT volume varies from dataset to dataset, the general data size is approximately 512 ×512 ×450 voxels and the general resolution is approximately 0.7 ×0.7 ×1.0 mm. In this paper, the colon surface is modeled as a topological cylinder and discretely represented by a triangular mesh.
We have developed our algorithms using generic C++ on the Windows XP platform. The linear systems in solving the Laplace equation are solved using the Matlab C++ library. All the experiments are conducted on a workstation with a Core 2 Quad 2.50GHz CPU with 4GB RAM. The colon surface used for our testing has 200K faces. Our method is efficient and effective. Both the conformal mapping and harmonic mapping have the liner computational complexity. Table 1 shows the statistics for the conformal mapping of each segment. Table 2 shows the computational time for supine and prone feature matching (including feature extraction) and harmonic map registration.
Table 1.
Statistics for conformal mapping.
| Colon | Segment | # Vertices | # Faces | Time(s) |
|---|---|---|---|---|
| Supine | Ascending (A) | 35,251 | 70,366 | 21 |
| Transverse (T) | 43,255 | 86,364 | 27 | |
| Descending (D) | 44,910 | 89,659 | 23 | |
| Sigmoid (S) | 37,237 | 74,296 | 22 | |
| Rectum (R) | 39,712 | 79,315 | 23 | |
| Prone | Ascending (A) | 36,629 | 73,139 | 20 |
| Transverse (T) | 42,452 | 84,781 | 25 | |
| Descending (D) | 44,587 | 88,981 | 26 | |
| Sigmoid (S) | 38,499 | 76,823 | 22 | |
| Rectum (R) | 38,177 | 76,276 | 23 | |
Table 2.
Computational time for supine and prone feature matching (including feature extraction) and harmonic map registration.
| Time (s) | A | T | D | S | R |
|---|---|---|---|---|---|
| Feature matching (FM) | 18 | 19 | 21 | 18 | 16 |
| Harmonic mapping (HM) | 10 | 11 | 12 | 10 | 10 |
We evaluate our registration results using two methods. The first is an objective analytic evaluation, whereby distances between corresponding points on the registered colons are calculated. The second method is a more subjective visual verification, whereby we observe the correct alignment of corresponding features in both flattened 2D views and endoluminal views using our consistent view camera mapping detailed in Section 4.5.
5.1 Analytic Registration Evaluation
Our first evaluation is a distance measurement between corresponding features located on the registered colon surfaces. Since our registration is in the 2D space using the flattened colon surfaces, a point (x, y, z) in ℝ3 on the original colon surface will be at a location (u, v) in ℝ2 on the registered surface. Thus, for a point p0 = (up, vp) on the supine colon surface and its corresponding point q0 = (uq, vq) on the prone colon surface, a perfect registration with zero error is present when up = uq and vp = vq. For two corresponding points, we compute the L2 norm of their 2D coordinates with the width of the flattened images fixed to a unit length of 1. Note that the width along the flattened image is equivalent to the colon circumference for that location.
We also compute the 3D distance error in millimeters. For the two corresponding points p0 and q0 in ℝ2, we know their locations r0 and s0 in ℝ3. If we take the supine surface (containing p0) as the truth and wish the measure the registration error on the prone surface (containing q0), we can identify the point p1 = (uq, vq) in ℝ2 on the supine surface and similarly its location r1 in ℝ3. The distance error in millimeters is then given to be |r1 − r0|.
We obtain the corresponding feature points for evaluation in two ways. The first is by manually identifying points of interest (e.g., a polyp) on both colon surfaces. We manually selected the center of polyps on the registered flat images. For the polyp shown in Figure 13, the distance error is 0.0265 in ℝ2 and 5.31 mm in ℝ3. We have evaluated our algorithm using a total of 20 pairs of polys on 6 datasets, and the average distance error is 0.0305 in ℝ2 and 5.65 mm in ℝ3.
Fig. 13.
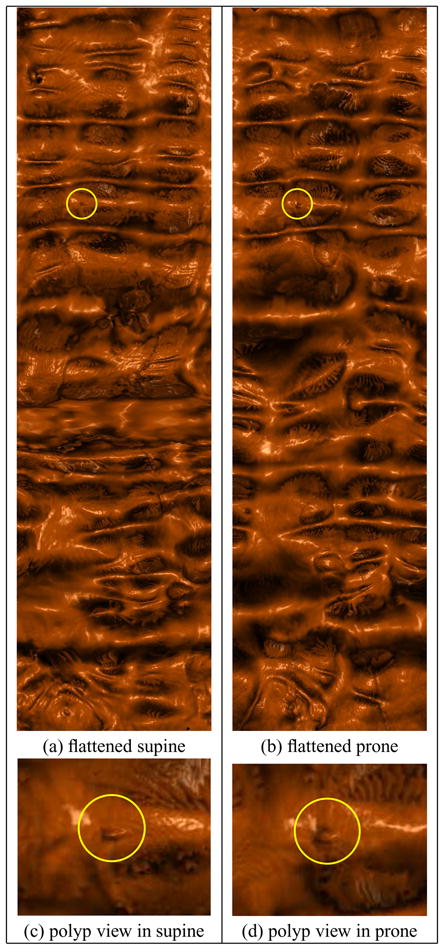
Visual verification for supine-prone registration by volume rendering (the high-resolution version of Figure 1). The zoomed-in images show the neighborhoods of the same polyp on the supine and the prone.
Our second method of finding corresponding points is to use a subset (half) of the features obtained from the feature extraction detailed in Section 4.3. We use these features for evaluation purposes, and only the remaining half are used in the harmonic mapping step. Note that this inherently reduces the quality of the registration, and thus a registration using all feature points will contain less error. We generally computed 16 pairs of features points for each segment, about 2 feature points along one folding with obvious correspondence (see Figure 10). For the registration shown in Figure 13, the distance error in terms of feature points evaluation is computed to be 0.0325 in ℝ2 and 7.51 mm in ℝ3. The average ℝ3 distance on 6 datasets is 7.85 mm.
Accuracy comparison
A comparison between our method and other methods can be performed using our analytic evaluation results in ℝ3. For those papers that present their distance error, we compare our results with their results in Table 3. Our method produces a registration with significantly smaller distance error between corresponding points than other registration methods.
Table 3.
Comparison of average millimeter distance error between our quasi-conformal method and other methods.
| Methods | Distance Error |
|---|---|
| Our Quasi-Conformal Mapping | 7.85 mm |
| Centerline registration + statistical analysis (Li et al., 2004 [21]) | 12.66 mm |
| Linear stretching/shrinking of centerline (Acar et al., 2001 [1]) | 13.20 mm |
| Centerline feature matching + lumen deformation (Suh & Wyatt., 2009 [26]) | 13.77 mm |
| Centerline point correlation (de Vries et al., 2006 [5]) | 20.00 mm |
| Taenia coli correlation (Huang et al., 2005 [15]) | 23.33 mm |
5.2 Visual Registration Verification
Perhaps a better indicator of the utility of our registration is a visual evaluation of the results, as this mimics most closely how the user of a VC system would use our results. For flattened volume rendering, the method we use is similar to that of Hong et al. [13]. We perform GPU accelerated ray casting through the original colon volume data, using the points on the flattened mesh as the ray entry points. The camera position is the approximate center of the colon with respect to each vertex. Rather than using the 3D centerline, this position is calculated from the flattened image, as discussed above. The variations between the corresponding flattened renderings in Figure 4 and especially between the consistent views in Figure 11 illustrate how much elastic deformation is present between the supine and prone surfaces. We present 3D endoluminal renderings of corresponding features in Figure 12. We also evaluate the registration by polyp detection, as shown in Figure 1 and its high-resolution version in Figure 13. The experiments show that the registration between the two scans is helpful for polyp detection and verification.
Fig. 1.

Visual verification for supine-prone registration. After registration, a polyp found on the flattened supine surface (yellow circle in (b)) can be located on the flattened prone surface (yellow circle in (c)) at nearly the same position. (b) and (c) are the flattened views of the ascending segments of the supine and the prone, respectively. (a) and (d) are zoom in to the neighborhoods of the same polyp on the supine and the prone, respectively.
5.3 Visualization of Quasi-Conformality
The elastic deformation between supine and prone is measured by the Beltrami coefficients in Eqn. 1 through the resulting registration. Basically, the quasi-conformal mapping deforms the circles to ellipses. Figure 14 illustrates that the deformation from supine to prone is quasi-conformal. A general fundamental domain is chosen for the supine segment S. We use its flat coordinates as the texture coordinates and compute the circle-packing texture mapping shown in (a), where the circularity is preserved. After registered to the flattened map of prone segment S, the supine planar image is changed and the circles are deformed to ellipses accordingly shown in (b). Using the one-to-one and onto mapping between supine and prone, we can efficiently compute the Beltrami coefficients on the triangular mesh surface. The quasi-conformality of the mapping is evaluated by the local stretching and angle distortion (see Figure 5). Their color encoded texture images are shown in (c) and (d), respectively. The maximal local stretching is 11, therefore called 11-Quasi-Conformal Mapping, mathematically.
Fig. 14.
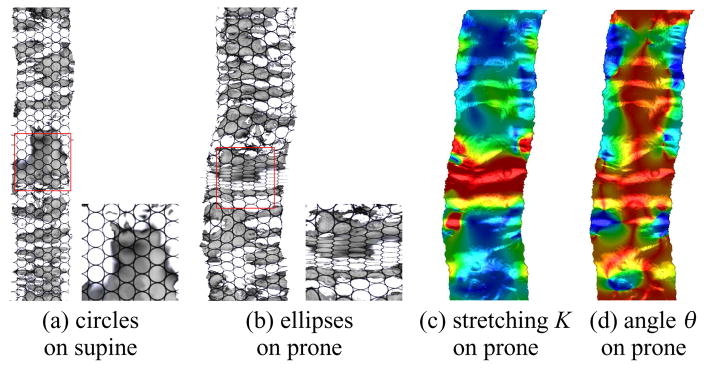
Visualization for quasi-conformality: circle fields on the source (supine) are mapped to ellipse field on the target (prone) by the registration map (see the zoomed-in views). The narrower ellipses correspond to the large stretching part (in red).
Morphing simulation
Based on the diffeomorphism constructed between supine and prone, we simulate the deforming process by the linearly interpolated morphing sequence. Then we transfer the texture coordinates to each intermediate mesh surface consistently. Through the texture correspondence, we can visually get a better understanding of how the deformation behaves from supine to prone and vice versa. After registration, the supine and prone have the same mesh connectivity, but different geometry. As shown in Figure 15, the morphing views sp1, sp2, sp3 between supine and prone are generated by the linear interpolation of geometry on each vertex. Directly from the stretching-colored views (a), one can easily comprehend where the main deformation happens. The global surface distortion is mainly effected by the local stretching deformation, valued by the ratio between the long axis and short axis of the ellipse locally. The local angle distortion, however, is intrinsic to the material properties of the organ muscle and tissue. Compared with the stretching, the angle distribution is more uniform through the whole deformation, as shown in (c). Here, the red color denotes the largest stretching (angle distortion), blue color the lowest stretching, and yellow and green in between. The consistent texture mapping by checker-board (b) and circle-packing (d) textures also demonstrates the quasi-conformality of the deformation.
Fig. 15.
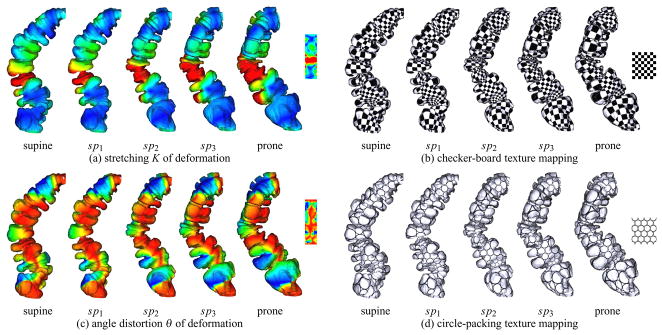
Visualization of Beltrami coefficients. The morphing views sp1, sp2, sp3 of geometry between supine and prone are generated by the linear interpolation of the one-to-one registration. The deformation is simulated on the colon segment geometry and four consistent textures are mapped to it to illustrate the corresponding parts of the geometry. In (a) and (c), red indicates the largest stretching/angle distortion and blue indicates the least. The quasi-conformality of the deformation is visualized by the sequences (b) and (d).
5.4 Analysis and Discussion
The deformation between supine and prone of the colon surface is elastic, and from physics, elastic deformations are quasi-conformal. Therefore, in principle, our geometric model comes from real physics. Intuitively, the deformation at each point is determined by the elasticity properties of the colon surface, and are fully represented by the Beltrami coefficients. The physical property is fully encoded in the Beltrami coefficient function.
Previous works have most often focused on centerline alignment. The ground truth for colon deformation is the whole surface deformation, the centerline only conveys very limited information. Since our method uses this surface instead of the centerline, it is expected that we achieve better results than the more crude centerline methods, which has been proved in Table 3.
The global deformation method in fact is to define a deformation field for the whole volume, which includes the volume inside the colon surface. Our method focuses on the intrinsic surface deformation itself. In reality, different colon surface parts can touch each other, this kind of deformation cannot be captured by the method in [26], but can be perfectly represented by our model. In addition, volumetric deformation requires much higher storage requirements, and the resolution of the deformation field on the surface is much lower. Our method only considers the surface, and thus it has much more efficient storage and much higher resolution for the conformal field.
6 Conclusions
Shape registration is very fundamental for shape analysis problems, especially for illness and abnormality detection in medical applications. We introduce an efficient framework for the registration of supine and prone colons, through the use of conformal geometry, to improve the accuracy of polyp detection. We automatically extract the anatomical landmarks, namely the taenia coli and the flexures, for consistent segmentation. We then conformally flatten the colon surfaces to the rectangular domain using holomorphic differentials. The feature points are automatically detected from the mean-curvature encoded images using the graph cut segmentation, and their correspondence between supine and prone are obtained by the graph matching. These feature constraints are used to align the flattened domains by adjusting the conformal mapping to be quasi-conformal through the harmonic map. We demonstrate the efficiency of our method by both the analytic evaluation and the 2D and 3D consistent registration views. The Beltrami coefficients is employed to analyze the physical deformation of the colon muscle and tissue. To the best of our knowledge, this is the first work to use geometric mapping method for supine and prone colon surface registration problem. In the future, we will investigate the volumetric mapping for the registration of volume colons.
Footnotes
For information on obtaining reprints of this article, please send to: tvcg@computer.org.
Contributor Information
Wei Zeng, Email: zengwei@cs.sunysb.edu.
Joseph Marino, Email: jmarino@cs.sunysb.edu.
Krishna Chaitanya Gurijala, Email: gkrishna@cs.sunysb.edu.
Xianfeng Gu, Email: gu@cs.sunysb.edu.
Arie Kaufman, Email: ari@cs.sunysb.edu.
References
- 1.Acar B, Napel S, Paik DS, Li P, Yee J, Jeffrey RB, Jr, Beaulieu C. Medial axis registration of supine and prone CT colonography data. Proc of Engineering in Medicine and Biology Society (EMBS) 2001 Oct;:2433–2436. [Google Scholar]
- 2.Boykov Y, Kolmogorov V. An experimental comparison of min-cut/max-flow algorithms for energy minimization in vision. IEEE Transactions on Pattern Analysis and Machine Intelligence. 2004 Sep;26(9):1124–1137. doi: 10.1109/TPAMI.2004.60. [DOI] [PubMed] [Google Scholar]
- 3.Center MM, Jemal A, Smith RA, Ward E. Worldwide variations in colorectal cancer. CA: A Cancer Journal for Clinicians. 2009 Nov-Dec;59(6):366–378. doi: 10.3322/caac.20038. [DOI] [PubMed] [Google Scholar]
- 4.Chowdhury AS, Yao J, Vanuitert R, Linguraru M, Summers R. Detection of anatomical landmarks in human colon from computed tomographic colonography images. 19th International Conference on Pattern Recognition (ICPR); Dec, 2008. pp. 1–4. [Google Scholar]
- 5.de Vries AH, Truyen R, van der Peijl J, Florie J, van Gelder RE, Gerritsen F, Stoker J. Feasibility of automated matching of supine and prone CT-colonography examinations. British Journal of Radiology. 2006 Sep;79:740–744. doi: 10.1259/bjr/55953054. [DOI] [PubMed] [Google Scholar]
- 6.Desbrun M. Discrete differential forms and applications to surface tiling. Proceedings of the Twenty-Second Annual Symposium on Computational Geometry; 2006. pp. 40–40. [Google Scholar]
- 7.Gibson SFF. Constrained elastic surface nets: Generating smooth surfaces from binary segmented data. Proc. of MICCAI; 1998. pp. 888–898. [Google Scholar]
- 8.Gortler SJ, Gotsman C, Thurston D. Discrete one-forms on meshes and applications to 3D mesh parameterization. Computer Aided Geometric Design. 2005;23(2):83–112. [Google Scholar]
- 9.Gu X, Wang Y, Chan TF, Thompson PM, Yau ST. Genus zero surface conformal mapping and its application to brain surface mapping. IEEE Trans Med Imaging. 2004;23(8):949–958. doi: 10.1109/TMI.2004.831226. [DOI] [PubMed] [Google Scholar]
- 10.Gu X, Yau S-T. Global conformal parameterization. Symposium on Geometry Processing; 2003. pp. 127–137. [Google Scholar]
- 11.Hong L, Muraki S, Kaufman A, Bartz D, He T. Virtual voyage: Interactive navigation in the human colon. Proc. of SIGGRAPH; 1997. pp. 27–34. [Google Scholar]
- 12.Hong W, Gu X, Qiu F, Jin M, Kaufman A. Conformal virtual colon flattening. ACM Symposium on Solid and Physical Modeling; 2006. pp. 85–93. [Google Scholar]
- 13.Hong W, Qiu F, Kaufman A. A pipeline for computer aided polyp detection. IEEE Transactions on Visualization and Computer Graphics. 2006 Sep;12(5):861–868. doi: 10.1109/TVCG.2006.112. [DOI] [PubMed] [Google Scholar]
- 14.Horner MJ, Ries LAG, Krapcho M, Neyman N, Aminou R, Howlader N, Altekruse SF, Feuer EJ, Huang L, Mariotto A, Miller BA, Lewis DR, Eisner MP, Stinchcomb DG, Edwards BK, editors. SEER cancer statistics review. National Cancer Institute; 1975–2006. [Google Scholar]
- 15.Huang A, Roy D, Franaszek M, Summers RM. Teniae coli guided navigation and registration for virtual colonoscopy. Proc of IEEE Visualization. 2005 Oct;:279–285. [Google Scholar]
- 16.Huang A, Roy DA, Summers RM, Franaszek M, Petrick N, Choi JR, Pickhardt PJ. Teniae coli-based circumferential localization system for CT colonography: Feasability study. Radiology. 2007 May;243(2):551–560. doi: 10.1148/radiol.2432060353. [DOI] [PubMed] [Google Scholar]
- 17.Jiang G, Gu L. 27th Annual International Conference of the Engineering in Medicine and Biology Society. [Google Scholar]
- 18.Jin M, Wang Y, Yau S-T, Gu X. Optimal global conformal surface parameterization. IEEE Visualization. 2004:267–274. [Google Scholar]
- 19.Johnson CD, Dachman AH. CT colography: The next colon screening examination. Radiology. 2000;216(2):331–341. doi: 10.1148/radiology.216.2.r00au47331. [DOI] [PubMed] [Google Scholar]
- 20.Lamy J, Summers RM. Tenia coli detection from colon surface: Extraction of anatomical markers for virtual colonoscopy. Proc. of the Third Annual Symposium on Visual Computing; 2007. pp. 199–207. [Google Scholar]
- 21.Li P, Napel S, Acar B, Paik DS, Jeffrey RB, Jr, Beaulieu CF. Registration of central paths and colonic polyps between supine and prone scans in computed tomography colonography: Pilot study. Medical Physics. 2004 Oct;31(10):2912–23. doi: 10.1118/1.1796171. [DOI] [PubMed] [Google Scholar]
- 22.Li X, Bao Y, Guo X, Jin M, Gu X, Qin H. Globally optimal surface mapping for surfaces with arbitrary topology. IEEE Trans on Visualization and Computer Graphics. 2008;14(4):805–819. doi: 10.1109/TVCG.2008.32. [DOI] [PubMed] [Google Scholar]
- 23.Nain D, Haker S, Grimson WEL, Cosman E, Jr, Wells WW, Ji H, Kikinis R, Westin CF. Intra-patient prone to supine colon registration for synchronized virtual colonoscopy. Proc. of MICCAI; 2002. pp. 573–580. [Google Scholar]
- 24.Näppi J, Okamura A, Frimmel H, Dachman A, Yoshida H. Region-based supine-prone correspondence of false-positive CAD polyp candidates in CT colonography. Academic Radiology. 2005;12:695–707. doi: 10.1016/j.acra.2004.12.026. [DOI] [PubMed] [Google Scholar]
- 25.Plishker W, Shekhar R. Virtual colonoscopy registration regularization with global chainmil. Proc. of MICCAI Workshop on Virtual Colonoscopy; 2008. pp. 116–121. [Google Scholar]
- 26.Suh JW, Wyatt CL. Deformable registration of supine and prone colons for computed tomographic colonography. Journal of Computer Assisted Tomography. 2009 Nov;33(6):902–911. doi: 10.1097/RCT.0b013e3181a7e2c1. [DOI] [PubMed] [Google Scholar]
- 27.Tewari G, Gotsman C, Gortler SJ. Meshing genus-1 point clouds using discrete one-forms. Comput Graph. 2006;30(6):917–926. [Google Scholar]
- 28.Tong Y, Alliez P, Cohen-Steiner D, Desbrun M. Designing quad-rangulations with discrete harmonic forms. Symposium on Geometry Processing; 2006. pp. 201–210. [Google Scholar]
- 29.Torresani L, Kolmogorov V, Rother C. Feature correspondence via graph matching: Models and global optimization. Proc. of European Conference on Computer Vision (ECCV); 2008. pp. 596–609. [Google Scholar]
- 30.Umemoto Y, Oda M, Kitasaka T, Mori K, Hayashi Y, Suenaga Y, Takayama T, Natori H. Extraction of teniae coli from CT volumes for assisting virtual colonoscopy. Proc SPIE Medical Imaging. 2008;6916:69160D. [Google Scholar]
- 31.van Ravesteijn V, Zhao L, Botha C, Post F, Vos F, van Vliet L. Combining mesh volume and streamline representations for polyp detection in ct colonography. Proc. of International Symposium on Biomedical Imaging (ISBI); 2009. pp. 907–910. [Google Scholar]
- 32.Wang S, Wang Y, Jin M, Gu XD, Samaras D. Conformal geometry and its applications on 3D shape matching, recognition, and stitching. IEEE Trans Pattern Anal Mach Intell. 2007;29(7):1209–1220. doi: 10.1109/TPAMI.2007.1050. [DOI] [PubMed] [Google Scholar]
- 33.Wang Z, Liang Z, Li L, Li B, Eremina D, Lu H. An improved electronic colon cleansing method for detection of colonic polyps by virtual colonoscopy. IEEE Transactions on Biomedical Engineering. 2006 Aug;53(8):1635–46. doi: 10.1109/TBME.2006.877793. [DOI] [PMC free article] [PubMed] [Google Scholar]
- 34.Zeng W, Zeng Y, Wang Y, Yin X, Gu X, Samaras D. 3D non-rigid surface matching and registration based on holomorphic differentials. The 10th European Conference on Computer Vision (ECCV); 2008. pp. 1–14. [Google Scholar]


