Abstract
Superior cell culture models for hepatitis B virus (HBV) will help advance insights into host-virus interactions. To identify mechanisms regulating HBV replication, this study used cultured human HepG2 cells and adult or fetal hepatocytes transduced with adenoviral vector to express HBV upstream of green fluorescent protein. The vector efficiently transduced all cell types. In HepG2 cells, replicative viral intermediates, nucleocapsid-associated HBcAg, and HBsAg were expressed. However, in fetal or adult hepatocytes, pregenomic HBV RNA and viral RNAs were expressed, but nucleocapsid-associated HBcAg in cells or HBsAg in culture medium were absent, indicating interruptions in viral replication due to possible microRNA-related interference. MicroRNA profiling demonstrated that a large number of microRNAs with antiviral potential were differentially expressed in hepatocytes after culture. In transfection assays using HepG2 cells, candidate antiviral microRNAs, e.g., hsa-miR-24 or hsa-miR-638 decreased the levels of HBV transcripts or HBV gene products. Since candidate microRNAs could have targeted interferon response genes as an alternative explanation interferon signaling was examined. However, HBV replication in cultured hepatocytes was not restored despite successful inhibition of JAK1/2-STAT signaling by the inhibitor, ruxolitinib. Therefore, HBV was unable to complete replication in cultured hepatocytes due to expression of multiple antiviral microRNAs. This mechanism should help understand restrictions in HBV replication for developing HBV models in cultured cells while providing frameworks for pathophysiological studies of HBV replication in subsets of hepatocytes or stem/progenitor cells during hepatitis.
Keywords: hepatitis, liver, gene expression, interaction
INTRODUCTION
The ability to use hepatocytes as cell culture models for hepatitis B virus (HBV) for basic studies and antiviral therapeutics is important. However, work over past several decades established that in cultured hepatocytes, HBV either does not complete replication leading to virion production or replicates only transiently and that too at extremely low levels [Shimizu et al., 1986; Gripon et al., 1988; Ochiya et al., 1989]. This nonpermissiveness of cultured hepatocytes for establishment of HBV replication with productive viral infection and/or viral persistence has been puzzling because of the otherwise extensive hepatotropism of HBV and susceptibility of nonimmune people or correct animals to the rapid establishment of productive HBV infection.
To meet the need for suitable and convenient HBV models in vitro, various cell lines were examined previously for the ability to support HBV replication. Remarkably, HBV infection of hepatic cell lines again proved difficult, and eventually stable transfectants of hepatocellular carcinoma (HCC) cell lines had to be used, e.g., from HepG2, HuH-7 or HepaRG cells [Sells et al., 1987; Tsurimoto et al., 1987; Gripon et al., 2002; Sun and Nassal, 2006]. However, the nature of molecular differences in these cell clones versus primary hepatocytes was not understood. Later, chimeric HBV constructs with envelope proteins from alternative viruses were utilized, e.g., HBV vectors containing baculoviral or adenoviral envelopes [Delaney and Isom, 1998; Zhang et al., 2004]. These chimeric viral vectors efficiently transduced hepatocytes but still HBV replication was largely restricted to selected permissive cell lines, such as HepG2 cells [Kumar et al., 2012]. Therefore, intracellular factors likely contributed antiviral roles. This possibility was emphasized by restriction of HBV gene expression in transgenic mice to specific cell types despite presence of HBV genomes in cells throughout the body [Aragona et al., 1996]. Further analysis of transfected HBV constructs in permissive (hepatocytes) or nonpermissive (fibroblasts) cells indicated that intracellular factors exerting antiviral activity retained dominance in their somatic cell fusion products [Ott et al., 1999]. In those studies, co-transfection of hepatic transcription factors, e.g., C/EBP or HNF-3, was insufficient for overcoming extinction of HBV gene expression in nonpermissive cells, indicating that factors interfering with HBV gene expression were other than transcription factors.
More recently, intracellular microRNAs (miRNA) were identified to be potent regulators of HBV gene expression in hepatocytes and hepatic stem/progenitor cells [Zhang et al., 2010; Chen et al., 2011; Potenza et al., 2011; Dai et al., 2014; Kohno et al., 2014; Mosca et al., 2014]. Investigators proposed that differences in miRNA expression will be helpful for pathophysiological studies and biomarker development in chronic hepatitis B or HBV-associated HCC [Li et al., 2010; Giray et al., 2014]. Transcriptional reprogramming due to cell culture-related alterations could extend to cellular miRNA expression, as observed during epithelial-to-mesenchymal switches, alterations in cytokine signaling or transcription factor abundances, and other processes [Parent et al., 2004; Lucifora et al., 2010; Sakai et al., 2010]. Recently, TGF-β or bone morphogenetic protein (BMP) receptor-mediated signaling was found to affect HBV replication in HepG2 cells via SMAD-4, which regulates expression of cellular mRNAs as well as miRNA [Park et al., 2012]. On the other hand, alterations in cellular interferon responses might additionally account for interference with HBV replication, as was observed in HepaRG cells [Lucifora et al., 2010].
In this study, to understand the role of native cellular miRNA in HBV replication, we used mature (adult) and immature (fetal) human hepatocytes in culture. To avoid confounding due to HBV infection, cultured cells were transduced with an adenoviral HBV vector (AdHBV) [Zhang et al., 2004; Kumar et al., 2012; Park et al., 2012]. Incorporation of a distal read-through green fluorescent protein (GFP) reporter in this vector provides convenient means to verify that cells have been transduced and viral transgene is expressed [Zhang et al., 2004]. HepG2 cells were used in this study since these are permissive for HBV replication and the 2.2.15 subclone derived from these cells [Sells et al., 1987], has been used widely for studies.
MATERIALS AND METHODS
Adenoviral HBV Vector
The AdHBV vector was obtained from T.J. Liang (NIDDK, Bethesda, MD) [Zhang et al., 2004] and grown in HEK293 cells by Vector Laboratory (Philadelphia, PA). Cells were cultured for 2 hr with AdHBV in 10–100 multiplicities of infection (moi) with medium lacking serum, washed repeatedly with phosphate buffered saline, pH 7.4 (PBS), followed by culture in serum for 72 hr before assays for HBV were performed.
Cells
HepG2 cells were from American Type Culture Collection (ATCC, Manassas, VA). Cryopreserved adult human hepatocytes (AH) were from ADMET Technologies Inc. (Durham, NC). Fetal hepatocytes (FH) were isolated and cultured as described previously [Inada et al., 2008]. Immortalized FH with stem/progenitor properties, designated hTERT-FH-B cells, were as described previously [Wege et al., 2003]. The Institutional Review Board approved use of human material. Cells were cultured in Dulbecco’s Minimum Essential Medium with 10% fetal bovine serum and antibiotics (DMEM). For elucidating JAK/STAT activity, cells were cultured for 72 hr with 10–20 ng/ml pegylated interferon-alfa2b (Schering-Plough Corp., Kenilworth, NJ). For JAK1/ 2 inhibition, hTERT-FH-B cells were plated for 24 hr with 20–40 nM ruxolitinib (LC Labs, Woburn, MA), followed by transduction with Ad-HBV, and culture for another 72 hr with fresh ruxolitinib every 24 hr.
Cell Viability
Cells were plated in 48-well dishes and incubated for 60 min with 0.5 mg/ml thiazolyl blue dye (MTT) (Sigma Chemical Co., St. Louis, MO). Dye reduction was analyzed as described previously [Cho et al., 2004].
HBV Replication
For core particles, 50 µg each of total cellular proteins were resolved in 1.2% agarose in Tris-buffered EDTA, as described previously [Melegari et al., 2005], and transferred to nylon membranes (Ambion, Austin, TX) in 10mM Tris-HCl, pH 7.5, 150 mM NaCl, 1mM EDTA (TNE buffer). Blots were probed with polyclonal anti-HBc (1:500; Dako Corp., Carpinteria, CA), incubated with peroxidase-conjugated IgG (Sigma Chemical Co.), and detected by chemiluminescence (Perkin Elmer Life Sciences, Waltham, MA). For HBV DNA Southern blot, cells were lysed in 50mM Tris-HCl, pH 8.0, 10mM EDTA, 150mM NaCl, and 1% SDS. Protein-detergent complexes were precipitated in 2.5M KCl, dissolved in Tris-EDTA, and digested by proteinase K (Ambion) for 1 hr at 37 °C. Viral DNA was extracted with phenol-chloroform and precipitated in ethanol followed by electrophoresis of 20 µg total DNA in 1.2% agarose gels. Full-length nonradioactive HBV DNA probes were generated by EcoRI digestion of pCP10 plasmid [Dubois et al., 1980] using Psoralen-Biotin labeling (Ambion). After denaturation and neutralization, DNA was transferred to nylon membranes (Ambion), crosslinked by ultraviolet light, and hybridized with HBV DNA probe as described previously [Kumar et al., 2012].
HBV RNAs
Total cellular RNA was isolated by Trizol Reagent (Invitrogen, Carlsbad, CA). For northern blot, 20µg RNAs were resolved in 1% formaldehyde-agarose gel and transferred to nylon membranes (Ambion). Blots were hybridized with HBV DNA probe followed by human glyceraldehyde-3-phosphate dehydrogenase (GAPDH) DNA probe, as described previously [Kumar et al., 2012]. For pregenomic (pg) HBV RNA, we used quantitative real-time PCR with QuantiTech SYBR Green PCR Master-mix (Qiagen) in Eppendorf Real-Time PCR machine (Eppendorf, Hamburg, Germany) as described previously [Laras et al., 2002; Jammeh et al., 2008]. The cDNA samples were amplified as follows: denaturation at 95 °C × 15 min with 45 cycles of 94 C × 15 sec, 60 °C × 30 sec, and 72 °C × 30 sec. Data were acquired at 80 °C for 15 sec to check for the specificity of PCR products. Primers were: (a) PCP for Pre-Core RNA (5′-GGTCTGCGCACCAGCACC-3′; HBV nt 1796–1813); (b) PGP for both Pre-Core RNA and Pg RNA (CACCTCTGCCTAATCATC-3′; HBV nt 1826–1843); and; (c) M3, which binds upstream of basal core promoter for excluding residual contaminating HBV DNA molecules (5′-CTGGGAGGAGTTGGGGGAGGA-GATT-3′; HBV nt 1730–1754). The common reverse primer for these was BC1 (5′-GGAAAGAAGTCA-GAAGGCAA-3′, HBV nt 1974–1955). The expected product sizes for Pre-Core RNA alone and for Pre-Core plus Pg RNA were 178-bp and 148-bp in size, respectively. Contaminating DNA molecules will have produced a 244-bp size fragment. The pgRNA level was determined by subtracting the level of Pre-Core RNA from that of Pre-Core plus Pg RNA, as described previously [Laras et al., 2002].
HBV Proteins
Cells were fixed in methanol for 10 min at −20 °C, blocked in 10% goat serum in PBS for 1 hr, and incubated overnight with anti-HBc (Dako Corp. TX) at 4 °C. This was followed by incubation with Alexa Fluor 633-linked anti-rabbit goat IgG (Life Technologies, Norwalk, CT) for 1 hr at room temperature and counterstaining with 4’,6-diamidino-2-phenylindole (DAPI). For HBcAg western analysis, 50 µg of total proteins were separated by 15% SDS-polyacrylamide gel electrophoresis (PAGE) and transferred to PVDF membranes (Millipore Corp., Billerica, MA). Membranes were blocked with nonfat milk, incubated in anti-HBc (Dako Corp.) or anti β-tubulin antibodies (Sigma Chemical Co.), followed by peroxidase-conjugated antibodies (Sigma Chemical Co.) with detection using enhanced chemiluminescence (Perkin Elmer Life Sciences, Waltham, MA). Cell culture medium was harvested 3d after transduction with AdHBV and presence of HBsAg was analyzed by immunoassay in clinical laboratory of Montefiore Medical Center, Bronx, NY.
Cellular Gene Expression
Total RNA was isolated by Trizol Reagent from primary FH or AH and from FH, AH, and hTERT-FH-B cells after these had been cultured in plastic dishes for several days. The samples were analyzed for expression of 470 miRNAs (Sanger database, versions 9.1 and 11.0) at LC Sciences (Dallas, TX). The background signals were subtracted with regression-based mapping on 5–25% of lowest intensity data points excluding blank spots. Transcripts with undetectable signals less than 3x background, incorporating spot analysis parameters, were removed. This was followed by exclusion of transcripts with <500 arbitrary signals from the analysis, as recommended by LC Sciences, since those are not detectable by qRT-PCR. The data for signal intensity were transformed to log2 by using the denominator of 500 arbitrary signal across the data matrix followed by cluster (Cluster3, Stanford University, CA) and heat-map (JavaTree1.1.6r2) analysis [Eisen et al., 1998; Saldanha, 2004]. The final list of transcripts was examined for consistency in miRNA expression patterns across cell types and miRNA not expressed in all cell types were removed. Transcripts of interest were aligned with HBV subtype ayw (GeneBank X65257.1) by RNAHybrid software [Rehmsmeier et al., 2004].
Small RNAs were quantitated by qRT-PCR with QuantiMir RT Kit (System Biosciences, Mountain View, CA). Briefly, RNAs were anchor-tailed with poly-A-polymerase, followed by oligo dT annealing, and RT for 60 min at 42 °C. SYBR Green assays used forward primers from sense strands of mature miRNA and universal reverse primer (System Biosciences) in Realplex Mastercycler (Eppendorf). Cycle thresholds (Ct) were normalized with RNU-43 RNA (Applied Biosystems Inc., Foster City, CA). Relative gene expression was determined by 2−ΔΔCt method.
Analysis of cellular mRNA expression in FH used Affymetrix U133 Plus 2.0 arrays and was described previously [Inada et al., 2008]. These results were probed for pathway-specific changes, including miRNA targets, by IPA tools (Ingenuity Systems Inc., Redwood, CA).
miRNA Transfections
Double-stranded synthetic oligoribonucleotide miRNA mimics and antagonists were procured from Dharmacon (Thermo Fisher Scientific, Lafayette, IN). Oligonucleotides were reconstituted in nuclease-free water. Unless specified, cell transfections used lipofectamine 2,000 reagent (Life Technologies, Carlsbad, CA) with incubation of miRNA in Optimem medium for 5 min followed by incubation for another 20 min at room temperature. Cells were transfected with lipid-miRNA complex for 6 hr and cultured further as necessary.
Luciferase Assays for HBV Expression in psi-CHECK™-2 Vector
Full-length HBV genome was PCR-amplified from pCP10 HBV plasmid [Dubois et al., 1980] with following primers: forward, 5′-GGCGTTTAAACAAT-TCCACAACCTTTCACCA; reverse, 5′- GGCGCGGCC-GCCCACTGCATGGCCTGAG, including PmeI and NotI sites, respectively. PCR used Phusion DNA Polymerase (M0531S, New England Biolabs, Ipswich, MA). Initial denaturation was at 98 °C × 2 min followed by 40 cycles of 98 °C × 30 s, annealing at 65 ° C × 60 sec, and elongation at 72 °C × 3 min; and final elongation at 72 °C for 10 min. The amplicon was sequence-verified and cloned into PmeI and NotI sites of psiCHECK™-2 vector (C8021, Promega, Madison, WI). This allowed SV40 promoter-regulated HBV transcription with Renilla luciferase reporter. HepG2 cells, 1 × 10⁴ per well of 96-well dishes, were transfected with 25 ng of HBV-psiCHECK™-2 and Lipofectamine LTX (Invitrogen, Carlsbad, CA) according to manufacturer, along with miRNA mimics (20, 50, or 100 nM) or antagonists (50 or 100 nM). Each condition was in quadruplicate. Empty psiCHECK 2 vector was used for background. Transfection efficiency was evaluated separately by GFP plasmid under similar conditions [Follenzi et al., 2002]. After 24 hr, the activity in HBV-psiCHECK™-2 plasmid of Renilla and firefly luciferases reporting on HBV expression and transfection efficiency, respectively, were measured by FLUOstar OPTIMA luminometer (BMG Labtech, Cary, IN) with Dual-Luciferase® Reporter (DLR™ ) Assay System (E1960, Promega), as recommended by manufacturer.
Western Blot for STAT-1
Fifty microgram total proteins were separated by 12% SDS-PAGE and transferred to PVDF membrane. Membrane was blocked with nonfat dry milk and probed with antibodies for phospho-STAT-1 (TYR701, Cell Signaling, Danvers, MA), total STAT-1 (Cell Signaling) or β-tubulin (Sigma, St. Louis, MO), followed by peroxidase-conjugated secondary antibodies (Sigma) for enhanced chemiluminescence (Perkin Elmer Life Sciences).
Statistical Methods
Data are shown as means ± SEM and were analyzed by Pearson correlations, t-tests or analysis of variance (ANOVA) with GraphPad Prism5 (Graph-Pad Software, La Jolla, CA). P < 0.05 was considered significant.
RESULTS
HBV Replication
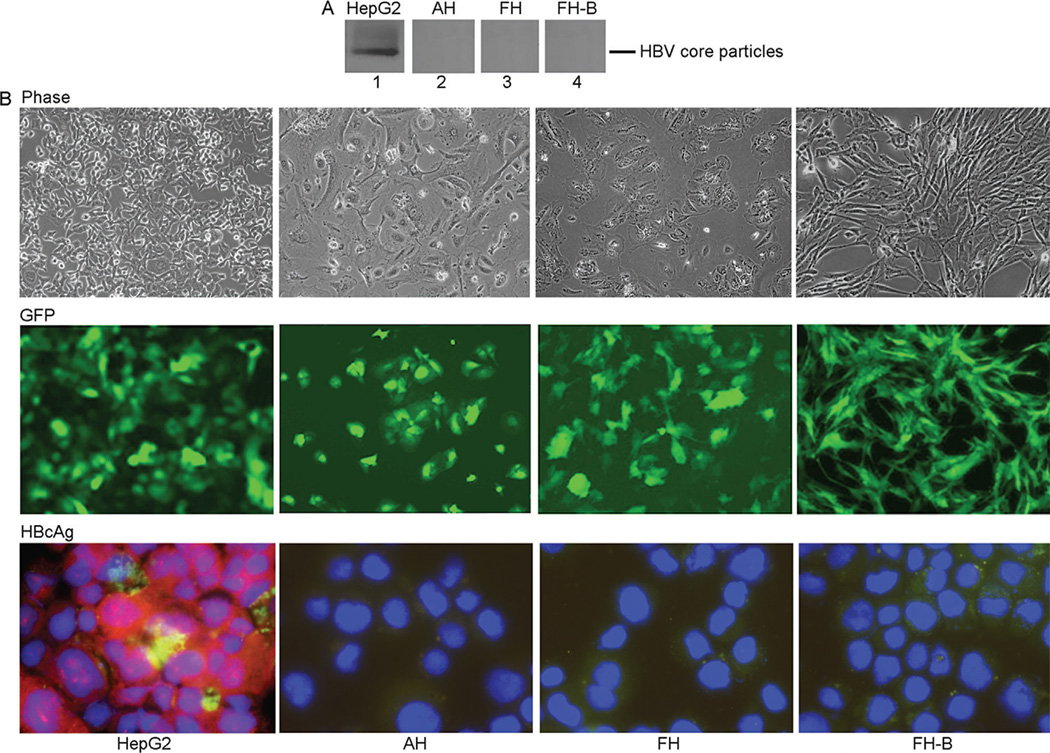
The native agarose gel assay identified production of HBV core particles in HepG2 cells but not in primary cultures of AH, FH, or hTERT-FH-B cells after transduction with 10moi of AdHBV (Fig. 1A). The AdHBV transductions were highly efficient because GFP was expressed in 95–100% of all cell types (Fig. 1B). Moreover, HBcAg staining confirmed presence of HBV core particles in most of the HepG2 cells. By contrast, HBcAg staining was negative in AH, FH, or hTERT-FH-B cells despite widespread GFP expression. This indicated that the HBV construct was successfully transcribed in all cell types but with production of HBV core particles in only HepG2 cells. Transduction of AH, FH, or hTERT-FH-B cells with more AdHBV, i.e., moi of 50 and 100, did not change these results because GFP was well-expressed but HBcAg was still absent. The cell viability was unaffected after cell transduction with AdHBV as indicated by MTT assays (not shown).
Fig. 1.
HBV replication in AdHBV-transduced cells. (A) Agarose gel assay for abundance of HBV core particles 72 hr after AdHBV transduction. Equal amounts of proteins were loaded for each sample. The findings indicated that HBV replicated in HepG2 cells (lane 1) and not in AH, FH, or hTERT-FH-B cells (lanes 2–4). (B) AdHBV-transduced cells remained healthy as shown by phase contrast microscropy (top). GFP expression in virtually all cells confirmed AdHBV was successfully transduced and HBV-GFP transgenes was efficiently expressed (middle). Immunostaining for HBcAg (red color) verified HBV replicated in only HepG2 cells (bottom). Cells were transduced with 50moi of AdHBV. (Original magnification ×100 (Phase, GFP) and ×630 (HBcAg)).
Expression of HBV mRNAs and DNA in AdHBV-Transduced Cells
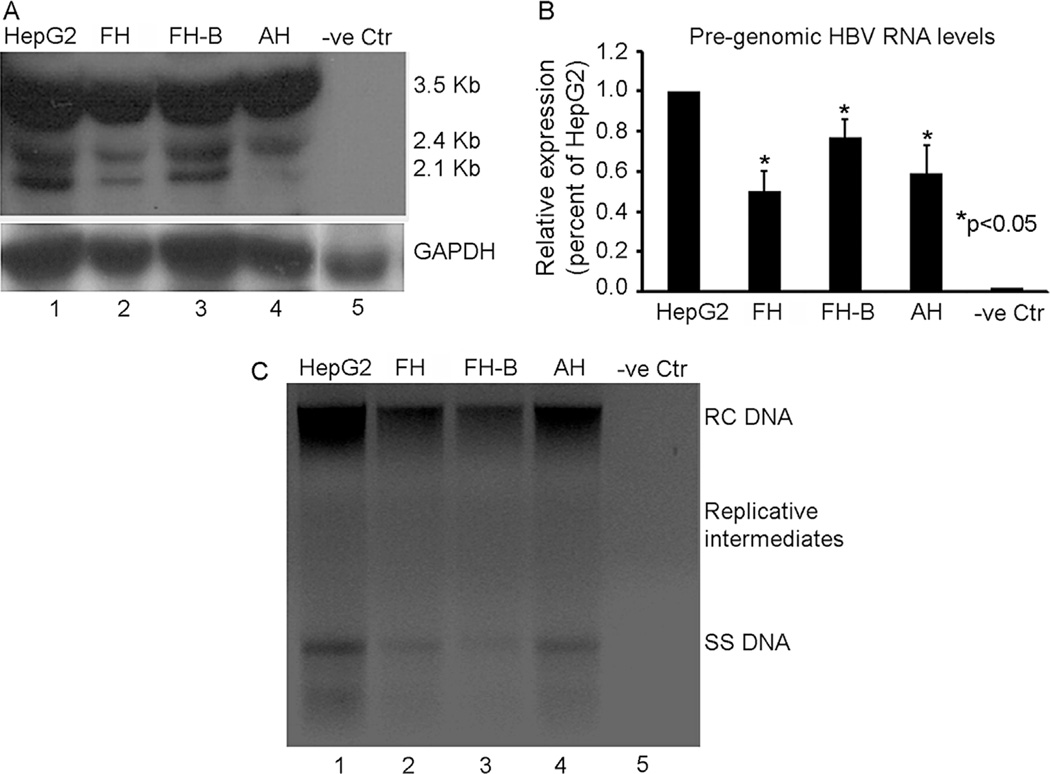
Transcription of HBV DNA is required for generation of full-length pregenomic HBV RNA before viral replication may proceed. Northern blot identified 3.5 kb full-length as well as 2.4 and 2.1 Kb sized smaller HBV transcripts in AdHBV-transduced HepG2, AH, FH, and hTERT-FH-B cells (Fig. 2A). However, qRT-PCR showed lower levels of pregenomic HBV RNA in FH, hTERT-FH-B cells, and AH compared with HepG2 cells (Fig. 2B). Southern blot confirmed appearance of relaxed circular (RC), single-stranded (SS), and replicative HBV DNA forms in HepG2 cells (Fig 2C). However, HBV DNA content was lower and replicative forms of the virus were not prominent in AH, FH, and hTERT-FH-B cells. Moreover, while HBsAg was detected in culture medium collected from AdHBV-transduced HepG2 cells, this was not the case in culture medium collected from hTERT-FH-B cells (see data below), which suggested additional interference in viral gene expression. Therefore, these differences in viral gene expression suggested possible roles for cellular miRNA in cultured AH, FH, and hTERT-FH-B cells with absence of HBcAg or HBsAg expression.
Fig. 2.
HBV replication status in Ad-HBV-transduced cells. (A) Northern blot of total cellular RNA with 3.2kb as well as 2.4/2.1kb HBV mRNAs in HepG2 cells (lane 1), FH, hTERT-FH-B, and AH (lanes 2–4). (B) Pregenomic HBV mRNA levels were lower in FH, hTERT-FH-B, or AH compared with HepG2 cells, P<0.05. (C) Southern blot with relaxed-circular (RC), single-stranded (SS), and intermediate replicative forms of HBV DNA in HepG2 cells (lane 1), whereas HBV DNA was less abundant in FH, hTERT-FH-B, and AH cells (lanes 2–4). Cells were transduced with 50moi of AdHBV in all studies.
Differential miRNA Expression
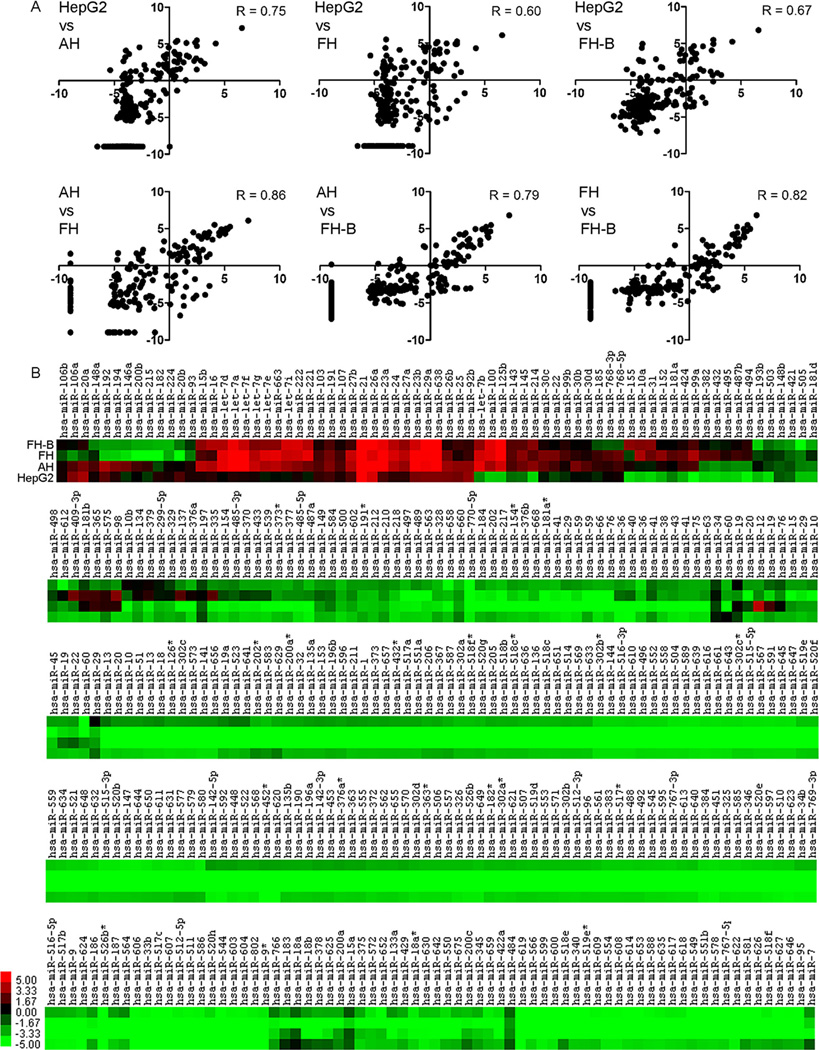
The profiles of miRNA expression in HepG2 and AH, FH, and hTERT-FH-B cells was instructive. The miRNA expression patterns in HepG2 cells versus cultured AH, FH, or hTERT-FH-B (R, 0.60–0.75) were similar on the whole to miRNA expression patterns in AH, FH, and hTERT-FH-B among themselves (R, 0.79–0.86) (Fig. 3A). However, many of these miRNA were expressed at extremely low levels in cultured cells (Fig. 3B). For instance, hsa-miR-122 was most abundant of all miRNA in freshly isolated AH as well as FH, but it was not expressed after culture in AH, FH, or hTERT-FH-B cells.
Fig. 3.
Profiling of selected miRNA in cells. (A) Comparison of log2-transformed miRNA expression in cell types. The miRNA expression in HepG2 cells and cultured AH or FH correlated less, whereas miRNA expression among AH and FH correlated better. (B) Heat mapping of miRNA in HepG2 cells, AH, FH, and hTERT-FH-B cells. The dendrogram was omitted for space constraints. Color bar indicates miRNA expression levels.
After excluding miRNA that were either not expressed or were expressed at extremely low levels in all cultured cells, we were left with 61 miRNA from the total of 470 miRNA analyzed. Of these 61 miRNA, the numbers of miRNA that were upregulated(>1.5-fold), downregulated (>1.5-fold), or were expressed similar to HepG2 cells, were as follows: AH, 52, 5, and 4; FH, 46, 10, and 5; hTERT-FH-B cells, 42, 13, and 6, respectively. Of these 61 miRNA, the following 23 miRNA were absent in AH, FH as well as hTERT-FH cells; therefore, these were removed from further study: hsa-miR-16, -103, -107, -126, -137, -146a, -148a, -191, -192, -194, -21, -25, -26a, -26b, -27b, -30b, -30d, -335, -409-3p, -768-3p, -768-5p, -98, and 92b.
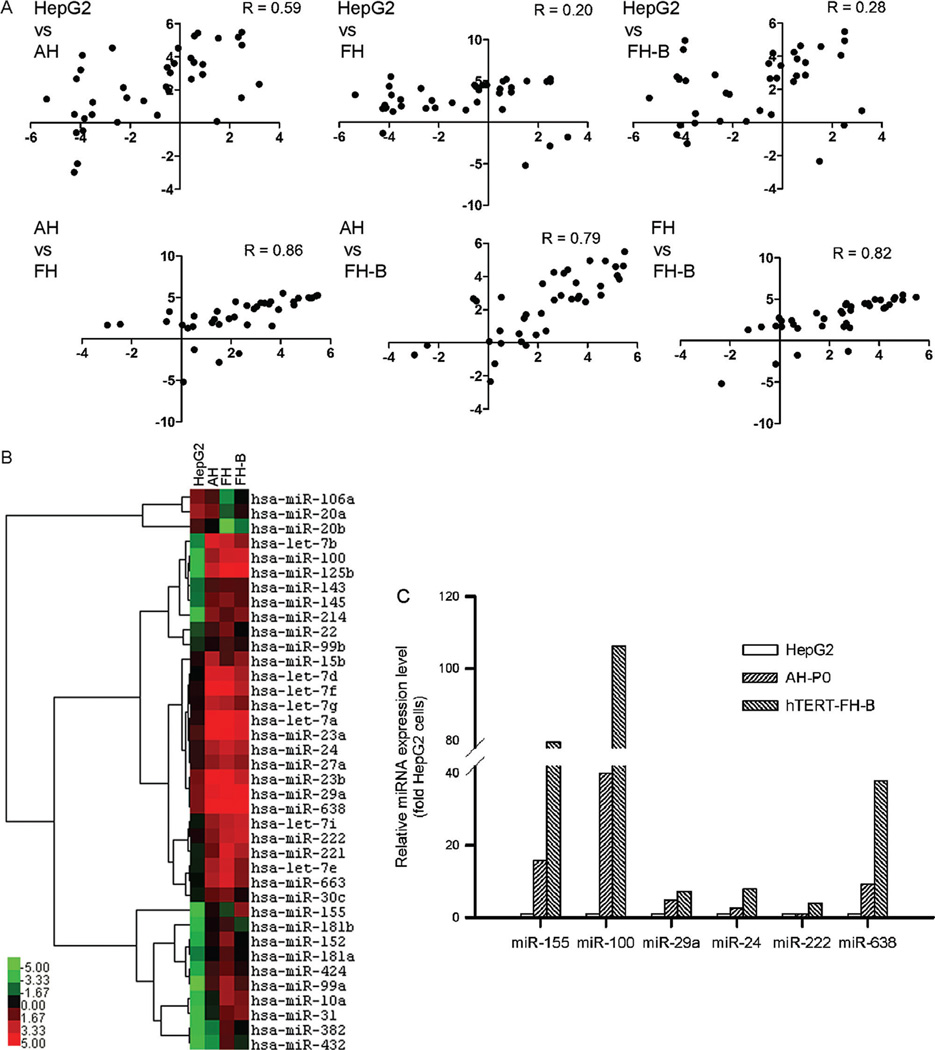
The remaining 38 miRNA were expressed differently in AH, FH, and hTERT-FH-B cells compared with HepG2 cells (R, 0.20–0.59) (Fig. 4A). The expression of these miRNA correlated better among AH, FH, and hTERT-FH-B cells (R, 0.79–0.86). Clustering of these miRNA and their identities are given as heat map (Fig. 4B). Analysis by qRT-PCR of miRNA expression levels, i.e., hsa-miR-100, -155, -222, -24, -29a, and -638, confirmed the results of array analysis (Fig. 4C).
Fig. 4.
Changes involving 38 miRNA expressed in all cells. (A) Comparison of log2-transformed miRNA expression. Correlations in miRNA expression in HepG2 cells and cultured AH or FH worsened, whereas AH and FH showed unchanged miRNA expression patterns. (B) Heat map indicating miRNA expressed differentially in HepG2 cells, AH, FH, and hTERT-FH-B cells, along with their clustering. Color bar indicates miRNA expression levels.(C) Quantitative RT-PCR for several miRNA in HepG2 cells, AH, and hTERT-FH-B cells. The results confirmed miRNA array results. By comparison with HepG2 cells, hsa-miR-155 was expressed 15- and 80-fold more in AH and hTERT-FH-B cells, respectively. Similarly, -miR-100 was expressed 40- and 106-fold more in AH and hTERT-FH-B cells, respectively.
Next, antiviral potential of miRNA was examined by RNAHybrid alignments, which indicated that 34 of the final remaining 38 miRNA (in Fig. 4) had potential for interacting with HBV (Table I). In many instances, possible HBV targets exceeded 50, despite the restriction of miRNA interactions using mean free-energy (mfe) of <20 kcal/mol as a stringent basis. The putative leading miRNA interactions concerned all HBV open reading frames (ORF), including polymerase (n=14), polymerase plus surface (n=10), core (n=4), polymerase plus X (n=1); or polymerase plus core (n=2).
TABLE I.
Predicted Interactions Between HBV mRNA and Selected Cellular miRNA
| miRNA Identity |
No. of predicted HBV Targets (mfe <20.0 kcal/mol) |
Illustration of candidate HBV targets | ||
|---|---|---|---|---|
| HBV nt position, HBV gene(s) targeted |
Mfe (kcal/ mol) |
Alignment with HBV sequences | ||
| Hsa-let-7a | 21 | 91, P/S | −24.6 |  |
| Hsa-let-7b | 43 | 521, P/S | −28.9 |  |
| Hsa-let-7e | 27 | 3073, P/S | −29.7 |  |
| Hsa-let-7f | 6 | 91, P/S | −24.6 |  |
| Hsa-Let-7g | 13 | 91, P/S | −28.8 |  |
| Hsa-let-7i | 23 | 80, P/S | −29.1 |  |
| Hsa-mir-100 | 15 | 994, P | −23.7 |  |
| Hsa-mir-10a | 13 | 994, P | −26.2 |  |
| Hsa-mir-125b | 16 | 3026, P/S | −26.2 | 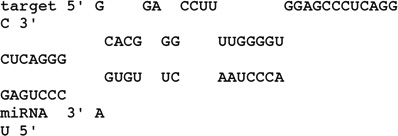 |
| Hsa-mir-143 | 34 | 2014, C | −27.9 |  |
| Hsa-mir-145 | 21 | 2437, P/C | −30.6 | 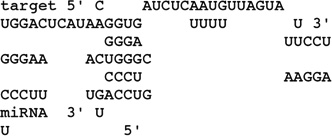 |
| Hsa-mir-152 | 12 | 2266, C | −29.4 |  |
P, HBV polymerase; S, HBsAg genes; C, HBcAg gene; X, HBxAg gene.
When miRNA expression patterns were compared in freshly isolated AH or AH after culture for several days, 11 of 34 putative HBV-interfering miRNA were observed in both conditions: hsa-miR-100, -125a, -145, -15b, -214, -222, -23a, -23b, -24, -29a, -638, Moreover, cultured AH expressed another 5 of 34 miRNA, which were absent in freshly isolated AH: -143, -221, -424, -663, and -99b.
In both freshly isolated FH and cultured FH, 10 of 34 putative HBV-interfering miRNA were present: hsa-miR-7b, -7e, -7i, -125b, -181-b, -23a, -23b, -24, -27a, and -29a. In addition, cultured FH expressed another 15 of 34 putative HBV-interfering miRNA that were absent in freshly isolated FH: hsa-miR-100, -10a, -143, -145, -152, -155, -214, -22, -221, -222, -31, -382, -424, -99a, and -99b. The miRNA profiles of cultured FH and cultured hTERT-FH-B cells were essentially similar.
Selected miRNA Inhibited HBV Replication in HepG2 Cells
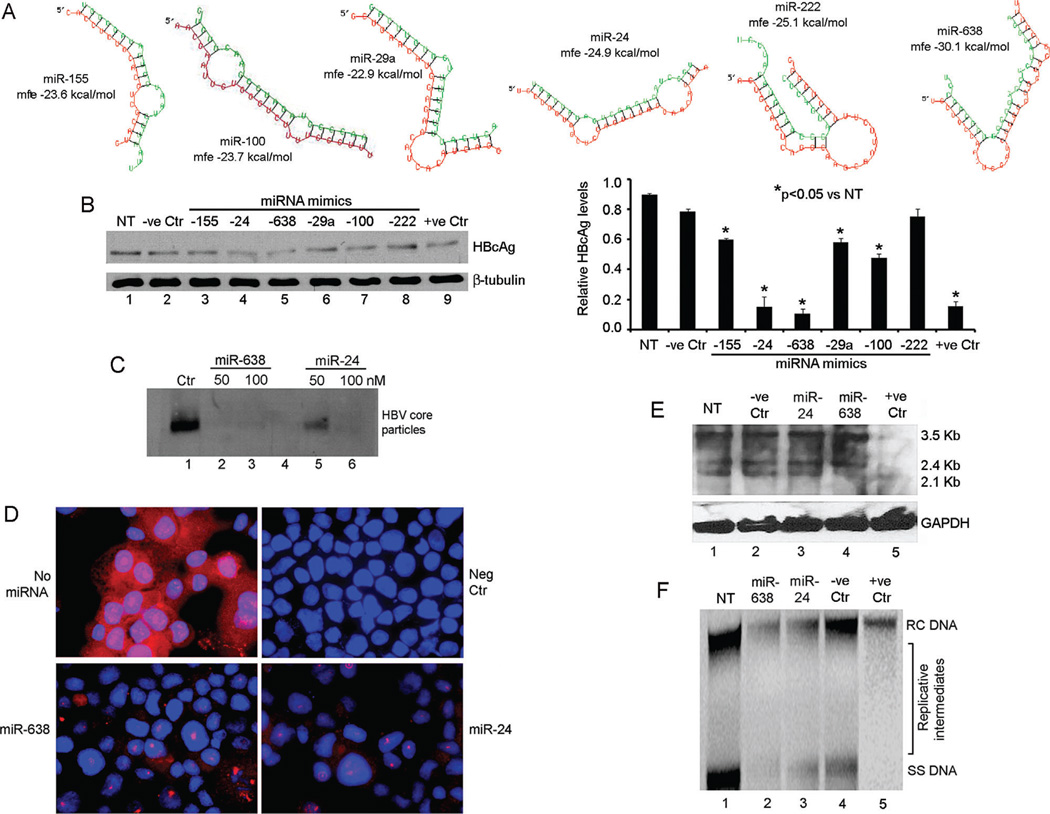
The antiviral activity of miRNA mimics binding to the lead HBV ORFs was examined although putative targets with mfe <20 kcal/mol ranged from 4 to >50 (Table I). These included miRNA targeting HBV ORFs of core (hsa-miR-222), polymerase (-miR-100, miR-29a, miR-155), polymerase and surface (-miR-24), and polymerase and X (-miR-24). The RNAHybrid alignments of these miRNA with HBV sequences are given (Fig. 5A). Transfection of miRNA mimics or antagonists had no effect on viability of HepG2 or hTERT-FH-B cells (not shown). In Ad-HBV-transduced HepG2 cells, anti-HBV miRNA mimics in amounts of 100 nM interfered with production of HBV core particles versus control untreated or sham-treated cells (Fig. 5B). The hsa-miR-24 and -638 mimics lowered HBV core particles most (>80%) with the latter showing greater potency (Fig. 5C). These mimics also inhibited HBcAg expression (Fig. 5D). Northern blot showed less 2.1 kb HBV RNA expression and Southern blot showed less HBV DNA replicative forms in cells treated with the -638 miRNA mimic (Figs. 5E and F).
Fig. 5.
Antiviral activity of miRNA in Ad-HBV-transduced HepG2 cells. (A) RNAhybrid alignments of HBV targets for selected miRNA including predicted mfe. (B) HBV core particle agarose gel assay for effects of 100 nM miRNA mimics: lane 1, no treatment control; lane 2, irrelevant miRNA; lanes 3–8, cells treated with mimics indicated; lane 9, cells treated with HBV siRNA. Chart on right provides densitometric data including differences in the antiviral effects of miRNA. (C) HBV core particle agarose gel assay indicated -miR-638 was more potent than -24. (D) HBcAg immunostaining after treatment with 100 nM of -638 and -24 mimics. Control cells without miRNA or without primary antibody (Neg Ctr) were included. (E) Northern blot showing HBV mRNAs after 100 nM miRNA mimics: lane 1, no treatment control; lane 2, irrelevant miRNA; lanes 3–4, cells treated with mimics indicated; lane 5, cells treated with HBV siRNA. (F) Southern blot showing HBV DNA forms, including viral replicative intermediates in cells treated with 100 nM miRNA mimics: lane 1, no treatment control; lanes 2–3, cells treated with mimics indicated; lane 4, irrelevant miRNA; lane 5, cells treated with HBV siRNA. Cells were transduced with 50 moi of AdHBV.
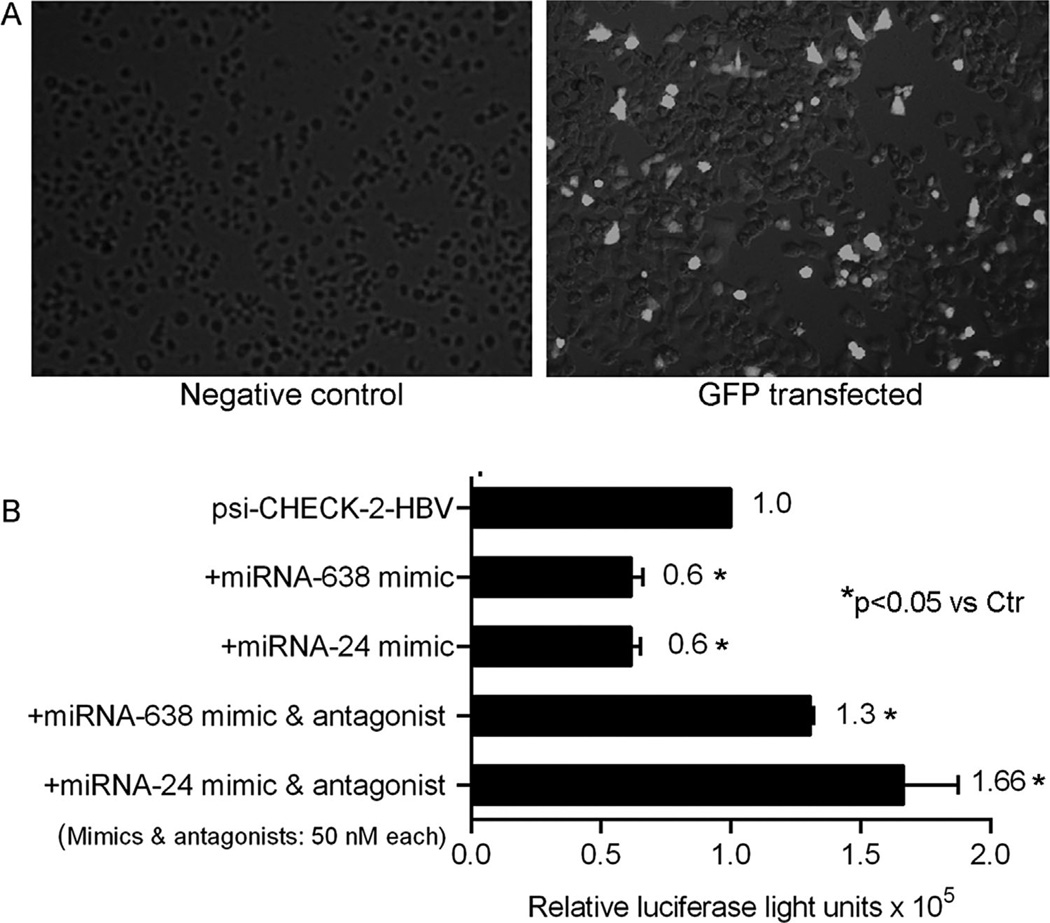
To further establish whether miRNA targeted HBV, luciferase assays were performed in HepG2 cells transfected with psi-CHECK™-2-HBV plasmid. This HBV plasmid was expressed well in HepG2 cells. After cotransfection of psi-CHECK™-2-HBV plasmid plus mimics for -miR-638 or -24, HBV expression decreased significantly (Fig. 6). In combination, these miRNA mimics decreased HBV expression by another 10–20% (not shown). This antiviral effect of miRNA mimics was inhibited in the presence of corresponding antagonists, although HBV expression increased in this setting. This may have reflected off-target effects of miRNA antagonists on cellular mRNA expression leading to superior HBV gene expression but was not further examined.
Fig. 6.
Validation of HBV targeting by miRNA. (A) Lipofectamine transfection led to GFP expression in 30–40% of HepG2 cells (panel on right). (B) Representative study with HepG2 cells transfected with psi-CHECK™-2-HBV plasmid. In the presence of 50nM hsa-miR-638 or -mir-24 mimics HBV expression decreased, P<0.05. This inhibitory effect became apparent at 20nM without further increase with 100nM of mimics. Simultaneous transfection of miRNA mimics with corresponding antagonists abolished inhibition of HBV expression, P< 0.05, ANOVA. In this case, 50 nM or 100nM of antagonists were equally effective. The numbers adjacent to bars indicate mean levels of normalized luciferase activity. The study was performed twice with similar results.
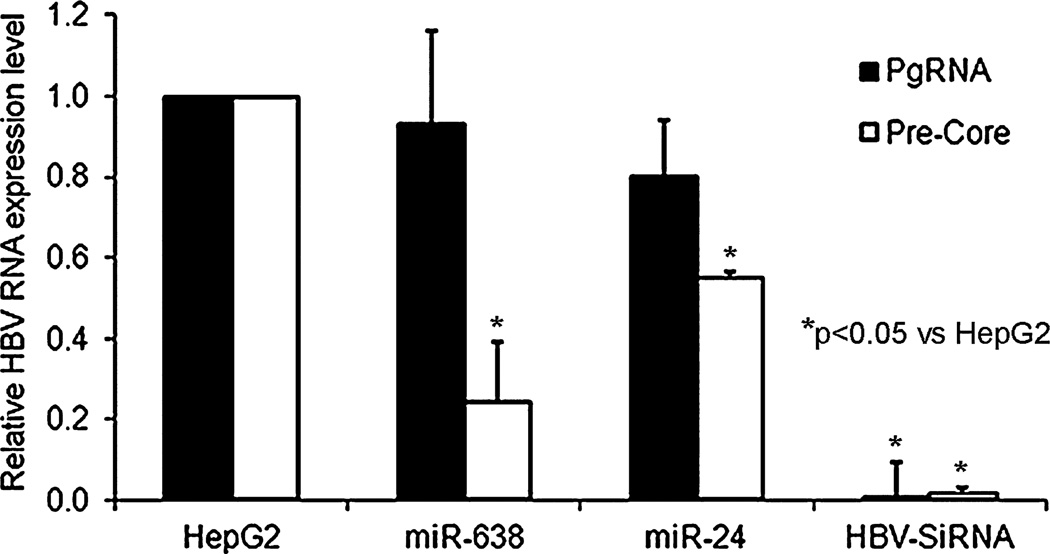
To determine mechanisms by which miRNA affected HBV replication, pregenomic and pre-Core HBV RNAs were examined in AdHBV-transduced HepG2 cells with or without mimics for miR-638 or -24. Less pre-Core HBV RNA was observed in cells treated with miRNA mimics, which was consistent with interference at the viral transcript level (Fig. 7).
Fig. 7.
miRNA decreased HBV transcripts in AdHBV-transduced cells. qRT-PCR for pregenomic and pre-Core HBV RNAs in cells indicating latter decreased in cells treated with hsa-miR-638 and -miR-24 mimics.
Moreover, in AdHBV-transduced HepG2 cells, HBsAg was expressed but this was not the case in HepG2 cells after treatment with miR-638 or -24 mimics, which indicated post-transcriptional interference (Table II). In hTERT-FH-B cells, HBsAg reactivity was not observed, which was in agreement with the role of miRNA in altering viral gene expression. When hTERT-FH-B cells were transfected with antagonists of miR-638, -24, or both -638 and -24, HBV core particles were not observed by agarose gel assay and HBsAg was not detected in cell culture medium, which indicated that inhibition of one or two miRNAs was insufficient for restoring HBV expression in these cells.
TABLE II.
HBsAg Expression in Cells and Culture Medium
| Cell type | Experimental condition | HBsAg reactivity in cell lysate | HBsAg reactivity in medium |
|---|---|---|---|
| HepG2 | Negative control | Nonreactive | Nonreactive |
| HepG2 2.2.15 | Positive control | Reactive | Reactive |
| HepG2 | AdHBV | Reactive | Reactive |
| HepG2 | AdHBV + miR-638 | Nonreactive | Nonreactive |
| HepG2 | AdHBV + miR-24 | Nonreactive | Nonreactive |
| hTERT-FH-B | Untreated control | Nonreactive | Nonreactive |
| hTERT-FH-B | AdHBV | Nonreactive | Nonreactive |
| hTERT-FH-B | AdHBV+miR-638 antagonist | Nonreactive | Nonreactive |
| hTERT-FH-B | AdHBV+miR-24 antagonist | Nonreactive | Nonreactive |
| hTERT-FH-B | AdHBV+miR-638 and -24 antagonists | Nonreactive | Nonreactive |
Effects of miRNA on Interferon Signaling
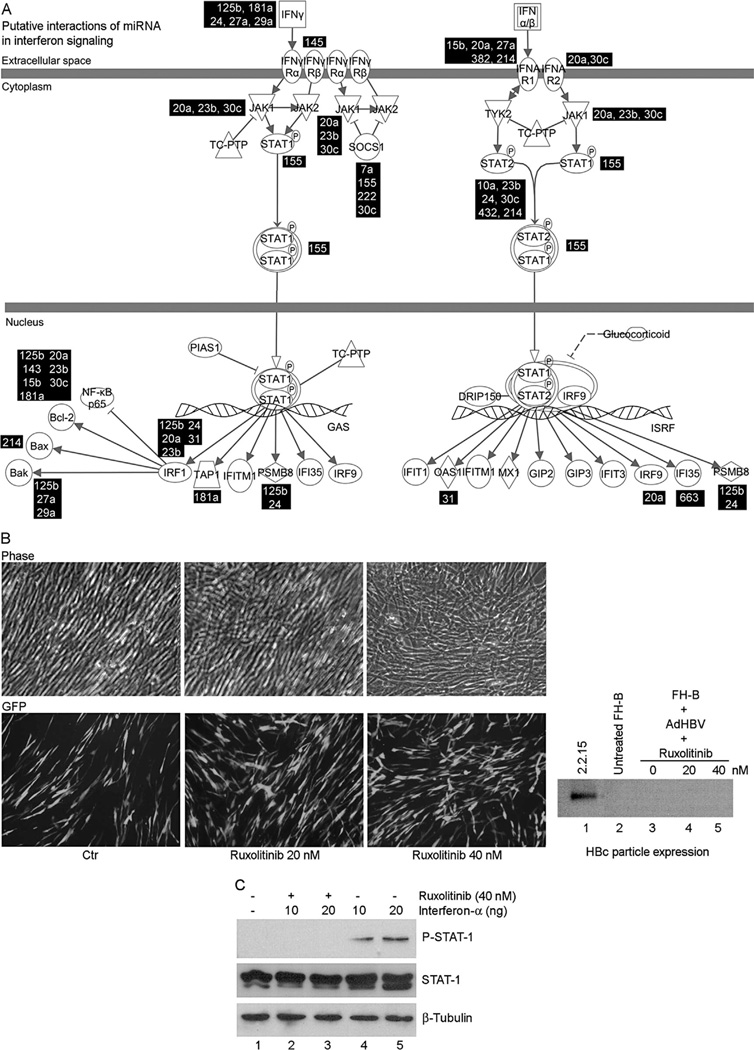
The interactions were studied between 38 anti-HBV miRNA and interferon signaling, since these could have altered HBV replication, as noted in HepaRG cells [Lucifora et al., 2010]. This analysis indicated that 20 of 38 miRNA could have targeted interferon signaling genes (Table III). Gene expression in primary and cultured FH was different, including several-fold decreases in expression of hepatic genes, e.g., albumin or apolipoproteins (not shown), but interferon signaling genes differed only in respect to the upregulation of IFNGR1, JAK1, and PSMB8 by 3.5-, 2.3-fold, and twofold, respectively (Fig. 8A). However, culture of hTERT-FH-B cells with JAK-1/2 inhibitor, ruxolitinib, did not restore production of HBV core particles (Fig. 8B), even though ruxolitinib decreased a-interferon-induced JAK-STAT-1 signaling)Fig. 8C).
TABLE III.
Targets of Potential HBV-Regulating miRNA in Interferon Signaling Pathways*
| miRNA identity | Confidence level of prediction | Symbol of gene regulate |
|---|---|---|
| hsa-let-7a | Moderate | SOCS1 |
| hsa-miR-23b | High | BCL2 |
| High | IRF1 | |
| High | JAK1 | |
| Moderate | MED14 | |
| Moderate | STAT2 | |
| hsa-miR-29a | High | BAK1 |
| Moderate | IFNG | |
| hsa-miR-125b | Experimentally Observed, High | BAK1 |
| High | BCL2 | |
| Moderate | IFNG | |
| Moderate | IRF1 | |
| High | PSMB8 | |
| hsa-miR-15b | Experimentally Observed, High | BCL2 |
| Moderate | IFNAR1 | |
| hsa-miR-663 | Moderate | IFI35 |
| hsa-miR-24 | High | IFNG |
| Moderate | IRF1 | |
| Moderate | PSMB8 | |
| Moderate | STAT2 | |
| hsa-miR-27a | High | BAK1 |
| Moderate | IFNAR1 | |
| Moderate | IFNG | |
| High | MED14 | |
| hsa-miR-214 | Moderate | BAX |
| Moderate | IFNAR1 | |
| High | STAT2 | |
| hsa-miR-222 | High | SOCS1 |
| hsa-miR-20a | Experimentally Observed, High | BCL2 |
| Moderate | IFNAR1 | |
| Moderate | IFNAR2 | |
| High | IRF1 | |
| High | IRF9 | |
| Experimentally Observed, High | JAK1 | |
| hsa-miR-145 | High | IFNGR2 |
| hsa-miR-30c | High | BCL2 |
| High | IFNAR2 | |
| High | JAK1 | |
| High | SOCS1 | |
| Moderate | STAT2 | |
| hsa-miR-143 | Experimentally Observed, High | BCL2 |
| Moderate | MED14 | |
| hsa-miR-155 | Experimentally Observed, High | SOCS1 |
| Moderate | STAT1 | |
| hsa-miR-181a | Experimentally Observed, High | BCL2 |
| Moderate | IFNG | |
| Moderate | TAP1 | |
| hsa-miR-10a | Moderate | PTPN2 |
| Moderate | STAT2 | |
| hsa-miR-31 | Moderate | IRF1 |
| Moderate | OAS1 | |
| hsa-miR-382 | Moderate | IFNAR1 |
| hsa-miR-432 | High | STAT2 |
From data analysis with IPA, Ingenuity Systems Inc., Redwood, CA.
Fig. 8.
Mapping of interferon pathways. (A) Alignment (in black boxes) of anti-HBV miRNA expressed in cultured hepatocytes with predicted targets. (B) Effects of ruxolitnib on hTERT-FH-B cells transduced with 50 moi of Ad-HBV. Ruxolitinib did not alter cell morphology and Ad-HBV-transduced cells expressed GFP. HBV core particle assay with native agarose gel (extreme right) indicated absence of HBV replication in cells cultured with ruxolitinib. (C) Active interferon signaling was verified in hTERT-FH-B cells with increase by a-interferon and decrease by ruxolitinib of phosphorylated STAT-1 expression.
DISCUSSION
This study indicated that cultured AH and FH did not efficiently support HBV replication process that would lead to virion production. Despite the presence of pregenomic HBV mRNA in cultured AH and FH, lack of HBcAg expression explained the absence of nucleocapsid or virion production, whereas lack of HBsAg was in agreement with their inability to package the virus. The experiments confirmed decreases in viral transcripts and effects on post-transcriptional processing or translation of viral transcripts in cultured AH or FH. A large number of antiviral miRNA were expressed in cultured AH and FH and were of likely significance because the antiviral context produced in this manner could not be overcome by only one or two miRNA antagonists. By contrast, few differences were observed in expression of IFN signaling genes and this did not likely explain lack of viral replication in these nonpermissive conditions. The identification of many novel antiviral miRNA in this study adds to those identified previously [Zhang et al., 2010; Chen et al., 2011; Potenza et al., 2011; Dai et al., 2014; Kohno et al., 2014; Mosca et al., 2014]. This should be helpful in studies of pathophysiological processes and searches for biomarkers for progression of hepatitis and related complications, as has been proposed previously [Li et al., 2010; Giray et al., 2014].
The AdHBV vector efficiently transduced replication-competent HBV genomes in all cells used in this study. In this way, difficulties were avoided in HBV infection of cultured hepatocytes and cell lines, e.g., HepG2, HuH-7, or HepaRG cells required transfection of HBV plasmids for viral replication [Shimizu et al., 1986; Sells et al., 1987; Tsurimoto et al., 1987; Gripon et al., 1988, 2002; Ochiya et al., 1989; Sun and Nassal, 2006]. Previously, infection of human hepatocytes with HBV was not always successful, and even required repeated exposure to HBV inocula or continuous co-culture with HBV-producing cells for many days [Gripon et al., 1988; Ochiya et al., 1989]. Other manipulations were necessary, e.g., dimethylsulfoxide (DMSO) in cell culture medium or coculture with nonparenchymal liver epithelial cells [Gripon et al., 1988]. These manipulations could have altered cell differentiation or mRNA transcription states, as suggested by subsequent studies with mouse liver stem/progenitor cells [Rogler, 1997]. Nonetheless, HBV replication was either transient or was extremely low at best, judging from the paucity or loss of replicative HBV DNA forms in cells [Gripon et al., 1988; Ochiya et al., 1989]. Because only rare cultured hepatocytes would express HBcAg in those studies, it was not excluded whether previous results reflected persistence of inoculated HBV particles, especially when HBV was repeatedly introduced into the cell culture medium. Similarly, DMSO and gluco-corticoids or inhibition of interferon signaling was needed for HBV replication in HepaRG cells [Lucifora et al., 2010]. It should be noteworthy that HepaRG cells exhibit hepatobiliary properties, similar to murine HBC-3 cells, which differentiated along the hepatocyte lineage in response to DMSO [Rogler, 1997]. Therefore, interruption in HBV replication in cultured hepatocytes, including FH, that share aspects of hepatobiliary properties with HepaRG or HBC-3 cells, was significant for understanding restrictions in cell culture models of HBV.
It should be noteworthy that cellular transcription factor activity is rapidly altered in cultured hepatocytes [Quasdorff et al., 2008], including primary FH and cultured FH from individual donor livers, where hepatic gene expression was downregulated and mesenchymal gene expression was upregulated in cell culture [Inada et al., 2008; Sakai et al., 2010]. This phenotypic switching accompanied differences in cell membrane receptor expression, e.g., TGF-β and BMP receptors were expressed more in cultured FH [Inada et al., 2008]. Remarkably, activation of TGF-β signaling in cultured HepG2 2.2.15 cells inhibited HBV gene expression and replication [Park et al., 2012]. This concerned secondary effects on HBV via SMAD-mediated regulation of miRNA expression.
The findings in this study are in agreement with multiple miRNA serving roles to determine whether HBV replication may proceed in given cell types. Besides the expression in cultured hepatocytes of miRNA that were absent previously, those miRNA that are expressed abundantly in hepatocytes were not expressed, e.g., hsa-miR-122, which may have had additional effects on viral replication through cellular gene expression. Receptors determining whether cells may be infected with HBV and other viruses may be downregulated by various mechanisms, including by targeting of specific genes by miRNA. For instance, the sodium taurocholate co-transporting polypeptide (NTCP) has recently been proposed as a receptor for HBV [Ni et al., 2014], but little information is available in respect to the role of miRNA in regulating NTCP expression. In studies with HepG2 cells or primary hepatocytes from Tupaia that are susceptible to HBV infection, overexpression of hsa-miR-122 had no effects on HBV uptake [Xu et al., 2014]. Also, NTCP was expressed in primary human hepatocytes after these had been cultured for several days [Qiu et al., 2013]. It should be noteworthy that in this study use of AdHBV avoided issues related to HBV infection involving viral receptors in targeted cells and thus allowed focus on intracellular processes regulating viral gene expression and replication.
The silencing of HBV plasmids by unknown, albeit dominant-negative factors in fusion products of permissive (hepatocytes) and nonpermissive (fibroblasts) cells [Ott et al., 1999], may now be explained by mechanisms involving cellular miRNA. Recently, several anti-HBV miRNA were identified, e.g., hsa-miR-15b, -125-5p, -125-b, -151-5p, -199a-3p, -122, -1231, etc. [Shimizu et al., 1986; Sells et al., 1987; Tsurimoto et al., 1987; Gripon et al., 1988, 2002; Ochiya et al., 1989; Sun and Nassal, 2006]. In chronic hepatitis B and HBV-associated HCC, several miRNA were overexpressed in blood, e.g., hsa-miR-7, - 196b, -433, -511 targeting polymerase or surface genes, hsa-miR-205 targeting X gene, and hsa-miR-345 targeting HBV preC gene [Li et al., 2010]. This study identified a series of additional antiviral miRNA for further consideration.
The luciferase plasmid in this study confirmed the role of miRNA in targeting HBV gene expression. This was demonstrated by studies with specific oligonucleotide mimics and antagonists for individual miRNA. Although various viral targets could have been mutagenized for greater characterization of preferential miRNA targets, this would likely have been confounded by the unusually large numbers of targets identified even under stringent conditions for individual miRNA, besides the likelihood that extensive mutations will have profoundly altered residual viral sequences.
As intracellular miRNA expression became rapidly different in cultured hepatocytes, this aspect of gene expression regulation should benefit from study of outside-in signaling via soluble factors and of intra-cellular signaling via transcriptional regulators, since these changes were observed previously [Parent et al., 2004; Inada et al., 2008; Quasdorff et al., 2008; Lucifora et al., 2010]. Superior understanding into mechanisms driving miRNA expression under such conditions should be informative [Xu et al., 2011], including insights into the roles of soluble factors and chromatin alterations [Eades et al., 2011; Kumar et al., 2011]. That may help in developing cell-based models for productive HBV infection. In this study, the list of 34 differentially expressed miRNA included unidentified anti-HBV miRNA. For instance, hsa-miR-638 and -24 had antiviral effects, and many other miRNA may also be antiviral. Characterization of the antiviral properties in other miRNA should also be relevant, including for potential therapeutic applications, e.g., gene therapy or drug development, etc. Regulation of intracellular HBV gene expression by miRNA should similarly be relevant for studies of host-virus interactions during viral persistenceand/or oncogenesis.
ACKNOWLEDGEMENT
Ms. Gertrude Ukpong provided technical assistance.
Grant sponsor: National Institute of Diabetes, Digestive and Kidney Diseases; Grant numbers: R01 DK-071111; R01 DK-088581, P30 DK-41296.
REFERENCES
- Aragona E, Burk RD, Ott M, Shafritz DA, Gupta S. Cell-type specific mechanisms regulate hepatitis B virus transgene expression in liver and other organs. J Pathol. 1996;180:441–449. doi: 10.1002/(SICI)1096-9896(199612)180:4<441::AID-PATH713>3.0.CO;2-C. [DOI] [PubMed] [Google Scholar]
- Chen Y, Shen A, Rider PJ, Yu Y, Wu K, Mu Y, Hao Q, Liu Y, Gong H, Zhu Y, Liu F, Wu J. A liver-specific microRNA binds to a highly conserved RNA sequence of hepatitis B virus and negatively regulates viral gene expression and replication. FASEB J. 2011;25:4511–4521. doi: 10.1096/fj.11-187781. [DOI] [PMC free article] [PubMed] [Google Scholar]
- Cho JJ, Joseph B, Sappal BS, Giri RK, Wang R, Ludlow JW, Furth ME, Susick R, Gupta S. Analysis of the functional integrity of cryopreserved human liver cells including xenografting in immunodeficient mice to address suitability for clinical applications. Liver Int. 2004;24:361–370. doi: 10.1111/j.1478-3231.2004.0938.x. [DOI] [PubMed] [Google Scholar]
- Dai X, Zhang W, Zhang H, Sun S, Yu H, Guo Y, Kou Z, Zhao G, Du L, Jiang S, Zhang J, Li J, Zhou Y. Modulation of HBV replication by microRNA-15b through targeting hepatocyte nuclear factor 1a. Nucleic Acids Res. 2014;42:6578–6590. doi: 10.1093/nar/gku260. [DOI] [PMC free article] [PubMed] [Google Scholar]
- Delaney WE, Isom HC. Hepatitis B virus replication in human HepG2 cells mediated by hepatitis B virus recombinant baculovirus. Hepatology. 1998;28:1134–1146. doi: 10.1002/hep.510280432. [DOI] [PubMed] [Google Scholar]
- Dubois MF, Pourcel C, Rousset S, Chany C, Tiollais P. Excretion of hepatitis B surface antigen particles from mouse cells transformed with cloned viral DNA. Proc Natl Acad Sci USA. 1980;77:4549–4553. doi: 10.1073/pnas.77.8.4549. [DOI] [PMC free article] [PubMed] [Google Scholar]
- Eades G, Yang M, Yao Y, Zhang Y, Zhou Q. MiR-200a regulates Nrf2 activation by targeting Keap1 mRNA in breast cancer cells. J Biol Chem. 2011;286:40725–40733. doi: 10.1074/jbc.M111.275495. [DOI] [PMC free article] [PubMed] [Google Scholar]
- Eisen MB, Spellman PT, Brown PO, Botstein D. Cluster analysis and display of genome-wide expression patterns. Proc Natl Acad Sci USA. 1998;95:14863–14868. doi: 10.1073/pnas.95.25.14863. [DOI] [PMC free article] [PubMed] [Google Scholar]
- Follenzi A, Sabatino G, Lombardo A, Boccaccio C, Naldini L. Efficient gene delivery and targeted expression to hepatocytes in vivo by improved lentiviral vectors. Hum Gene Ther. 2002;13:243–260. doi: 10.1089/10430340252769770. [DOI] [PubMed] [Google Scholar]
- Giray BG, Emekdas G, Tezcan S, Ulger M, Serin MS, Sezgin O, Altintas E, Tiftik EN. Profiles of serum microRNAs; miR-125b-5p and miR223-3p serve as novel biomarkers for HBV-positive hepatocellular carcinoma. Mol Biol Rep. 2014;41:4513–4519. doi: 10.1007/s11033-014-3322-3. [DOI] [PubMed] [Google Scholar]
- Gripon P, Diot C, Theze N, Fourel I, Loreal O, Brechot C, Guguen-Guillouzo C. Hepatitis B virus infection of adult human hepatocytes cultured in the presence of dimethyl sulfoxide. J Virol. 1988;62:4136–4143. doi: 10.1128/jvi.62.11.4136-4143.1988. [DOI] [PMC free article] [PubMed] [Google Scholar]
- Gripon P, Rumin S, Urban S, Le Seyec J, Glaise D, Cannie I, Guyomard C, Lucas J, Trepo C, Guguen-Guillouzo C. Infection of a human hepatoma cell line by hepatitis B virus. Proc Natl Acad Sci USA. 2002;99:15655–15660. doi: 10.1073/pnas.232137699. [DOI] [PMC free article] [PubMed] [Google Scholar]
- Inada M, Follenzi A, Cheng K, Surana M, Joseph B, Benten D, Bandi S, Qian H, Gupta S. Phenotype reversion in fetal human liver epithelial cells identifies the role of an intermediate meso-endodermal stage before hepatic maturation. J Cell Sci. 2008;121:1002–1013. doi: 10.1242/jcs.019315. [DOI] [PMC free article] [PubMed] [Google Scholar]
- Jammeh S, Tavner F, Watson R, Thomas HC, Karayiannis P. Effect of basal core promoter and pre-core mutations on hepatitis B virus replication. J Gen Virol. 2008;89:901–909. doi: 10.1099/vir.0.83468-0. [DOI] [PubMed] [Google Scholar]
- Kohno T, Tsuge M, Murakami E, Hiraga N, Abe H, Miki D, Imamura M, Ochi H, Hayes CN, Chayama K. Human microRNA hsa-miR-1231 suppresses hepatitis B virus replication by targeting core mRNA. J Viral Hepat. 2014;21:e89–e97. doi: 10.1111/jvh.12240. [DOI] [PubMed] [Google Scholar]
- Kumar M, Bandi S, Cheng K, Gupta S. Transplantation of human cells in the peritoneal cavity of immunodeficient mice for rapid assays of hepatitis B virus replication. Xenotransplanta-tion. 2011;18:380–389. doi: 10.1111/j.1399-3089.2011.00675.x. [DOI] [PMC free article] [PubMed] [Google Scholar]
- Kumar M, Follenzi A, Garforth S, Gupta S. Control of hepatitis B virus replication by antiviral microRNA transferred by lentiviral vectors for potential cell and gene therapy approaches. Antiviral Ther. 2012;17:519–528. doi: 10.3851/IMP2014. [DOI] [PubMed] [Google Scholar]
- Laras A, Koskinas J, Hadziyannis SJ. In vivo suppression of precore mRNA synthesis is associated with mutations in the hepatitis B virus core promoter. Virology. 2002;295:86–96. doi: 10.1006/viro.2001.1352. [DOI] [PubMed] [Google Scholar]
- Li L, Hu MZB, Zhou ZX, Chen X, Liu FY, Zhang JF, Shen HB, Zhang CY, Zen K. Serum microRNA profiles serve as novel biomarkers for HBV infection and diagnosis of HBV-positive hepatocarcinoma. Cancer Res. 2010;70:9798–9807. doi: 10.1158/0008-5472.CAN-10-1001. [DOI] [PubMed] [Google Scholar]
- Lucifora J, Durantel D, Testoni B, Hantz O, Levrero M, Zoulim F. Control of hepatitis B virus replication by innate response of HepaRG cells. Hepatology. 2010;51:63–72. doi: 10.1002/hep.23230. [DOI] [PubMed] [Google Scholar]
- Melegari M, Wolf SK, Schneider RJ. Hepatitis B virus DNA replication is coordinated by core protein serine phosphorylation and HBx expression. J Virol. 2005;79:9810–9820. doi: 10.1128/JVI.79.15.9810-9820.2005. [DOI] [PMC free article] [PubMed] [Google Scholar]
- Mosca N, Castiello F, Coppola N, Trotta MC, Sagnelli C, Pisaturo M, Sagnelli E, Russo A, Potenza N. Functional interplay between hepatitis B virus X protein and human miR-125a in HBV infection. Biochem Biophys Res Commun. 2014;449:141–145. doi: 10.1016/j.bbrc.2014.05.009. [DOI] [PubMed] [Google Scholar]
- Ni Y, Lempp FA, Mehrle S, Nkongolo S, Kaufman C, Fälth M, Stindt J, Königer C, Nassal M, Kubitz R, Sültmann H, Urban S. Hepatitis B and D viruses exploit sodium taurocholate co-transporting polypeptide for species-specific entry into hepatocytes. Gastroenterology. 2014;146:1070–1083. doi: 10.1053/j.gastro.2013.12.024. [DOI] [PubMed] [Google Scholar]
- Ochiya T, Tsurimoto T, Ueda K, Okubo K, Shiozawa M, Matsubara K. An in vitro system for infection with hepatitis B virus that uses primary human fetal hepatocytes. Proc Natl Acad Sci USA. 1989;86:1875–1879. doi: 10.1073/pnas.86.6.1875. [DOI] [PMC free article] [PubMed] [Google Scholar]
- Ott M, Ma Q, Li B, Gagandeep S, Rogler LE, Gupta S. Regulation of hepatitis B virus expression in progenitor and differentiated cell types: Evidence for negative transcriptional control in nonpermissive cells. Gene Expr. 1999;8:175–186. [PMC free article] [PubMed] [Google Scholar]
- Parent R, Marion MJ, Furio L, Trepo C, Petit MA. Origin and characterization of a human bipotent liver progenitor cell line. Gastroenterology. 2004;126:1147–1156. doi: 10.1053/j.gastro.2004.01.002. [DOI] [PubMed] [Google Scholar]
- Park SO, Kumar M, Gupta S. TGF-b and iron differently alter HBV replication in human hepatocytes through TGF-β/ BMP signaling and cellular microRNA expression. PLoS One. 2012;7:e39276. doi: 10.1371/journal.pone.0039276. [DOI] [PMC free article] [PubMed] [Google Scholar]
- Potenza N, Papa U, Mosca N, Zerbini F, Nobile V, Russo A. Human microRNA hsa-miR-125a-5p interferes with expression of hepatitis B virus surface antigen. Nucleic Acids Res. 2011;39:5157–5163. doi: 10.1093/nar/gkr067. [DOI] [PMC free article] [PubMed] [Google Scholar]
- Qiu X, Bi YA, Balogh LM, Lai Y. Absolute measurement of species differences in sodium taurocholate cotransporting polypeptide (NTCP/Ntcp) and its modulation in cultured hepatocytes. J Pharm Sci. 2013;102:3252–3263. doi: 10.1002/jps.23582. [DOI] [PubMed] [Google Scholar]
- Quasdorff M, Hosel M, Odenthal M, Zedler U, Bohne F, Gripon P, Dienes HP, Drebber U, Stippel D, Goeser T, Protzer U. A concerted action of HNF4alpha and HNF1alpha links hepatitis B virus replication to hepatocyte differentiation. Cell Microbiol. 2008;10:1478–1490. doi: 10.1111/j.1462-5822.2008.01141.x. [DOI] [PubMed] [Google Scholar]
- Rehmsmeier M, Steffen P, Hochsmann M, Giegerich R. Fast and effective prediction of microRNA/target duplexes. RNA. 2004;10:1507–1517. doi: 10.1261/rna.5248604. [DOI] [PMC free article] [PubMed] [Google Scholar]
- Rogler LE. Selective bipotential differentiation of mouse embryonic hepatoblasts in vitro. Am J Pathol. 1997;150:591–602. [PMC free article] [PubMed] [Google Scholar]
- Sakai Y, Yamagami S, Nakazawa K. Comparative analysis of gene expression in rat liver tissue and monolayer- and spheroid-cultured hepatocytes. Cells Tissues Organs. 2010;191:281–288. doi: 10.1159/000272316. [DOI] [PubMed] [Google Scholar]
- Saldanha AJ. Java Treeview–Extensible visualization of microarray data. Bioinformatics. 2004;20:3246–3248. doi: 10.1093/bioinformatics/bth349. [DOI] [PubMed] [Google Scholar]
- Sells MA, Chen ML, Acs G. Production of hepatitis B virus particles in Hep G2 cells transfected with cloned hepatitis B virus DNA. Proc Natl Acad Sci USA. 1987;84:1005–1009. doi: 10.1073/pnas.84.4.1005. [DOI] [PMC free article] [PubMed] [Google Scholar]
- Shimizu Y, Nambu S, Kojima T, Sasaki H. Replication of hepatitis B virus in culture systems with adult human hepatocytes. J Med Virol. 1986;20:313–327. doi: 10.1002/jmv.1890200404. [DOI] [PubMed] [Google Scholar]
- Sun D, Nassal M. Stable HepG2- and Huh7-based human hepatoma cell lines for efficient regulated expression of infectious hepatitis B virus. J Hepatol. 2006;45:636–645. doi: 10.1016/j.jhep.2006.05.019. [DOI] [PubMed] [Google Scholar]
- Tsurimoto T, Fujiyama A, Matsubara K. Stable expression and replication of hepatitis B virus genome in an integrated state in a human hepatoma cell line transfected with the cloned viral DNA. Proc Natl Acad Sci USA. 1987;84:444–448. doi: 10.1073/pnas.84.2.444. [DOI] [PMC free article] [PubMed] [Google Scholar]
- Wege H, Le HT, Chui MS, Liu L, Wu J, Giri R, Malhi H, Sappal BS, Kumaran V, Gupta S, Zern MA. Telomerase reconstitution immortalizes human fetal hepatocytes without disrupting their differentiation potential. Gastroenterology. 2003;124:432–444. doi: 10.1053/gast.2003.50064. [DOI] [PubMed] [Google Scholar]
- Xu G, Gao Z, He W, Ma Y, Feng X, Cai T, Lu F, Liu L, Li W. MicroRNA expression in hepatitis B virus infected primary treeshrew hepatocytes and the independence of intracellular miR-122 level for de novo HBV infection in culture. Virology. 2014;448:247–254. doi: 10.1016/j.virol.2013.10.016. [DOI] [PubMed] [Google Scholar]
- Xu Z, Xiao SB, Xu P, Xie Q, Cao L, Wang D, Luo R, Zhong Y, Chen HC, Fang LR. MiR-365, a novel negative regulator of interleukin-6 gene expression, is cooperatively regulated by Sp1 and NF-kappaB. J Biol Chem. 2011;286:21401–21412. doi: 10.1074/jbc.M110.198630. [DOI] [PMC free article] [PubMed] [Google Scholar]
- Zhang GL, Li YX, Zheng SQ, Liu M, Li X, Tang H. Suppression of hepatitis B virus replication by microRNA-199a-3p and microRNA-210. Antiviral Res. 2010;88:169–175. doi: 10.1016/j.antiviral.2010.08.008. [DOI] [PubMed] [Google Scholar]
- Zhang Z, Protzer U, Hu Z, Jacob J, Liang TJ. Inhibition of cellular proteasome activities enhances hepadnavirus replication in an HBX-dependent manner. J Virol. 2004;78:4566–4572. doi: 10.1128/JVI.78.9.4566-4572.2004. [DOI] [PMC free article] [PubMed] [Google Scholar]


