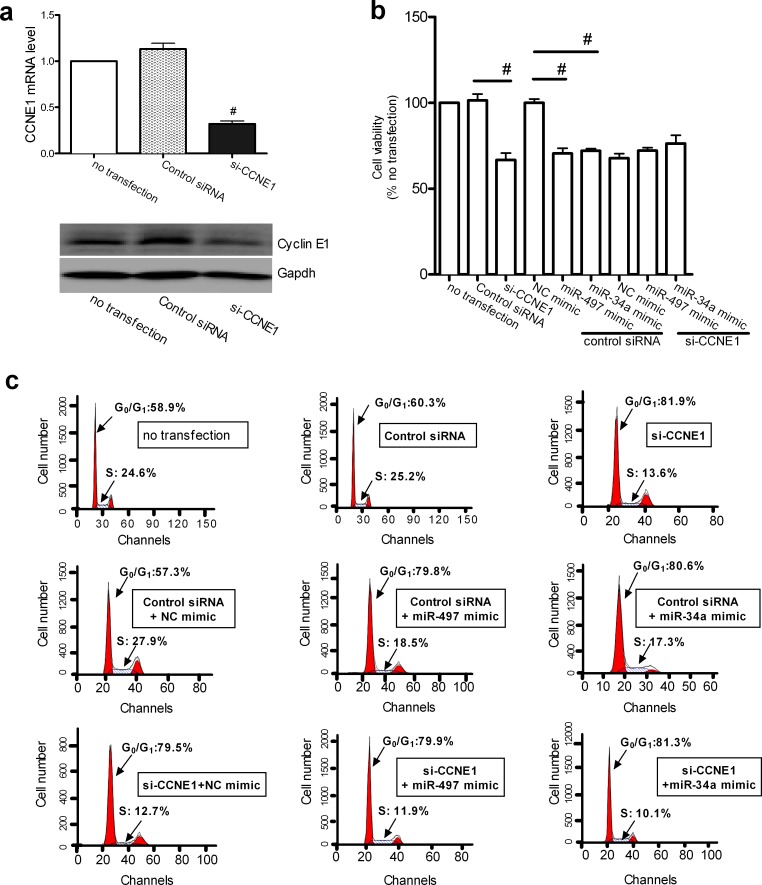
Figure 4. CCNE1 knockdown affected the miR-497 and miR-34a induced inhibition of proliferation.
(a) Validation of siRNA-mediated CCNE1 silencing in A549 cells. The relative CCNE1 mRNA levels, as determined by real-time qPCR, are expressed as fold changes after normalization to the internal control (18S rRNA) (upper row). Mean ± SEM, n = 3 (#P < 0.01 vs. control siRNA). GAPDH was used as the loading control for immunoblotting to determine the cyclin E1 protein levels. A representative result from three independent experiments is shown (bottom row). (b) Cell growth was monitored in A549 cells using the CCK-8 assay. Mean ± SD, n = 3 (#P < 0.01, CCNE1 siRNA vs. control siRNA, control siRNA + miR-497 mimic vs. control siRNA + NC mimic, control siRNA + miR-34a mimic vs. control siRNA + NC mimic). (c) Cell-cycle distribution of G0/G1 phase in A549 cells was analyzed with a FACSCalibur flow cytometer. Representative histograms show the percentages of cells in the G0/G1 and S phases.

