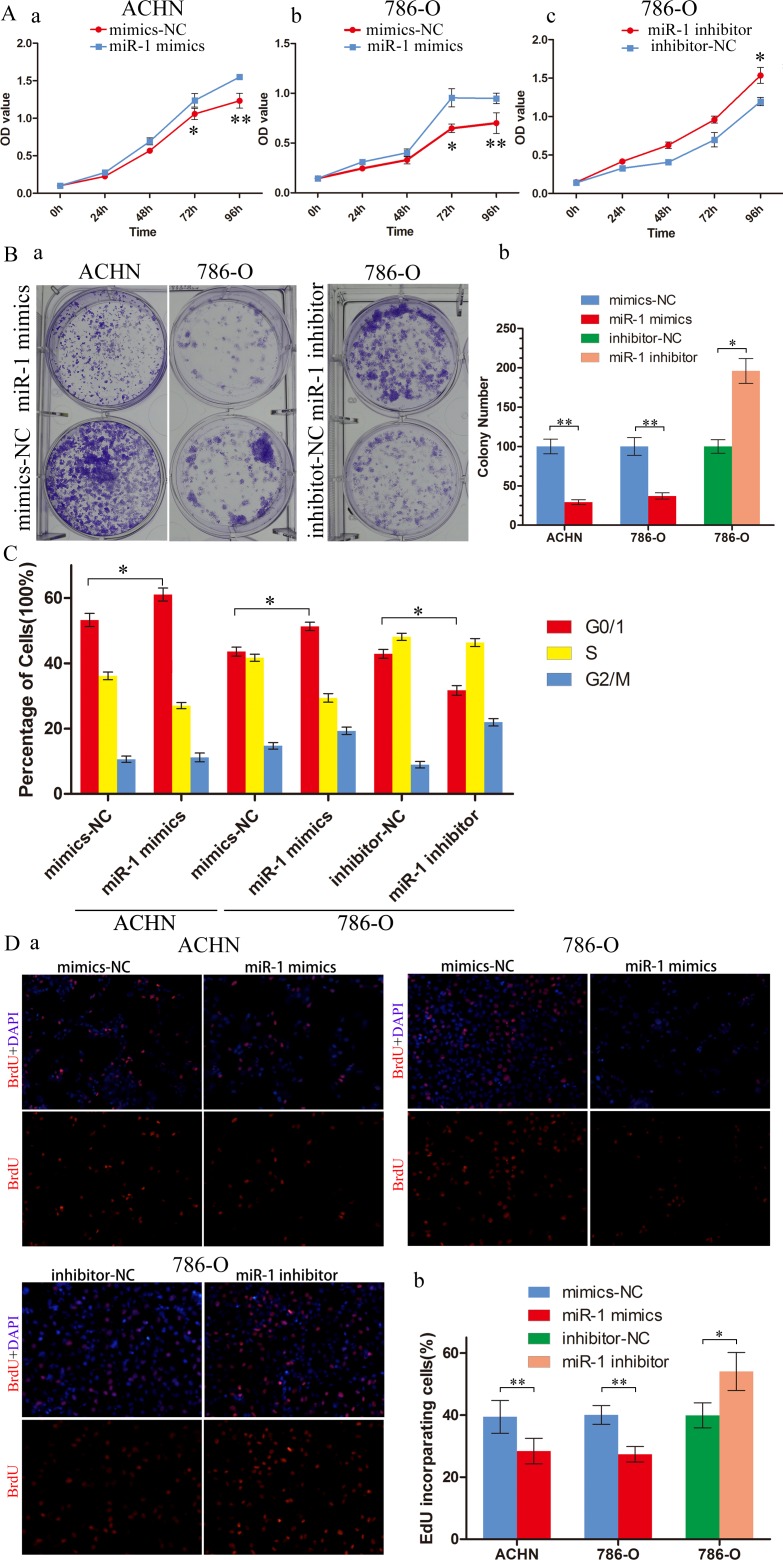
Figure 2. miR-1 attenuates ccRCC cell proliferation and motility.
ccRCC cells were transfected with 100 nM of indicated small RNA molecules. Results were plotted as the mean ± SEM of three independent experiments, with at least three replicates in each independent experiment. *, P < 0.05; **, P < 0.01. A. MTS assays revealed cell growth curves of indicated cells. B. Representative micrographs (left) and relative quantification (right) of crystal violet-stained cell colonies analyzed by clongenic formation. C. Flow cytometric determination of proportion of indicated cells in distinct cell cycle phases. D. Representative micrographs (left) and quantification (right) of EdU incorporated-cells in indicated engineered cell lines.

