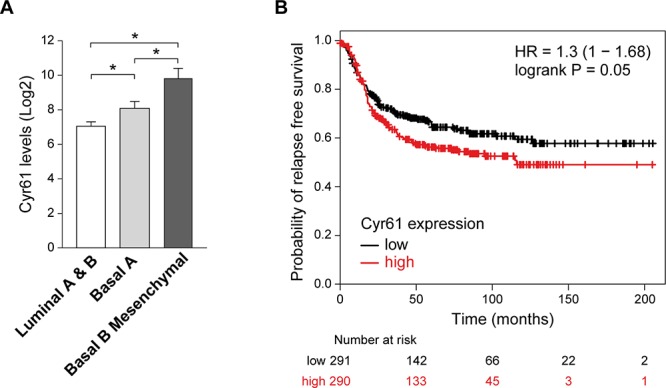
Figure 6. Expression of Cyr61 in breast cancer.

A. Different expression levels of Cyr61 in human cell lines of breast cancer of Luminal A (ER +), Luminal B (ER-), Basal A, and Basal B (i.e. with epithelial to mesenchymal transition). Notice that the last group shows the higher levels of Cyr61 expression. Below, Cyr61 is significantly expressed at higher levels in cell lines that had undergone epithelial to mesenchymal transition. Figure generated from the available database [59]. Comparison among groups was done by ANOVA followed by Tukey post-hoc test. B. Levels of Cyr61 expression define tumor prognosis of patients with breast cancer of basal origin. Figure generated with the Kaplan-Meier plotter available at the web page: http://kmplot.com/analysis/index.php?p=service from the database [62].
