
Figure 3.
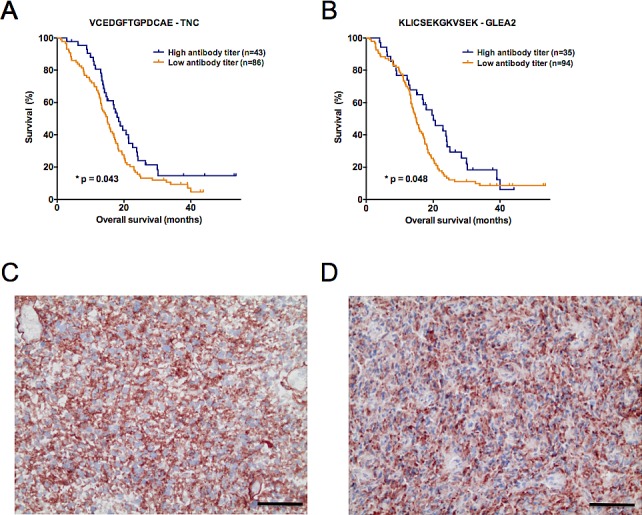
(A, B) Kaplan-Meier plots illustrating the antibody titers with a significant predictive performance in the second validation study set (n = 129). Autoantibodies against (A) VCEDGFTGPDCAE – TNC and (B) KLICSEKGKVSEK – GLEA2 significantly predicted patient survival (overall survival). As for validation set 1, a high antibody titer denotes a signal intensity belonging to the 1st quartile of ranked signal intensities on the Top30 printed peptide array. Log-rank p-value is given in each plot. (C, D) Protein expression of tenascin-C (red color) analyzed by immunohistochemistry on cryosections of long- and short-term surviving GBM patients. Representative stainings in (C) LTS and (D) STS patients are shown. Black scale bar denotes 50 μm.