Abstract
We report on a novel acoustic radiation force orthogonal excitation optical coherence elastography (ARFOE-OCE) technique for imaging shear wave and quantifying shear modulus under orthogonal acoustic radiation force (ARF) excitation using the optical coherence tomography (OCT) Doppler variance method. The ARF perpendicular to the OCT beam is produced by a remote ultrasonic transducer. A shear wave induced by ARF excitation propagates parallel to the OCT beam. The OCT Doppler variance method, which is sensitive to the transverse vibration, is used to measure the ARF-induced vibration. For analysis of the shear modulus, the Doppler variance method is utilized to visualize shear wave propagation instead of Doppler OCT method, and the propagation velocity of the shear wave is measured at different depths of one location with the M scan. In order to quantify shear modulus beyond the OCT imaging depth, we move ARF to a deeper layer at a known step and measure the time delay of the shear wave propagating to the same OCT imaging depth. We also quantitatively map the shear modulus of a cross-section in a tissue-equivalent phantom after employing the B scan.
Because elastography is able to noninvasively image and measure the elastic properties of a soft tissue, it has been used for medical diagnosis and tissue characterization, such as breast tumor detection [1], liver disease monitoring [2], examination of ocular and periocular structures [3], and measurement of cardiac function [4]. Conventional imaging methods include ultrasound elastography [5,6] and magnetic resonance elastography [7]. In the last decade, OCT has revealed superiority for elastography due to its high-speed and high-spatial-resolution imaging [8].
In an optical coherence elastography (OCE) application, the OCT unit is used for detection of elastic vibration, and different excitation sources are employed to generate an elastic wave in soft materials, including non-contact focused air-puff device [9,10] and ultrasonic transducer [11–14], and contact mechanical wave driver [15] and piezoelectric actuator [16,17]. The noncontact air-puff device has conveniently detected the elastic modulus of the cornea [9]. However, in order to detect elastic properties inside the tissues, the acoustic radiation force (ARF) has greater potential because it can easily focus on the deeper tissue, such as the lens [14].
ARF-based OCE (ARF-OCE) has been employed to measure the shear wave and the longitudinal vibration. Different from longitudinal vibration detection for the qualitative measurement of elastic properties, shear wave propagation velocity is directly related to the stiffness of a soft tissue, so visualization of shear wave propagation using OCE can quantitatively measure the shear modulus. In previous shear wave detection using ARF-OCE methods, ARF-induced axial displacement was parallel to the OCT detection beam, and phase changes were detected by a Doppler OCT unit [11,13]. However, the phase changes may be distorted by bulk motion and phase wrapping, and the elastic property can only be detected on the shallow surface of the tissue, which is usually less than 2 mm on the surface.
In this work, we report on a novel acoustic radiation force orthogonal excitation optical coherence elastography (ARFOE-OCE) technique where the acoustic radiation direction is perpendicular to the optical detection direction, and the ARF-induced tissue vibrations are detected by a Doppler variance method instead of Doppler OCT method. The vibration induced by ARF excitation is perpendicular to the OCT beam, and the shear wave propagates along the OCT beam. Both phase-resolved Doppler variance and intensity-based Doppler variance (IBDV) can be used to measure the transverse vibration [18–20]. Using this system, we directly measure the propagation velocity of the shear wave at different depths of one location with an M scan. By moving the ARF focus to a deeper position and measuring the time delay of detected transverse vibration, we calculate the shear modulus at the position beyond the OCT imaging depth. Finally, we measure the shear wave propagation in a two-layer phantom and subsequently map the shear modulus of a cross-section utilizing a cross-sectional B scan.
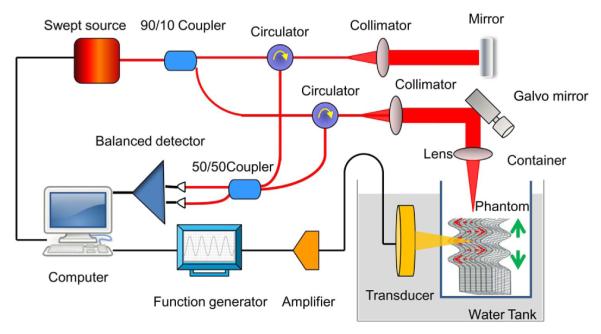
The schematic of the ARFOE-OCE system is illustrated in Fig. 1. It mainly includes two units: an ARF generation unit and an OCT unit. For ARF generation, an ultrasonic transducer with a resonant frequency of 4.5 MHz, a focus length of 29.7 mm, an axial full width at half-maximum power (FWHM) of 8 mm, and a diameter of 20 mm is driven by a burst consisting of 4500 cycles of the sine wave amplified by a broadband power amplifier, corresponding to a 1.0 ms emission at 160 V peak-to-peak.
Fig. 1.

Experimental setup for shear modulus measurement using ARFOE-OCE. The acoustic radiation direction is perpendicular to the optical detection direction. ARF induced vibration (dashed arrows) is perpendicular to the OCT beam and the shear wave propagates (solid arrows) along the OCT beam.
The OCT system is based on a swept source with a central wavelength of 1310 nm, an A-line speed of 50 kHz, and a total average power of 16 mW. Ninety percent of the laser light power is split to the sample after passing through a two-axial galvo scanning mirror and a scan lens with a focusing length of 36 mm. A dual-balanced detection scheme is used to acquire the signal. The axial resolution of the OCT image is 9.72 μm/pixel. In order to measure the propagation velocity of the shear wave at one location, 1000 A-lines at a rate of 50 kHz are involved in one M scan. Each M scan totally takes 20.0 ms and contains a burst of 1.0 ms for ARF generation at the beginning of each M scan. For 2D mapping of the shear modulus, a B-scan contains 500k A-lines at 500 lateral positions. After the alignment using a hydrophone, OCT beam scans along the ARF direction directly above the ARF focus area, so the wave propagation is simplified in a 2D plane. Considering the propagation direction and velocity, the detected wave along the OCT beam is dominated by the shear wave. The B-scan range is about 2.7 mm, which is much smaller than ARF FWHM, and so the induced wave is simplified to be a plane shear wave propagating parallel to the OCT beam in this range.
The tissue-equivalent phantom is placed in a thin-film container through which the ultrasound can pass. The thin-film container and US transducer are immersed in water. The acoustic radiation direction is perpendicular to the OCT detection direction.
In order to extract the vibration information from the OCT data, Doppler variance methods can be employed, which are sensitive to the transverse vibration. As the IBDV method and phase-resolved Doppler variance method provide similar measurement results, only IBDV method is used in this study as an example to explain the measurement principle [18]. Briefly, the vibration intensity is directly related to the intensity-based Doppler variance σ2, which is calculated by the following equation:
| (1) |
where Ii,z is the complex data at the A-line of i and the depth of z. Both M and N are equal to 4 for lateral and depth averaging in this study. This method uses intensity information for vibration detection instead of phase information. It especially works better if the vibration direction is perpendicular to the optical detection direction when compared with Doppler OCT method [18]. Doppler variance method is less sensitive to detect the vibration along the optical detection direction, and thus cannot detect the compression wave propagating along the OCT beam.
After obtaining the vibration information from the M scan, the propagation velocity of the shear wave at different depths of each location can be measured by calculation of the propagation depth during a time interval. The relation between the propagation velocity of the shear wave and the shear modulus is described by the simplified equation [5]:
| (2) |
where μx,z and Cx,z are, respectively, the shear modulus and the propagation velocity of the shear wave at the lateral location of x and the depth of z, and ρ is the density of the soft tissue.
The Young’s modulus Ex,z of a tissue-equivalent phantom is also measured directly by a MTS Synergie 100 mechanical test system. Considering the Poisson’s ratio of 0.5 for the soft phantom, the relationship between shear modulus and Young’s modulus is provided by the following equation [5]:
| (3) |
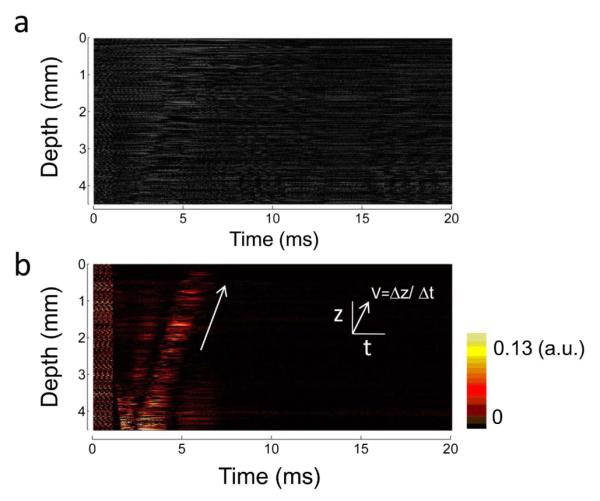
A 0.6% agar phantom, containing 0.4% intralipid for the increase of the backscattered signals, is detected by the ARFOE-OCT system. Figure 2(a) shows the OCT image in M mode and Fig. 2(b) shows the corresponding IBDV image. The ultrasonic transducer generates an acoustic force, resulting in a transverse displacement of the materials in the phantom. In Fig. 2(b), high-frequency vibrations are observed during an ARF burst. After the ARF is eliminated, the induced vibrations with a lower frequency establish the shear wave propagating from the ARF focus. The shear wave propagation is parallel to the axial direction of the optical detection and perpendicular to the vibration direction. By measuring propagation depth during a time interval, the shear wave velocity can be calculated to be equal to 1.4 m/s. The corresponding shear modulus is 2.0 kPa using Eq. (2). Only an M-mode scan is required for the measurement of the shear wave propagation using this system. The data processing is much simpler than data analysis of the B scan.
Fig. 2.

Measurement of shear wave propagation at one location. (a) M-mode OCT image. The signals are recorded during and after an ARF burst. (b) IBDV image analyzed from the M-mode OCT data. The vibrations in a range of depths are visualized in the process of time. The arrow indicates that the shear wave propagates from the ARF focus to the surface of the phantom.
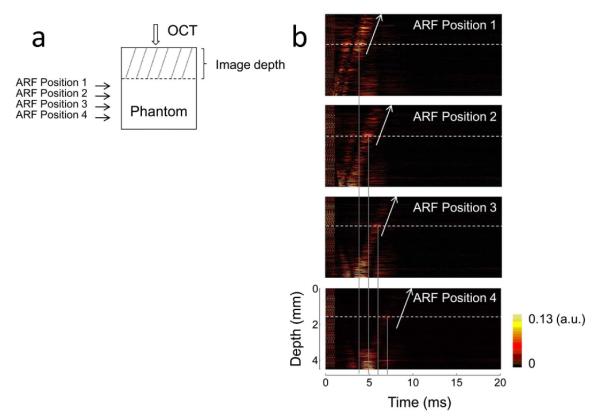
Due to the limit of the OCT imaging depth, the shear wave propagation can be detected in a range of the depth less than 5 mm. In order to detect the shear wave propagation in a deeper phantom, we can move the ultrasonic transducer downward at a step of 1 mm [see Fig. 3(a)] using a mechanical Z stage and measure the time delay of the shear wave propagating to the same depth of the phantom. The vibrations induced by the ARF located at different positions are shown in Fig. 3(b). Right shifts of the vibrations can be observed when the transducer is moved downward because the vibrations will be delayed when the shear wave travels a longer distance. However, there are no obvious changes in propagation velocities from Fig. 3(b), so the propagation velocities in the OCT imaging area are stable. From ARF focus positions 1 to 4, the corresponding waves show intensity attenuation and time delay. The average velocity C of the shear wave propagating from position 4 to 1 can be calculated to be equal to 1.1 m/s by ΔD/ΔT, where ΔD is the distance between positions 4 and 1, and ΔT is the delay time of the detected vibration at the same depth when the ARF focus is moved from positions 1 to 4. The corresponding shear modulus calculated by Eq. (2) is 1.2 kPa. The differences of propagation velocity and shear modulus between the deeper phantom estimated by this method and the shallower phantom calculated from Fig. 2(b) may be partly due to the differences of stiffness in the phantom. The shallower layer has more moisture loss than the deeper layer in the phantom. The axial spatial resolution for shear wave measurement depends on the axial resolution of the OCT system and ΔTmin · C, where ΔTmin is the minimum A-line interval. The maximum detection depth depends on the attenuation of shear wave along the propagation direction and the sensitivity of the OCT system for the vibration detection. By moving the ARF positions to the deeper layer of a phantom, the OCE measurement depth extends to about 7.5 mm in this study, including 4.5 mm in the OCT imaging depth and about 3 mm beyond the OCT imaging depth.
Fig. 3.

Shear wave measurement with different ARF focus positions. (a) A schematic of the ARF excitation positions and OCT detection position. The position of OCT detection beam and the phantom are fixed. The ultrasonic transducer is moved downward at a step of 1 mm using a mechanical Z stage. (b) IBDV images with different ARF focus positions. Dashed lines indicate the same depth of the phantom and solid lines indicate the time of vibration at this depth. The vibrations at same depth are delayed when the transducer is moved downward. The propagation velocity of the shear wave around the ARF focus located at the deeper phantom can be calculated using the change of ARF position and the delay of detected vibration time.
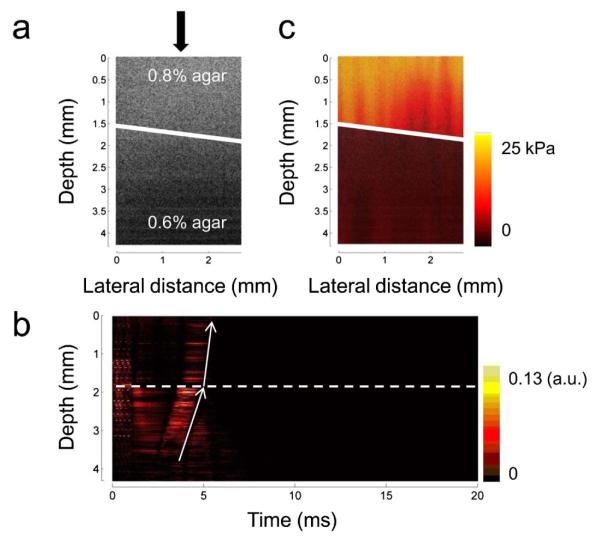
After detection of the shear wave in a homogeneous phantom, the cross-sectional map of the shear modulus is measured in a bi-layer phantom where the top layer is made of a 0.8% agar solution and the bottom layer is made of a 0.6% agar solution. The B-mode OCT image is shown in Fig. 4(a), and the boundary between the two layers is indicated by a white line. From the OCT image, there are no obvious differences between the two layers of the phantom with different agar concentrations. After ARF is applied and the M-mode OCT data at each location is analyzed by the IBDV method, an obvious difference of the slope between the two layers can be observed in Fig. 4(b), which shows a change in the propagation velocity through two layers. In the bottom layer of the phantom with a lower agar concentration, the stiffness is lower and the propagation velocity is lower while in the top layer of the phantom, the propagation velocity is higher due to a higher agar concentration. After this analysis is performed at each location incorporating B-scan OCT, the distribution of the propagation velocity in a 2D plane can be measured. Using Eq. (2), a map of the shear modulus can be obtained, which is shown in Fig. 4(c). The boundary of two layers with different agar concentrations can be identified clearly in the phantom. The shear modulus is 9.8 kPa for the top layer and 2.2 kPa for the bottom layer, which indicates the higher stiffness in the top layer. Using a mechanical test system, the shear modulus is 5.1 kPa for a homogeneous 0.8% agar phantom and 1.2 kPa for a homogeneous 0.6% agar phantom, respectively. Here ARFOE-OCE measures the shear modulus of shallow layer in the OCT imaging range (~4 mm thickness), which may be larger than the value of a whole phantom (~10 mm thickness) measured by a mechanical test system due to more moisture loss in the shallow layer. By moving the ARF positions to the deeper layer of a phantom, the shear modulus of the deeper layer can be measured from Fig. 3, which is closer to the value from the mechanical test system.
Fig. 4.

Measurement of the shear modulus of a bi-layer phantom. (a) Cross-sectional OCT image of a bi-layer phantom. There are no obvious differences between the two layers with different agar concentrations in the phantom (indicated by a solid line). (b) The IBDV image at one location of the bi-layer phantom [indicated by the arrow of Fig. 4(a)]. The propagation velocity changes immediately when the shear wave travels through the interface of the bi-layer phantom (indicated by a dashed line). (c) Cross-sectional map of the shear modulus in the bi-layer phantom. The two layers with different agar concentrations can obviously be identified.
ARF-OCE has the ability to noninvasively map biomechanical properties inside a soft tissue benefitting from the high resolution of OCT and noncontact force generation. ARFOE-OCE system using orthogonal ARF excitation and Doppler variance measurement has four advantages compared with previous methods. First, our configuration can provide higher axial resolution and greater depth for shear wave measurement, compared with previous co-aligned setups. The OCE measurement depth extends beyond the OCT imaging depth. Second, the shear modulus at one location can be measured using the M mode without the need of a B scan. The data processing method will be simpler and quicker, and the system will be simplified when the elastic parameter of a fixed location is required. Third, this system uses Doppler variance to measure shear wave, which is more stable than the previous OCE systems based on the phase shift measurement and will not be distorted by bulk motion and phase wrapping. Finally, co-aligned ARF excitation requires a ring transducer, which is difficult to implement. In current ARF-OCE setups for the ophthalmic applications, ARF excites the sample with an oblique angle to the imaging plane so that it does not block the OCT imaging beam. The ARF-induced vibration may not parallel to the OCT beam, which will result in the low sensitivity for phase detection and complicated wave propagation for the analysis. In addition, co-aligned ARF excitation requires the filling of ultrasound gel between the transducer and the central cornea, which may change the biomechanical properties of ocular tissues. Orthogonal ARF excitation system provides a new opportunity for the probe design in the ophthalmic applications. The ultrasonic wave could reach the target tissue through the outer corner of the eye or the eyelid without the affect on the cornea. The ARFOE-OCE system incorporating orthogonal ARF excitation and Doppler variance method has great potential for in vivo clinical applications where high axial resolution, great depth, and noninvasive mapping of the shear modulus is important.
Acknowledgments
This work was supported by the National Institutes of Health under grants R01EB-10090, R01HL-125084, R01HL-105215, R01EY-021529, P41-EB002182, P41-EB015890.
Footnotes
OCIS codes: (120.0120) Instrumentation, measurement, and metrology; (170.4500) Optical coherence tomography; (170.6935) Tissue characterization; (170.7170) Ultrasound.
Dr. Zhongping Chen has a financial interest in OCT Medical Inc, which, however, did not support this work.
References
- 1.Bercoff J, Chaffai S, Tanter M, Sandrin L, Catheline S, Fink M, Gennisson JL, Meunier M. Ultrasound Med. Biol. 2003;29:1387. doi: 10.1016/s0301-5629(03)00978-5. [DOI] [PubMed] [Google Scholar]
- 2.Carstensen EL, Parker KJ, Lerner RM. Ultrasound Med. Biol. 2008;34:1535. doi: 10.1016/j.ultrasmedbio.2008.03.002. [DOI] [PubMed] [Google Scholar]
- 3.Detorakis ET, Drakonaki EE, Tsilimbaris MK, Pallikaris IG, Giarmenitis S. Ophthalmic Surg. Lasers Imaging. 2010;41:135. doi: 10.3928/15428877-20091230-24. [DOI] [PubMed] [Google Scholar]
- 4.Elgeti T, Beling M, Hamm B, Braun J, Sack I. J. Cardiovasc. Magn. Reson. 2010;12:60. doi: 10.1186/1532-429X-12-60. [DOI] [PMC free article] [PubMed] [Google Scholar]
- 5.Nightingale K, McAleavey S, Trahey G. Ultrasound Med. Biol. 2003;29:1715. doi: 10.1016/j.ultrasmedbio.2003.08.008. [DOI] [PubMed] [Google Scholar]
- 6.Ma T, Qian X, Chiu CT, Yu M, Jung H, Tung Y-S, Shung KK, Zhou Q. Quant. Imaging Med. Surg. 2014;5:108. doi: 10.3978/j.issn.2223-4292.2014.11.27. [DOI] [PMC free article] [PubMed] [Google Scholar]
- 7.Muthupillai R, Lomas DJ, Rossman PJ, Greenleaf JF, Manduca A, Ehman RL. Science. 1995;269:1854. doi: 10.1126/science.7569924. [DOI] [PubMed] [Google Scholar]
- 8.Schmitt J. Opt. Express. 1998;3:199. doi: 10.1364/oe.3.000199. [DOI] [PubMed] [Google Scholar]
- 9.Wang S, Larin KV. Opt. Lett. 2014;39:41. doi: 10.1364/OL.39.000041. [DOI] [PMC free article] [PubMed] [Google Scholar]
- 10.Wang S, Lopez AL, Morikawa Y, Tao G, Li J, Larina IV, Martin JF, Larin KV. Biomed. Opt. Express. 2014;5:1980. doi: 10.1364/BOE.5.001980. [DOI] [PMC free article] [PubMed] [Google Scholar]
- 11.Nguyen TM, Song S, Arnal B, Huang Z, O’Donnell M, Wang RK. Opt. Lett. 2014;39:838. doi: 10.1364/OL.39.000838. [DOI] [PMC free article] [PubMed] [Google Scholar]
- 12.Qi W, Li R, Ma T, Kirk Shung K, Zhou Q, Chen Z. Appl. Phys. Lett. 2014;104:123702. doi: 10.1063/1.4869562. [DOI] [PMC free article] [PubMed] [Google Scholar]
- 13.Nguyen TM, Arnal B, Song S, Huang Z, Wang RK, O’Donnell M. J. Biomed. Opt. 2015;20:016001. doi: 10.1117/1.JBO.20.1.016001. [DOI] [PMC free article] [PubMed] [Google Scholar]
- 14.Wu C, Han Z, Wang S, Li J, Singh M, Liu CH, Aglyamov S, Emelianov S, Manns F, Larin KV. Invest. Ophthalmol. Vis. Sci. 2015;56:1292. doi: 10.1167/iovs.14-15654. [DOI] [PMC free article] [PubMed] [Google Scholar]
- 15.Liang X, Oldenburg AL, Crecea V, Chaney EJ, Boppart SA. Opt. Express. 2008;16:11052. doi: 10.1364/oe.16.011052. [DOI] [PMC free article] [PubMed] [Google Scholar]
- 16.Kennedy BF, Liang X, Adie SG, Gerstmann DK, Quirk BC, Boppart SA, Sampson DD. Opt. Express. 2011;19:6623. doi: 10.1364/OE.19.006623. [DOI] [PMC free article] [PubMed] [Google Scholar]
- 17.Song S, Huang Z, Nguyen TM, Wong EY, Arnal B, Donnell MO, Wang RK. J Biomed Opt. 2013;18:121509. doi: 10.1117/1.JBO.18.12.121509. [DOI] [PMC free article] [PubMed] [Google Scholar]
- 18.Liu G, Lin AJ, Tromberg BJ, Chen Z. Biomed. Opt. Express. 2012;3:2669. doi: 10.1364/BOE.3.002669. [DOI] [PMC free article] [PubMed] [Google Scholar]
- 19.Liu G, Chou L, Jia W, Qi W, Choi B, Chen Z. Opt. Express. 2011;19:11429. doi: 10.1364/OE.19.011429. [DOI] [PMC free article] [PubMed] [Google Scholar]
- 20.Zhao Y, Chen Z, Saxer C, Shen Q, Xiang S, de Boer JF, Nelson JS. Opt. Lett. 2000;25:1358. doi: 10.1364/ol.25.001358. [DOI] [PubMed] [Google Scholar]


