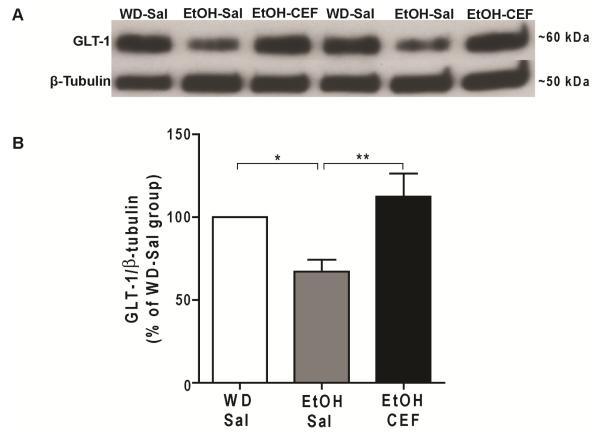
Figure 4.
Effect of voluntary ethanol drinking and CEF treatment on GLT-1 expression level in NAc. A. Representative Western blots for GLT-1 and β-tubulin as loading control. B. GLT-1 level was significantly downregulated in NAc of EtOH-Sal group compared to WD-Sal group. CEF treatment restored GLT-1 level in NAc of EtOH-CEF group compared to EtOH-Sal group. *p<0.05, **p<0.01 (n=8/group). WD, water drinking; Sal, saline; EtOH, ethanol; CEF, ceftriaxone.

