Abstract
Hypothesis
Intracochlear sound pressures (PIC) and velocity measurements of the stapes, round window, and promontory (VStap/RW/Prom) will show frequency dependent attenuation using magnet-based, transcutaneous bone-conduction implants (TCBCI) in comparison to direct-connect, skin-penetrating implants (DCBCI).
Background
TCBCIs have recently been introduced as alternatives to DCBCIs. Clinical studies have demonstrated elevated high-frequency thresholds for TCBCIs as compared to DCBCIs; however, little data exists examining the direct effect of skin thickness on the cochlear input signal using TCBCIs.
Methods
Using seven cadveric heads, PIC was measured in the scala vestibuli and tympani with fiber-optic pressure sensors concurrently with VStap/RW/Prom via laser Doppler vibrometry. Ipsilateral titanium implant fixtures were placed and connected to either a DCBCI or TCBCI. Soft tissue flaps with varying thicknesses (no flap, 3, 6, and 9 mm) were placed successively between the magnetic plate and sound processor magnet. A bone-conduction transducer coupled to custom software provided pure tone stimuli between 120 to 10240 Hz.
Results
Stimulation via the DCBCI produced the largest response magnitudes. The TCBCI showed similar PSV/ST and VStap/RW/Prom with no intervening flap, and a frequency-dependent, non-linear reduction of magnitude with increasing flap thickness. Phase shows a comparable dependence on transmission delay as the acoustic baseline, and the slope steepens at higher frequencies as flap thickness increases suggesting a longer group delay.
Conclusions
Proper soft tissue management is critical to optimize the cochlear input signal. The skin thickness related effects on cochlear response magnitudes should be taken into account when selecting patients for a TCBCI.
Keywords: Bone conduction hearing implant, transcutaneous magnet-based bone conduction implant, intracochlear pressure
Introduction
Bone-conduction hearing implants (BCI) utilize bone conduction (BC) to deliver sound directly to the inner ear and can be used to treat conductive/mixed hearing loss (CHL/MHL) and single-sided deafness (SSD). BC hearing has been acknowledged for many centuries, and early designs used a sound processor (or sound source) held to a tooth or the skin of the mastoid by a metal headband [1]. These devices had limited success due to high attenuation and distortion from intervening soft tissue and did not become more successful until direct transmission to bone via osseointegration was achieved in the 1970s [1–2].
Current BCIs utilize an osseointegrated titanium implant directly connected to a skin-penetrating abutment to which a sound processor is attached (DCBCI). Recently, transcutaneous bone-conduction implants (TCBCIs) have been introduced to address drawbacks associated with DCBCIs (skin infections/reactions, and implant loss) [3–6]. One example device uses an osseointegrated titanium fixture linked to a magnetic plate that is covered by soft tissue and skin. The implant is stimulated transcutaneously with a sound processor attached to a second magnetic plate.
While maintaining intact skin is advantageous, TCBCIs may suffer from decreased performance due to the indirect connection of the processor to the mastoid bone. In particular, it is unclear how the intervening soft tissue affects the transfer of sound from the processor to the osseointegrated fixture. This issue is further compounded by individual patient factors, as significant differences have been shown in the thickness of skin behind the ear [9].
To explore these questions, we combine laser Doppler vibrometry (LDV) and intracochlear sound pressure (PIC) measurements to compare the cochlear input signal between DCBCIs and TCBCIs with various soft tissue thicknesses. These methods are well suited to the study of BC hearing as they enable quantification of input signals to the cochlea through non-ossicular pathways. [10–12].
Materials and Methods
Seven fresh-frozen whole heads with intact temporal bones and no history of middle ear disease were obtained and evaluated (Lone Tree Medical, Littleton, CO, USA). The use of cadaveric human tissue complied with the University of Colorado Institutional Biosafety Committee (COMIRB EXEMPT #14-1464).
Temporal Bone Preparation
Temporal bone preparation was similar to methods described previously by our laboratory [13,14], as well as other authors [10]. The specimens were thawed in warm water, and inspected for any damage. A canal-wall-up mastoidectomy and extended facial recess approach was performed to visualize the incus, stapes, and RW [10]. The cochlear promontory near the oval and round windows was thinned with a small diamond burr in preparation of pressure sensor insertion into the scala vestibuli (SV) and scala tympani (ST). A BI300 4 mm titanium implant fixture (Cochlear Americas, Centennial, CO) was placed on temporal line approximately 55 mm from the external auditory canal (EAC).
The full cephalic specimens were fastened to a Mayfield Clamp (Integra Lifesciences Corp., Plainsboro, NJ) attached to a stainless steel baseplate. Cochleostomies into the ST and SV were created under a droplet of water using a fine pick. Pressure sensors (FOP-M260-ENCAP, FISO Inc., Quebec, QC, Canada), were inserted into the SV and ST using micromanipulators (David Kopf Instruments, Trujunga, CA) mounted on the Mayfield Clamp, and sealed to the cochlea with alginate dental impression material (Jeltrate; Dentsply International Inc., York, PA).
Out-of-plane velocity of the middle ear structures was measured with a single-axis LDV (OFV-534 & OFV-5000; Polytec Inc., Irvine, CA) mounted to a dissecting microscope (Carl Zeiss AG, Oberkochen, Germany). Microscopic retro-reflective glass beads (Polytec Inc., Irvine, CA) were placed on the stapes, RW, and cochlear promontory to ensure a strong LDV signal. In all LDV measurements, the position of the laser was held as constant as possible between experimental conditions, though slight shifts were unavoidable when swapping implants [15–16].
Stimuli Presentation and Data Acquisition
All experiments were performed in a double-walled sound-attenuating chamber (IAC Inc., Bronx, NY). Stimuli were generated digitally, presented to the specimen via a bare (i.e. no sound processing) BC transducer, or a closed-field magnetic speaker (MF1; Tucker-Davis Technologies Inc., Alachua, FL) powered by one channel of a stereo amplifier (SA1), and driven by an external sound card (Hammerfall Multiface II, RME, Haimhausen, Germany) modified to eliminate high-pass filtering on the analog output. Stimuli were generated and responses recorded at 44100 Hz, and controlled by a custom-built program in Matlab (Mathworks Inc., Natick, MA). During baseline air conduction (AC) stimulation, sounds were delivered to the ear canal through a custom-made foam and rigid rubber insert earplug inserted into a speculum, and secured in the ear canal with cyanoacrylate adhesive and sealed with Jeltrate. The sound intensity in the ear canal was measured with a probe-tube microphone (type 4182; Brüel & Kjær, Nærum, Denmark) and signal conditioner (B&K type 2690). The microphone probe tube was inserted through a small hole in the rubber tubing, and placement near the tympanic membrane was verified by visual inspection through the tubing prior to earplug insertion. Stimuli were twenty short tone pips (twenty cycles at each frequency) presented two frequencies per octave between 120 and 10240 Hz. Stimuli were presented for at least three repetitions each at 0, 10, or 20 dB attenuation from 10V amplitude in the stimulus generation software. All responses here are from stimuli at 0 dB attenuation. Input from the microphone, LDV, and pressure sensors were simultaneously captured via the sound card analog inputs.
Data Analysis
Responses measured were chosen in order to assess the output of the middle/inner ear as a function of the input to assess features of the transmission pathway. Thus, responses are shown as transfer functions, i.e. measured velocities (VStap/RW/Prom) and pressures (PSV & PST) are presented normalized to SPL in the EAC (PEC) for AC stimuli, and to the voltage input to the BC transducer (VIN) for BC stimuli, consistent with ASTM F2504 [17]. Resulting transfer functions (HStap/RW/Prom/SV/ST) were computed from the responses of these measures to pure tone stimuli. The magnitude of the LDV signal was adjusted using a cosine correction based upon the difference in angle between the primary axis of the stapes at the capitulum, and the orientation of the LDV laser (usually ~45°). All acquired signals were band-pass filtered between 15 and 15000 Hz with a second order Butterworth filter for data analysis. Values of velocity shown are the average of at least three repetitions, and pressure was recorded continuously with all velocity measurements, thus pressure values shown are average of at least six repetitions. Responses are only shown for measurements with a signal-to-noise ratio (SNR) of greater than 3 dB. Signal strength is indicated in each magnitude figure by symbol size (small, > 3 dB; medium, > 6 dB; large, > 9 dB signal to noise ratio).
Responses to BC stimuli were compared across experimental conditions using a method adapted from Rosowski et al. and the ASTM Standards for Middle Ear Implants F2504-05 [17–18]. That is, transfer functions for BC (HB) and AC (HA) stimulation were compared to derive the equivalent SPL in the ear canal (Leq) required to elicit a given response magnitude. Responses with a SNR below 3 dB, that were flanked in frequency by responses with a higher SNR, were approximated using linear interpolation in order to provide a more complete comparison across frequency. This method allows for natural comparisons across experimental conditions as all measures are represented as an estimate of the sound level produced by the transducer.
Experimental conditions tested
Experiments were designed to assess within and beyond the range of attachment conditions recommended for the TCBCI to test the role of soft tissue thickness on stimulation effectiveness. Responses are described in the following paper with the following naming scheme: superscripts identify the stimulation method (e.g. A: acoustic; BD: direct bone conduction), while subscripts identify the measurement location (e.g. SV: scala vestibuli pressure). Experiments began by assessing each physiological measure in response to AC sound presentation (acoustic baseline recordings; HA). Five BC conditions were subsequently tested. First, the BC transducer was attached directly to a titanium abutment (BC baseline recordings; DCBCI; HBD) via a standard snap coupling (Cochlear Baha Connect; Cochlear Americas, Centennial, CO). Second, the BC transducer was attached to the external magnet of the TCBCI (Cochlear Baha Attract, Centennial, CO), which was placed in direct contact (except for a foam pad) with the internal magnet (HB0mm). Finally, 3 mm (HB3mm), 6 mm (HB6mm), and 9 mm (HB9mm) thick soft tissue flaps were placed between the magnets of the TCBCI. Cadaveric temporoparietal skin with subcutaneous tissue (6 cm diameter) used for this purpose was harvested and thinned at the beginning of each set of experiments. A #5 external BAHA Attract magnet with a Baha Softwear Pad attached was used in all TCBCI conditions.
Results
Closed field acoustic transfer functions
Acoustic closed-field stapes velocity transfer functions ( ; not shown) were computed in order to assess temporal bone condition. Six of seven temporal bones tested met inclusion criteria as their responses largely fell within the 95% confidence interval (CI) band for in normal, healthy specimens reported previously [18], and thus are included in further analysis. A seventh temporal bone was excluded from the study due to the consistently lying outside of the 95% CI band.
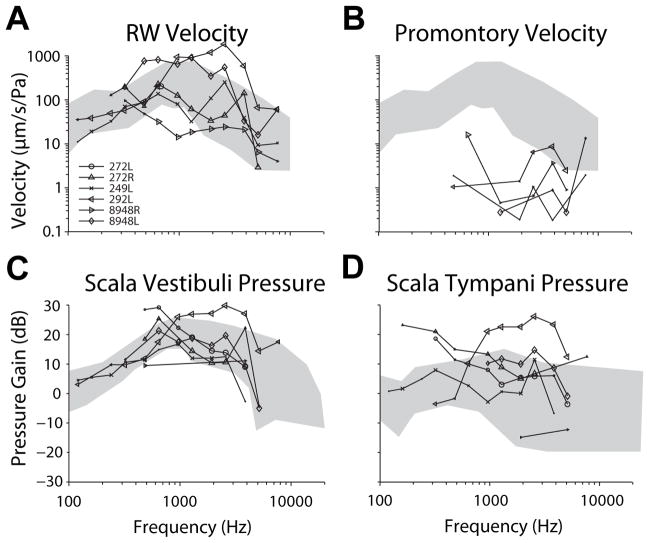
In each specimen, four responses were assessed in response to BC stimuli to assess the vibration of the skull, the relative vibration of the cochlear fluid at the round window, and to measure directly the SPL elicited across the cochlear partition: VRW, VProm, PSV, & PST. Although four responses are assessed, in general, results for all four will be described as a group, except when notable differences are visible. Figure 1 shows transfer functions of these four measures ( ) to closed-field acoustic stimulation between 120 to 10240 Hz in each specimen. and magnitudes (Fig. 1A–B) are shown superimposed on the range of RW velocities shown in two prior reports [15–16] for comparison. Likewise, (Fig. 1C–D) are shown superimposed on the range of responses reported previously [10]. generally showed magnitudes comparable to prior reports, while expectedly shows substantially lower velocities than or .
Figure 1.
Transfer functions of measures ( ) to closed-field acoustic stimulation between 120 to 10240 Hz in each specimen. and magnitudes (Fig. 1A–B) are shown superimposed on the range of RW velocities shown in two prior reports [15–16] for comparison. Likewise, (Fig. 1C–D) are shown superimposed on the range of responses reported previously [10]. Responses are shown for signal-to-noise ratios greater than 3 dB, and marker size indicates signal strength (small > 3 dB, medium > 6 dB, large > 9 dB).
Bone conducted stimulation transfer functions
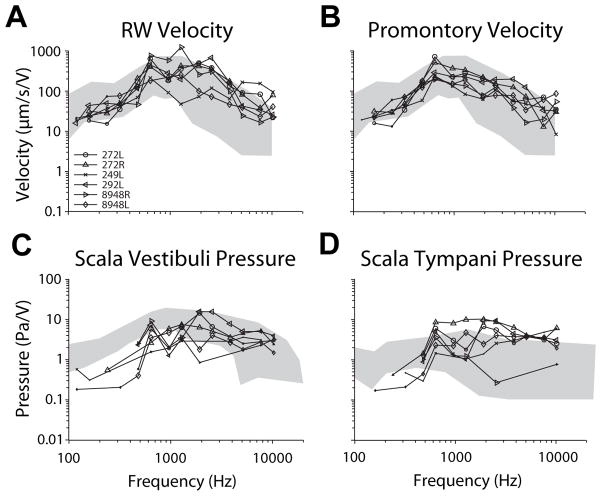
Figure 2 shows transfer function magnitudes of each of the four measures, in each specimen, in response to BC stimuli via a DCBCI ( ). Responses of each measure (in units/V) are shown superimposed on top of the range shown in previous reports to acoustic stimuli (in units/Pa; gray area; same as Fig. 1). Although were measured in response to acoustic stimuli and are normalized to ear canal SPL, generally show similar magnitudes and trends with frequency when normalized to drive voltage. The exception is , which shows substantially greater velocities to BC than air conducted sound presentation. This is expected, as BC stimuli transmit sound by skull vibration, which can be noted at the cochlear promontory.
Figure 2.
Transfer function magnitudes of each of the four measures, in each specimen, in response to BC stimuli via a DCBCI ( ). Responses of each measure (in units/V) are shown superimposed on top of the range shown in previous reports to acoustic stimuli (in units/Pa; gray area; same as Fig. 1).
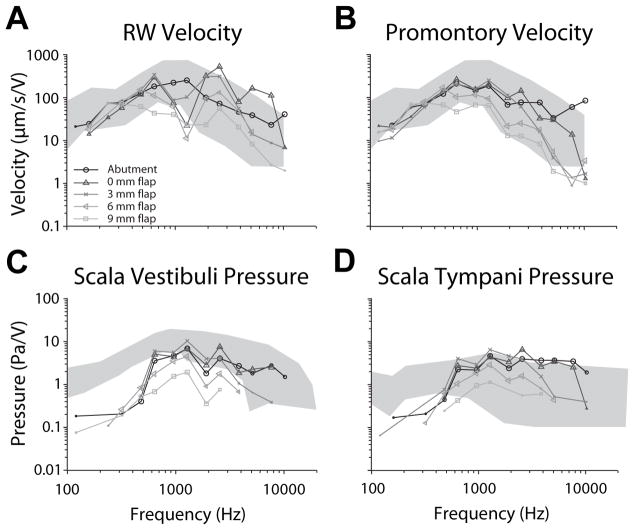
Comparison of across attachment conditions was performed similarly. Transfer function magnitudes from one representative specimen (8948L) are shown in figure 3 for BC via a DCBCI (black; ), and with TCBCIs with intervening , and soft tissue thicknesses (dark through light gray respectively). Response magnitudes were comparable to the DCBCI for TCBCI stimulation with 0 and 3 mm soft tissue flaps, but dropped substantially at higher frequencies (greater than ~1000 Hz) for larger flaps in all signals. RW transfer function shape varies somewhat between DCBCI and TCBCI, which is likely due to the velocity measurement at a slightly different point on the RW membrane [15–16].
Figure 3.
Transfer function magnitudes from one representative specimen (8948L) are shown for BC via a DCBCI (black; ), and with TCBCIs with intervening , and soft tissue thicknesses (dark through light gray respectively).
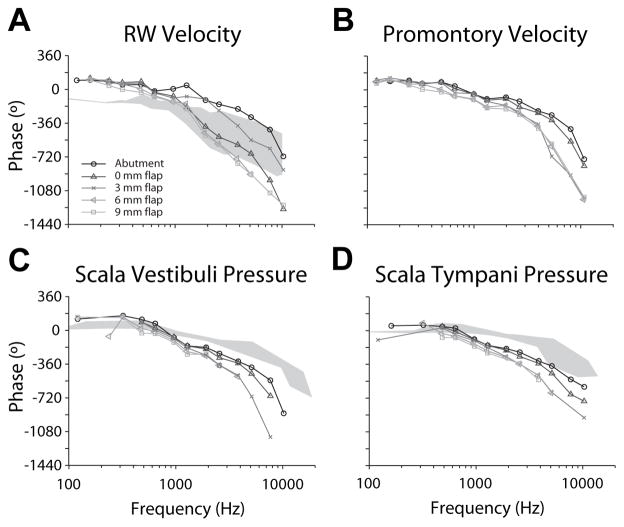
Figure 4 compares transfer function phase of each measure across attachment conditions in one representative specimen (8948L; same as Fig. 3). phase is shown superimposed on VRW phase observed in response to acoustic stimulation ( ) from a previous report [15], while and phases are superimposed onto PSV/ST phase ranges described in another prior report [10]. For , low frequency phase was shifted approximately 180°, and high frequency phase declined more quickly compared to acoustically driven responses across all attachment conditions. Phase decreased quickly at higher frequencies in all four measurements.
Figure 4.
Transfer function phase of each measure across attachment conditions in one representative specimen (8948L; same as Fig. 3). phase is shown superimposed on VRW phase observed in response to acoustic stimulation ( ) from a previous report [15], while and phases are superimposed onto PSV/ST phase ranges described in another prior report [10].
The slope of phase above ~1000 Hz has previously been shown to indicate the group delay from acoustic stimulation when plotted on a linear scale [10]. Here, precise phase transfer function shapes are difficult to calculate due to unwrapping errors resulting from the relatively coarse frequency sampling; however, a consistent trend is visible. The phase decrease was the shallowest, and most closely matched acoustic responses for DCBCI stimulation, the slope was steeper for TCBCI stimulation, and increased with increasing soft tissue thickness. This trend is visible in all four signals (though it is most prominent in RW velocity), and indicates an increasing transmission delay from the BC transducer with skin flap thickness.
Equivalent ear canal sound pressure levels
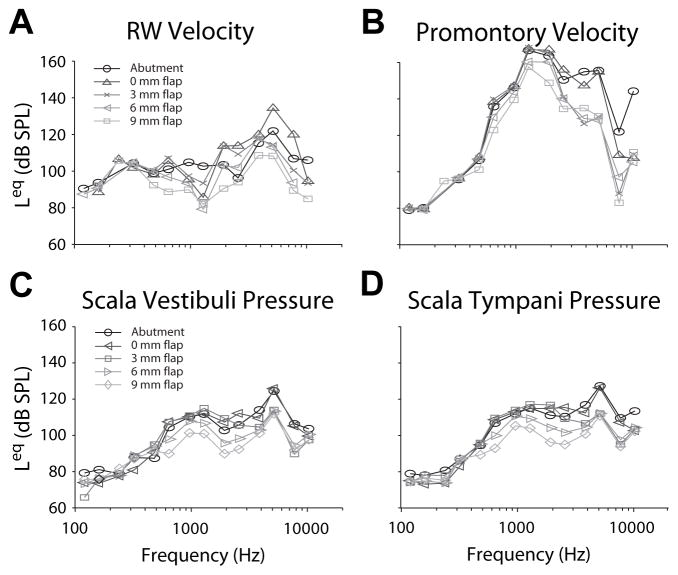
Stimulation effectiveness was assessed by calculating the SPL in the ear canal required to elicit an equivalent response magnitude in VRW, VProm, PST, or PSV [17–18]. The equivalent SPL value (Leq) for each response is shown for one representative specimen (8948L; same as Fig. 3 & 4) in figure 5. Stimulation with a DCBCI produces VRW, PST, & PSV responses that result in Leq values that peak at ~120 dB SPL., Leq responses calculated from VProm are substantially higher, peaking at ~160 dB SPL, which is likely an artifact of the low VProm recorded during stimulation via air conduction. BC via TCBCIs revealed decreasing Leq with increasing skin flap thickness, particularly at high frequencies.
Figure 5.
The equivalent SPL value (Leq) calculated for each response in one representative specimen (8948L; same as Fig. 3 & 4).
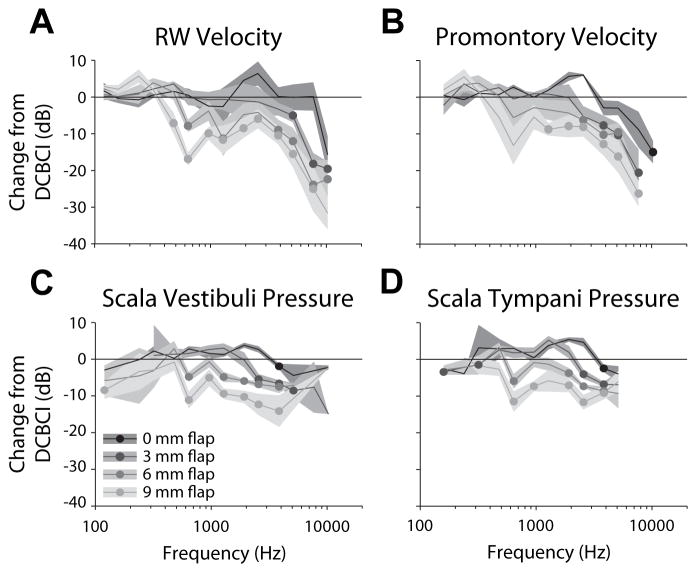
The mean (±SEM) differences in magnitude between each of the TCBCI and the DCBCI (expressed in dB re: DCBCI magnitude) conditions as a function of frequency, across the population of specimens, is shown in figure 6 for each of the four measures recorded. Significance of each difference from the DCBCI response was assessed, for each response measured, with a two-way ANOVA with difference re: DCBCI as the dependent variable, and stimulation condition and frequency as independent variables. All four responses showed significant main effects of frequency (VRW: F13,199 = 17.6, p ≪ 0.001; VProm: F12,114 = 16.2, p ≪ 0.001; PSV: F11,151 = 8.7, p ≪ 0.001; PST: F11,160 = 7.5, p ≪ 0.001), and TCBCI condition (VRW: F3,199 = 20.9, p ≪ 0.001; VProm: F3,114 = 13.3, p ≪ 0.001; PSV: F3,151 = 24.9, p ≪ 0.001; PST: F3,160 = 12.3, p ≪ 0.001), with significant interactions for all but VProm (VRW: F39,199 = 2.2, p ≪ 0.001; VProm: F36,114 = 1.5, p = 0.054; PSV: F33,151 = 2.2, p ≪ 0.001; PST: F33,160 = 2.0, p = 0.002) at the p < 0.05 level. To assess differences across TCBCI conditions from baseline, differences at each frequency were submitted to pairwise testing for each condition.
Figure 6.
The mean (±SEM) differences in magnitude between each of the TCBCI and the DCBCI (expressed in dB re: DCBCI magnitude) conditions as a function of frequency, across the population of specimens. Frequencies at which the mean TCBCI response was significantly lower (via a 1-tailed Student’s t-test) than the DCBCI response (i.e. the mean difference is different than zero) are indicated with filled circles. All t-test results shown have at least two degree of freedom and p < 0.05.
Frequencies at which the mean TCBCI response was significantly lower (via a 1-tailed Student’s t-test) than the DCBCI response (i.e. the mean difference is different than zero) are indicated in figure 6 with filled circles. All t-test results shown have at least two degree of freedom and p < 0.05. In general, both the magnitude of the decrease and the lowest frequency showing that decrease varied systematically in all four signals. Responses to TCBCI stimulation varied between little to no difference compared to DCBCI (except at frequencies > 7 kHz) for a 0mm flap, and decreases of at least 10 dB (and as much as 30 dB) for a 9 mm flap. Similarly, the lowest frequencies at which responses showed significant decreases (excluding points in PSV/ST < 500 Hz) averaged 5973 Hz for no flap, 3520 Hz for 3mm, 1120 Hz for 6mm, and 800 Hz for 9 mm soft tissue flaps, though the velocity measurements tended to show their first significant decreases at higher frequencies than pressures.
Discussion
In this manuscript, we compared the cochlear input signal as measured by PIC with a traditional DCBCI and a new TCBCI with soft tissue thicknesses varying between 0 mm (no soft tissue) and 9 mm. Our results reveal an attenuation of the signal with a TCBCI attachment, when compared to a DCBCI, which worsened with increasing soft tissue thickness between the TCBCI magnets. A non-linear reduction in response magnitude was uniformly observed with increasing soft tissue thickness that was visible above ~6000 Hz with no soft tissue, and above ~800 Hz at 9 mm. Of note, response magnitudes at frequencies important for speech (< ~4000 Hz) were similar at 0 (no flap) and 3 mm while there was a significant decrease in magnitude that extended down to these frequencies with greater soft tissue thicknesses (6 and 9 mm).
These results mirror prior published clinical studies comparing TCBCIs to DCBCIs, with slight differences of frequency ranges. Kurtz et al. compared a DCBCI to the TCBCI used in this study in 16 adult patients using an artificial skin sample with a thickness of 5.6 mm between the magnets of the TCBCI [3]. Their results showed significant attenuation (12–23 dB) with the TCBCI between 4 to 8 kHz when the processor was used a signal generator, and also during measurement aided sound field thresholds with the processor used conventionally as a hearing amplifier, although attenuation was less pronounced in the latter condition (smaller by ~3 dB)[3]. Hol et al. compared a different TCBCI system (Sophono Alpha 1, Boulder, CO) in 6 patients matched to the same number of subjects implanted with a DCBCI [4]. Similarly to Kurtz et al., their results showed poorer aided and speech reception thresholds in the TCBCI group [4].
The mechanism underlying these results is thought to involve reduced transmission from the transducer via the TCBCI compared to the DCBCI due to soft tissue between the implant magnets. However, neither study [3–4] examined the effect of varied soft tissue thickness at the implant site, which is known to differ considerably among patients [9]. Thus, the degree to which stimulation was reduced with varying soft tissue thickness was not explored. A recent study by Faber et al. revealed significant variability in soft tissue thickness (2–11 mm, mean of 5.5 mm) over a proposed implant site among 204 patients [9]. The importance of soft tissue thickness on stimulation effectiveness is therefore of critical importance to the surgeon when implanting the device.
Current manufacturer recommendations for optimal skin thickness is 3 to 6 mm for the TCBCI used in this study, with thinning recommended if greater than 6 mm [19]. Despite these recommendations, no prior studies have examined the differences in stimulation based upon soft tissue thickness. Our results show similar input to the cochlea between the DCBCI and TCBCI when the latter is separated by 3 mm of soft tissue or less (lower end of manufacturer recommendations), and attenuation with soft tissue thickness of 6 mm of greater (higher end of manufacturer recommendations). Our results measuring Leq show the decrease to vary across signals measured, but generally start at ~1100 Hz for the 6 mm flap and ~ 800 Hz for the 9 mm flap. Although it is unknown how the perception of BC sound correlates with PIC, the sound pressure level difference across the basilar membrane (i.e. between the SV and ST), at the base of the cochlea, provides the drive force to the cochlea, thus is expected to correlate with sound perception [10].
When considered with prior clinical studies, these results suggest patients with a TCBCI will experience reduced higher frequency loudness perception and increased aided thresholds compared to those with the DCBCI [3–4]. Furthermore, patients implanted with a TCBCI with soft tissue thicker than 6 mm involve a larger portion of the frequency spectrum critical for speech intelligibility than if thinner than 3 mm or with a DCBCI. Although some compensation may be possible with increased signal processor output, it may only be partial in those with poorer baseline thresholds, especially at higher frequencies, and the increased power requirements may result in poorer device battery life and feedback issues [3].
The additional attenuation of a TCBCI may also be important for those requiring contralateral routing of sound, as in those with SSD. Recent reports have shown transcranial attenuation at both the audiometric and BCI position to be variable between patients and within individuals at adjacent frequencies [21–22]. For those patients with higher baseline levels of transcranial attenuation, the additional signal attenuation from the TCBCI may result in significantly poorer audibility than expected. Although this could potentially be compensated for increased signal processor output, it may only be partially compensated in those with poorer baseline thresholds, especially at higher frequencies, such as above 1000 to 3000 Hz where attenuation is highest [3]. Nevertheless, the potential increase in comfort and reduced skin reactions may outweigh the shortcomings of TCBCIs in all candidates, especially in at risk populations such as children.
Additionally, our results show an increased transmission delay (i.e. group delay) of BC sound with increasing soft tissue thickness with a TCBCI. The significance of a group delay with a TCBCI in comparison to a DCBCI is unclear, but may affect spatial hearing capacities such as sound localization in unilaterally deaf or bilaterally implanted patients. Prior studies examining BCI users with both CHL with an ipsilateral implant [23–24] and SSD with a contralateral implant show improved sound localization performance and auditory awareness in some cases [23,25–28]. Although it was not possible to examine binaural processing with our current study design, this possibility suggests new avenues for future testing with this same experimental model.
Conclusion
PIC offers an ideal method to study the cochlear input signal with BC hearing as it offers a measure of direct cochlear stimulation by unconventional means. We have shown a non-linear decrease in this input signal with a TCBCI with increasing soft tissue thickness in comparison to a DCBCI. Most notably, the cochlear input signal with a 3 mm soft tissue thickness was similar to a traditional DCBCI, whereas a doubling to 6 mm thickness revealed a significant decrease in signal, particularly for frequencies critical for speech intelligibility. These values for soft tissue thickness are at the lower and upper limits of manufacturer recommendations, respectively, and illustrate the importance of proper soft tissue management during TCBCI placement.
Acknowledgments
Funding was provided by NIH/NIDCD T32 DC012280 (NTG). We appreciate the assistance of Dr. Michael Hall in constructing some of the custom experimental equipment (support by NIH grant P30 NS041854).
Footnotes
Conflict of Interest Statement:
Stephen P. Cass is a on the Surgical Advisory Board for Cochlear Corporation.
James R. Easter is an employee at Cochlear Boulder LLC.
Resources
- 1.Mudry A, Tjellstrom A. Historical background of bone conduction hearing devices and bone conduction hearing aids. Adv Otorhinolaryngol. 2011;71:1–9. doi: 10.1159/000323569. [DOI] [PubMed] [Google Scholar]
- 2.Tjellstrom A, Lindstrom J, Hallen O, Albrektsson T, Branemark P. Osseointegrated titanium implants in the temporal bone: a clinical study on bone-anchored hearing aids. Am J Otol. 1981;2(4):304–310. [PubMed] [Google Scholar]
- 3.Kurz A, Flynn M, Caversaccio M, Kompis M. Speech understanding with a new implant technology: a comparative study with a new nonskin penetrating Baha system. Biomed Res Int. 2014 doi: 10.1155/2014/416205. Epub ahead of print. [DOI] [PMC free article] [PubMed] [Google Scholar]
- 4.Hol M, Nelissen R, Agterberg J, Cremers C, Snik A. Comparison between a new implantable transcutaneous bone conductor and percutaneous bone-conduction hearing implant. Otol Neurotol. 2013;34(6):1071–1075. doi: 10.1097/MAO.0b013e3182868608. [DOI] [PubMed] [Google Scholar]
- 5.Kiringoda R, Lustig L. A meta-analysis of the complications associated with osseointegrated hearing aids. Otol Neurotol. 2013;34(5):790–794. doi: 10.1097/MAO.0b013e318291c651. [DOI] [PubMed] [Google Scholar]
- 6.Dun C, Faber H, de Wolf M, Mylanus E, Cremers C, Hol M. Assessment of more than 1,000 implanted percutaneous bone conduction devices: skin reactions and implant survival. Otol Neurotol. 2012;33(2):192–198. doi: 10.1097/MAO.0b013e318241c0bf. [DOI] [PubMed] [Google Scholar]
- 7.Lloyd S, Almeyda J, Sirimanna K, Albert D, Bailey C. Updated surgical experience with bone-anchored hearing aids in children. J Laryngol Otol. 2007;121(9):826–831. doi: 10.1017/S0022215107003714. [DOI] [PubMed] [Google Scholar]
- 8.De Wolf M, Hol M, Huygen P, Mylanus E, Cremers C. Nijmegen results with application of a bone-anchored hearing aid in children: a simplified surgical technique. Ann Otol Rhinol Laryngol. 2008;117(11):805–814. doi: 10.1177/000348940811701103. [DOI] [PubMed] [Google Scholar]
- 9.Faber H, De Wolf M, de Rooy J, Hol M, Cremers R, Mylanus E. Bone-anchored hearing aid implant location in relation to skin reactions. Arch Otolaryngol Head Neck Surg. 2009;135(8):742–747. doi: 10.1001/archoto.2009.99. [DOI] [PubMed] [Google Scholar]
- 10.Nakajima H, Dong W, Olson E, Merchant S, Ravicz M, Rosowski J. Differential intracochlear sound pressure measurements in normal human temporal bones. J Assoc Res Otolaryngol. 2009;10(1):23–36. doi: 10.1007/s10162-008-0150-y. [DOI] [PMC free article] [PubMed] [Google Scholar]
- 11.Olson E. Observing middle and inner ear mechanics with novel intracochlear pressure sensors. J Acoust Soc Am. 1998;103(6):3445–3463. doi: 10.1121/1.423083. [DOI] [PubMed] [Google Scholar]
- 12.Olson E. Direct measurement of intra-cochlear pressure waves. Nature. 1999;402(6761):526–529. doi: 10.1038/990092. [DOI] [PubMed] [Google Scholar]
- 13.Tringali S, Koka K, Deveze A, Holland N, Jenkins H, Tollin D. Round window membrane implantation with an active middle ear implant: a study of the effects on the performance of round window exposure and transducer tip diameter in human cadaveric temporal bones. Audiol Neurootol. 2010;15(5):291–302. doi: 10.1159/000283006. [DOI] [PMC free article] [PubMed] [Google Scholar]
- 14.Deveze A, Koka K, Tringali S, Jenkins H, Tollin D. Active middle ear implant application in case of stapes fixation: a temporal bone study. Otol Neurotol. 2010;31(7):1027–1034. doi: 10.1097/MAO.0b013e3181edb6d1. [DOI] [PubMed] [Google Scholar]
- 15.Stenfelt S, Hato N, Goode R. Round window membrane motion with air conduction and bone conduction stimulation. Otol Neurotol. 2004;198(1–2):10–24. doi: 10.1016/j.heares.2004.07.008. [DOI] [PubMed] [Google Scholar]
- 16.Stenfelt S, Hato N, Goode R. Fluid volume displacement at the oval and round windows with air and bone conduction stimulation. J Acoust Soc Am. 2004;115(2):797–812. doi: 10.1121/1.1639903. [DOI] [PubMed] [Google Scholar]
- 17.ATSM. ATSM Standard F2504-05. West Conshohocken, PA: 2014. Standard Practice for Describing System Output of Implantable Middle Ear Hearing Devices. [Google Scholar]
- 18.Rosowski J, Chien W, Ravicz M, Merchant S. Testing a method for quantifying the output of implantable middle ear hearing devices. Audiol Neurootol. 2007;12(4):265–276. doi: 10.1159/000101474. [DOI] [PMC free article] [PubMed] [Google Scholar]
- 19.Cochlear 4 Baha Attract System Surgical Procedure: Surgery Guide. Cochlear Americas; Centennial, CO: 2014. [Google Scholar]
- 20.Reinfeldt S, Stenfelt S, Hakansson B. Estimation of bone conduction skull transmission by hearing thresholds and ear-canal sound pressure. Hear Res. 2013;299:19–28. doi: 10.1016/j.heares.2013.01.023. [DOI] [PubMed] [Google Scholar]
- 21.Stenfelt S. Transcranial attenuation of bone-conducted sound when stimulation is at the mastoid and at the bone conduction hearing aid position. Otol Neurotol. 2012;33(2):105–114. doi: 10.1097/MAO.0b013e31823e28ab. [DOI] [PubMed] [Google Scholar]
- 22.Nolan M, Lyon D. Transcranial attenuation in bone conduction audiometry. J Laryngol Otol. 1981;95(6):597–608. doi: 10.1017/s0022215100091155. [DOI] [PubMed] [Google Scholar]
- 23.Grantham D, Ashmead D, Haynes D, Hornsby B, Labadie R, Ricketts T. Horizontal plane localization in single-sided deaf adults fitted with a bone-anchored hearing aid (Baha) Ear Hear. 2012;33(5):595–603. doi: 10.1097/AUD.0b013e3182503e5e. [DOI] [PubMed] [Google Scholar]
- 24.Agterberg M, Snik A, Hol M, et al. Improved horizontal directional hearing in bone conduction device users with acquired unilateral conductive hearing loss. J Assoc Res Otolaryngol. 2011;12(1):1–11. doi: 10.1007/s10162-010-0235-2. [DOI] [PMC free article] [PubMed] [Google Scholar]
- 25.Wazen J, Spitzer J, Ghossaini S, et al. Transcranial contralateral cochlear stimulation in unilateral deafness. Otolarngol Head Neck Surg. 2003;129(3):248–254. doi: 10.1016/S0194-5998(03)00527-8. [DOI] [PubMed] [Google Scholar]
- 26.Bosman A, Hol M, Snik A, Mylanus E, Cremers C. Bone-anchored hearing aids in unilateral inner ear deafness. Acta Otolaryngol. 2003;123(2):258–260. doi: 10.1080/000164580310001105. [DOI] [PubMed] [Google Scholar]
- 27.Hol M, Kunst S, Snik A, Bosman A, Mylanus E, Cremers C. Bone-anchored hearing aids in patients with acquired and congenital unilateral inner ear deafness (Baha CROS): clinical evaluation of 56 cases. Ann Otol Rhinol Laryngol. 2010;119:447–454. doi: 10.1177/000348941011900704. [DOI] [PubMed] [Google Scholar]
- 28.Tringali S, Koka K, Jenkins H, Tollin D. Sound location modulation of electrocochleographic responses in chinchilla with single-sided deafness and fitted with an osseointegrated bone-conducting prosthesis. Otol Neurotol. 2014 doi: 10.1097/MAO.0000000000000595. Epub ahead of print. [DOI] [PubMed] [Google Scholar]


