

Abstract
Dystonia is a brain disorder characterized by abnormal involuntary movements without defining neuropathological changes. The disease is often inherited as an autosomal-dominant trait with incomplete penetrance. Individuals with dystonia, whether inherited or sporadic, exhibit striking phenotypic variability, with marked differences in the somatic distribution and severity of clinical manifestations. In the current study, we used magnetic resonance diffusion tensor imaging to identify microstructural changes associated with specific limb manifestations. Functional MRI was used to localize specific limb regions within the somatosensory cortex. Microstructural integrity was preserved when assessed in subrolandic white matter regions somatotopically related to the clinically involved limbs, but was reduced in regions linked to clinically uninvolved (asymptomatic) body areas. Clinical manifestations were greatest in subjects with relatively intact microstructure in somatotopically relevant white matter regions. Tractography revealed significant phenotype-related differences in the visualized thalamocortical tracts while corticostriatal and corticospinal pathways did not differ between groups. Cerebellothalamic microstructural abnormalities were also seen in the dystonia subjects, but these changes were associated with genotype, rather than with phenotypic variation. The findings suggest that the thalamocortical motor system is a major determinant of dystonia phenotype. This pathway may represent a novel therapeutic target for individuals with refractory limb dystonia.
Keywords: diffusion tensor imaging (DTI), dystonia, motor system, tractography
Introduction
Dystonia is defined by co-contraction of agonist and antagonist muscles resulting in involuntary movements, abnormal postures, or both (Fahn et al. 1998). In 75% of dystonia cases, symptoms are not associated with a discrete brain lesion. The disease can be of either inherited or sporadic origin in these individuals (Albanese et al. 2011, 2013). The DYT1 and DYT6 genotypes, associated respectively with mutations at the TOR1A and THAP1 loci (Ozelius et al. 1997; Fuchs et al. 2009), represent the most common inherited forms of the disorder (Breakefield et al. 2008; Tanabe et al. 2009). Functional brain imaging studies have revealed stereotyped changes involving motor networks in manifesting and nonmanifesting carriers of these incompletely penetrant dominant traits (Carbon et al. 2008; Carbon and Eidelberg 2009). More recently, magnetic resonance diffusion tensor imaging (DTI) has revealed characteristic changes in the integrity of cerebellothalamocortical (CbTC) motor pathways in human DYT1 and DYT6 carriers (Argyelan et al. 2009), and in heterozygous knock-in mice containing the endogenous DYT1 mutation (Ulug et al. 2011).
Physiological studies suggest that the CbTC projection system normally regulates motor cortical synaptic plasticity by facilitating the action of inhibitory intracortical interneurons (Aumann 2002; Daskalakis et al. 2004). Dystonia, on the other hand, may involve a failure of this adaptive mechanism (Argyelan et al. 2009; Niethammer et al. 2011). This possibility is supported by DTI studies, showing that the presence or absence of clinical manifestations in dystonia gene carriers is determined by tract changes occurring along the course of the CbTC pathway. Specifically, reductions in structural connectivity involving cerebellothalamic projections (the “proximal” CbTC pathway segment) were observed in mutation carriers, whether or not they exhibited signs and symptoms of the disorder. A second fiber tract abnormality involving thalamocortical projections (the “distal” CbTC pathway segment) was also identified, but only in nonmanifesting gene carriers (Argyelan et al. 2009; Niethammer et al. 2011). These findings, as well as the robust correlations between CbTC tract integrity and motor cortical activity that were observed (Argyelan et al. 2009; Carbon et al. 2011; Ulug et al. 2011), suggest that the distal pathway segment regulates penetrance by controlling the transmission of aberrant cerebellothalamic signals to the cerebral cortex (Niethammer et al. 2011).
In the current study, we extended the tandem lesion model (Argyelan et al. 2009) to explain the substantial phenotypic variability that typifies this disorder. In accordance with this model, we found that clinically relevant thalamocortical projections (i.e., those somatotopically linked to symptomatic body areas) were intact in manifesting gene carriers, and that more severely affected individuals were distinguished by relative preservation of these pathways. In contrast, the same individuals exhibited reductions in the integrity of somatotopic projections related to asymptomatic body areas. Indeed, the latter changes were similar to corresponding measurements obtained in fully nonpenetrant mutation carriers.
Materials and Methods
Subjects
We studied 25 subjects with dystonia (men/women: 11/14, age 45.9 ± 17.1 years). The disorder was inherited in 13 subjects (10 DYT1/3 DYT6) and sporadic in the remaining subjects. The severity of motor manifestations was rated clinically at the time of imaging according to the Burke-Fahn-Marsden Dystonia Rating Scale (BFMDRS) (Burke et al. 1985). A summary of the individual subject data is provided in Supplementary Table 1. All but one of the subjects were treated chronically (>1 year) with botulinum toxin injections. These individuals were scanned 3–4 months after treatment, before the next treatment session. Eight neurologically normal volunteer subjects (men/women: 5/3, age 43.0 ± 9.2 years) served as controls. Because of the very low prevalence of the DYT1 and DYT6 mutations in the general population, it was unlikely (<0.1%) that any of these healthy individuals carried either dystonia gene (Argyelan et al. 2009). All study participants were right handed with normal routine structural MRI scans. Ethical permission for these studies was obtained from the Institutional Review Board of North Shore University Hospital. Written consent was obtained from each subject following detailed explanation of the procedures.
Study Design
The purpose of this study was to investigate phenotypic variability in dystonia using magnetic resonance DTI. The dystonia subjects were divided according to the presence of signs and symptoms in the upper or lower extremities. Leg manifestations are encountered mostly in the genetic forms of the disorder (O'Riordan et al. 2004). Thus, we sought to identify leg-related microstructural differences in inherited dystonia subjects with and without lower limb manifestations (termed LEG and NLEG, respectively) of the disorder. Nonetheless, the findings were substantiated by measurements conducted post-hoc in NLEG scans from subjects with sporadic dystonia. Analogously, microstructural changes related to arm dystonia were sought by comparing subjects with and without upper limb manifestations. However, nearly all of the subjects, whether inherited or sporadic, exhibited upper limb symptoms, particularly involving the dominant right side (Supplementary Table 1). That said, approximately one-third of the subjects (n = 9) had bilateral arm involvement, whereas the remainder had no left arm involvement (n = 14)/no right arm involvement (n = 2). Thus, specific arm-related microstructural changes were sought by comparing subjects with and without left arm involvement (termed LARM and NLARM, respectively). Ten of the latter subjects (2 inherited; 8 sporadic) exhibited symptoms that were restricted to the dominant right arm, without lower extremity involvement (Subjects 6, 8, 15, 16, 18–21, and 23–24 in Supplementary Table 1); one subject had both right arm and leg involvement (Subject 7). The proportion of men to women was 4/3 in LEG, 7/11 in NLEG, 5/6 in LARM, and 6/8 in NLARM.
Magnetic Resonance Imaging
DTI was performed with an 8-channel head coil using the General Electric 3.0 Tesla Signa HDxt scanner at North Shore University Hospital. A single-shot spin-echo EPI sequence was used with 33 diffusion gradient directions and 5 b0 image. The b-value in the diffusion-weighted images was 800 s/mm2. The DTI protocol included 55 slices with 2.5 mm thickness, FOV 240 mm, TE 82.7 ms, TR 15 s, parallel imaging factor of 2, yielding scan time of 9.5 min. Images were zero filled to a matrix size of 256 × 256, yielding an image resolution of 0.9 × 0.9 × 2.5 mm3.
Finger tapping and foot tapping tasks were used in conjunction with functional MRI (fMRI) to localize the arm and leg regions within the somatosensory cortex of each subject/hemisphere. The subjects were trained to perform the tasks with each of the four limbs prior to the imaging session. The fMRI protocol (FOV 240 mm, 40 slices with 3 mm thickness, imaging matrix of 64 × 64, flip angle 77 degrees, TR 2 s, TE 28.3 ms, and scan time 3.5 min) involved a block design, with 7 blocks (4 off and 3 on) each lasting 30 s. In addition, a T1-weighted structural image (FOV 240 mm, 176 slices with 1 mm thickness, imaging matrix of 256 × 256, flip angle 8 degrees, TR 7.6 ms, TE 2.9 ms, TI 650 ms) was acquired for each subject with resolution 0.9 × 0.9 × 1 mm3.
After DTI acquisition, diffusion-weighted images were corrected for eddy current distortions and head motion using the eddy current correction routine in FSL (http://www.fmrib.ox.ac.uk/fsl/). Using the brain extraction tool in the FMRIB library, nonbrain tissue was removed from the images. Diffusion tensor components for each brain pixel were then calculated and fractional anisotropy (FA) maps were determined for all subjects using FSL routines. We registered b0 images to the Montreal Neurological Institute (MNI-152: 1 × 1 × 1 mm3) template using a 12-parameter affine transformation (FLIRT) (Jenkinson et al. 2002); the resulting transformation was then applied to the FA maps to register them to MNI space. Once aligned, the FA images were smoothed using a kernel of 8 mm (FWHM) for group comparison.
Data Analysis
Group Differences
The FA data were interrogated separately for microstructural differences associated with leg and arm manifestations using SPM8 software (http://www.fil.ion.ucl.ac.uk/spm/software/spm8/). These voxel-wise searches were conducted within a predefined hypothesis-testing space in subrolandic white matter (Fig. 1A, blue). This three-dimensional volume was specified using FA maps from a previously published cohort of nonmanifesting DYT1 and DYT6 carriers (n = 7), manifesting carriers of these mutations (n = 12), and gene-negative healthy control subjects (n = 8) (Argyelan et al. 2009). A hypothesis-testing search volume (Supplementary Table 2) was defined by the control > nonmanifesting carrier contrast in this dataset. This space (volume = 2857 mm3) was considered “penetrance-related” in that within it, nonmanifesting carriers exhibited lower FA than either manifesting carriers or healthy control subjects (Argyelan et al. 2009; Ulug et al. 2011).
Figure 1.
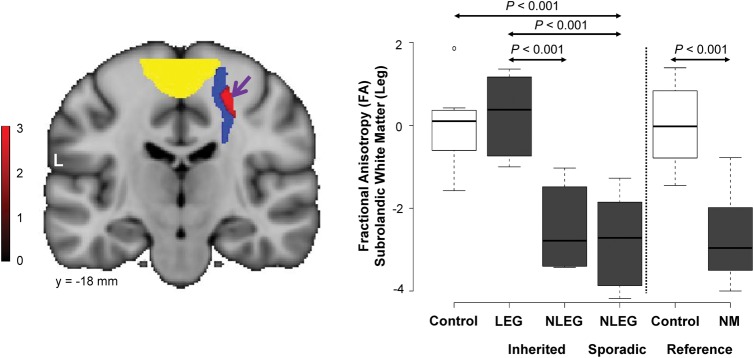
Microstructural changes associated with lower limb manifestations. (A) Voxel-based comparison of DTI scans from inherited dystonia subjects with and without lower limb involvement (LEG vs. NLEG, see Materials and Methods). A significant region with altered microstructural integrity (red) was identified within the prespecified penetrance-related testing space (blue), subjacent to the motor cortical leg area (yellow). [The color stripe represents voxels thresholded at T = 2.7, P = 0.01]. (B) Left: Box-and-whisker plot showing FA values for this cluster measured in inherited (LEG and NLEG) and sporadic (NLEG) dystonia (gray), and in healthy control subjects (white). FA was reduced in both NLEG groups relative to the LEG and the control subjects (P < 0.05, post-hoc tests). Right: FA values for this cluster were also measured in reference scans acquired in nonmanifesting (NM) dystonia mutation carriers (gray) and in a separate healthy control cohort (white) (see Materials and Methods). The FA reductions observed in sporadic and inherited NLEG subjects were comparable to corresponding values measured in asymptomatic gene carriers. FA values measured in this cluster in LEG dystonia subjects were in the normal range. [In each cohort, FA values were standardized (z-scored) with respect to measurements from the corresponding healthy control group].
In the present study, voxel-wise FA group contrasts were considered significant at P = 0.001 at peak voxel, corrected for multiple comparisons at P < 0.05. Within the predefined penetrance-related space, we also reported between-group differences in FA exceeding the hypothesis-testing threshold of P = 0.005, uncorrected at peak voxel. The individual FA values from each cluster were evaluated with reference to corresponding measurements from healthy subjects (n = 8) scanned contemporaneously with the current dystonia cohort on the same MRI platform. These measurements were additionally compared with FA values from the same regions computed in DTI scans acquired previously on a different imaging platform in nonmanifesting gene carriers (n = 7) and in an independent group (n = 8) of healthy control subjects (Argyelan et al. 2009). Regional FA values from each group were displayed using box-and-whisker plots. The individual subject data were inspected for outliers and overlapping values between the relevant groups. Group differences were evaluated using one-way analysis of variance (ANOVA) and post-hoc Bonferroni tests. The results were considered significant for P < 0.05.
Clinical Correlations
The relationship between symptom severity and individual FA values was assessed in the arm-related cluster identified in the LARM versus NLARM voxel-wise contrast. The coordinates of this cluster (Fig. 2A, red) were reflected onto the opposite (left) hemisphere as a “mirror cluster” ([−37, −26, 38]) in contralateral subrolandic white matter. Functional MRI during finger tapping demonstrated that the reflected white matter cluster adjoined the motor cortical representation of the right arm (Fig. 3A, yellow). FA values from this cluster were correlated with right-arm BFMDRS motor ratings obtained during imaging and by computing the Pearson product–moment correlation coefficient. Correlations were considered significant for P < 0.05. Lastly, we conducted a within-subject analysis of hemispheric FA data from the 11 dystonia subjects with clinical involvement limited to the dominant right upper limb. In these individuals, FA was measured in the arm-related subrolandic cluster of each hemisphere. The resulting side-to-side differences were compared with corresponding measurements from healthy control subjects using repeated-measures ANOVA (RMANOVA) with appropriate post-hoc tests. Findings were considered significant for P < 0.05.
Figure 2.
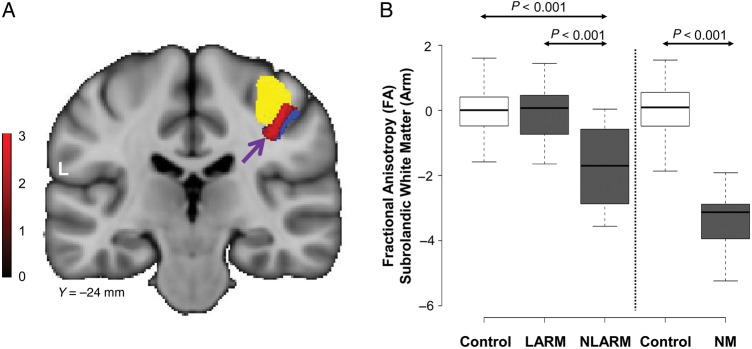
Microstructural changes associated with upper limb manifestations. (A) Voxel-based comparison of DTI scans from subjects with and without left arm involvement (LARM vs. NLARM, see Materials and Methods). A significant area of abnormal microstructure (red) was identified within the penetrance-related space (blue), subjacent to the motor cortical representation of the left arm (yellow). [The color stripe represents voxels thresholded at T = 2.5, P < 0.01]. (B) Left: Box-and-whisker plot showing FA values in this cluster measured in the LARM and NLARM dystonia subjects (gray) and in healthy volunteers (white). Significant regional FA reductions were evident in the NLARM dystonia subjects relative to their LARM counterparts and the healthy volunteer subjects (P < 0.001, post-hoc tests). Right: FA values in this cluster were also computed in scans from the reference cohort (see Materials and Methods). FA reductions in the NLARM subjects were similar to corresponding measurements obtained in nonmanifesting (NM) gene carriers (gray). FA values in this region were normal in the LARM subjects. [In each cohort, FA values were standardized (z-scored) with respect to measurements from the corresponding healthy control group].
Figure 3.
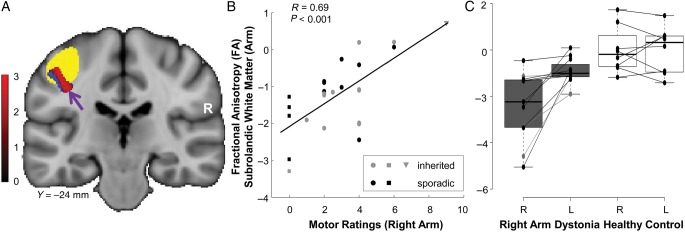
Clinical correlations with subrolandic microstructure. (A) The right hemispheric arm-related cluster in Figure 2A was transposed and positioned as a “mirror” volume (red) on the opposite side (see Materials and Methods). The penetrance-related testing space (blue) was also transposed to the left hemisphere. Functional MRI activation studies conducted during right-hand finger tapping revealed that this mirror volume was adjacent to the motor cortical representation of the ipsilateral arm (yellow). (B) FA values measured in the left “mirror” region correlated (r = 0.69, P < 0.001, Pearson's correlation) with right arm dystonia severity ratings. (Inherited dystonia subjects are represented by gray symbols; sporadic dystonia by black symbols.) Higher (more intact) FA in this region was associated with more severe clinical involvement of the contralateral upper extremity. This relationship was not altered by excluding the five subjects (squares) with no right arm manifestations (r = 0.60, P < 0.003) or the most clinically affected subject (triangle) (r = 0.60, P < 0.001). (C) Box-and-whisker plot showing hemispheric FA values measured in the subrolandic arm region of dystonia subjects with unilateral right arm symptoms (gray). In these individuals, FA was lower on the right brain side, opposite the asymptomatic (left) upper limbs (P < 0.001, post-hoc test). Analogous side-to-side differences were not present in the healthy control group (white) (P > 0.9). [Each line connects z-scored hemispheric FA values from an individual subject].
Tractography
Tractography was performed to identify the projection pathways associated with significant group differences on voxel-wise FA contrasts. Functional MRI was used to specify discrete thalamic and motor cortical activation clusters (Table 1) which served as way and terminal regions for tract reconstruction. For foot tapping, we used the fMRI data to define one medial region encompassing the sensorimotor cortical leg representation of the two hemispheres. For finger tapping, this approach was used to define the sensorimotor cortical hand representation of each hemisphere, and activation areas in the putamen and thalamus of each hemisphere. Tracts connecting volumes-of-interest corresponding to the motor cortical, ventral thalamic, and putamen activation clusters identified by fMRI and the FA cluster from the comparison of the LEG and NLEG DTI scans were reconstructed using TrackVis software (http://www.trackvis.org/). For reference, we also used this method to reconstruct corticospinal projections from volumes-of-interest connecting the cortical fMRI activation cluster with an anatomical region placed on the posterior limb of the internal capsule in MNI space.
Table 1.
Limb-related activation clusters
| Coordinatesa |
Cluster sizeb | Zmax | P-valuec | |||||
|---|---|---|---|---|---|---|---|---|
| Region |
x | y | z | |||||
| Sensorimotor cortex | Legd | (midline) | −2 | −34 | 68 | 5485 | 6.00 | 0.0001 |
| Arme | (R) | 47 | −19 | 55 | 6631 | 7.60 | 0.0001 | |
| (L) | −39 | −28 | 48 | 4639 | 6.79 | 0.0001 | ||
| Thalamus | Ventrale | (R) | 17 | −18 | 4 | 586 | 5.03 | 0.0001 |
| (L) | −17 | −21 | 4 | 1080 | 5.17 | 0.0001 | ||
| Basal ganglia | Putamene | (R) | 27 | −5 | 1 | 412 | 4.04 | 0.0001 |
| (L) | −29 | −7 | 2 | 730 | 4.67 | 0.0001 | ||
aMontreal Neurological Institute (MNI) space.
bContiguous voxels (1 voxel = 1 mm3).
cAt peak voxel corrected for multiple comparisons at P < 0.05 (FWE).
dIdentified by fMRI in foot tapping task.
eIdentified by fMRI in finger tapping task.
The fMRI activation clusters for tract reconstruction were determined using the FMRIB software (http://www.fmrib.ox.ac.uk/fsl/). The analysis steps included: brain extraction, motion correction, slice-timing correction, spatial smoothing, high-pass temporal filtering, and global intensity normalization of the entire 4D dataset. In first-level analysis, the parametric t-maps were reconstructed for each individual. To obtain the average group t-maps, the results of the first-level analysis were combined in the second-level analysis using mixed effects linear model. Before performing the second-level analysis, average functional data were registered to native space T1-weighted images and then T1-weighted images were registered to the MNI template using a 12-parameter affine transformation (Jenkinson et al. 2002). The parametric maps were then registered to the MNI template by applying the 12-parameter affine transformation obtained from registering average functional data to MNI. Group activation maps were thresholded at the voxel level at Z = 3.5, P < 0.001, uncorrected. Regions were considered significant for P < 0.05, corrected for family-wise error (FWE).
Diffusion-weighted images from each group were registered using the early registration method (Vo et al. 2013); the gradient vectors were reoriented for tensor calculation. Tracking parameters were identical for all groups. Tract reconstructions were displayed for each group and compared quantitatively based on the visualized tract count. Group differences in the tract count were determined; the standard error was estimated using the leave-one-out jackknife method (Efron and Tibshirani 1998). Fiber counts were obtained for the reconstructed thalamocortical, corticostriatal, and corticospinal tracts from each group by leaving out one subject at a time from the group set. Group differences in fiber counts were also separately evaluated for each tract using ANOVA with post-hoc Bonferroni tests. The statistical tests were performed using SPSS software (SPSS Inc., Chicago, IL) and were considered significant for P < 0.05.
Results
Microstructural Changes Related to Somatotopy
To identify microstructural changes associated with lower limb manifestations, we compared DTI scans from dystonia subjects with and without leg involvement (LEG and NLEG) on a voxel-by-voxel basis. Because leg involvement rarely occurs in sporadic forms of dystonia (O'Riordan et al. 2004), the LEG/NLEG contrast was studied in scan data from the inherited subjects. A significant white matter region ([24, −19, 51]; Zmax 2.78, cluster size 117 voxels, Puncorr < 0.003) was detected within the hypothesis-testing space (Fig. 1A, blue). This cluster (Fig. 1A, red) was located in close proximity to the overlying somatosensory leg area (yellow) identified concurrently in the same subjects with fMRI during foot tapping (Table 1). FA (a measure of fiber integrity) in this region (Fig. 1B, gray) was reduced in the NLEG relative to the LEG subjects (P < 0.024, post-hoc Bonferroni test). Indeed, FA values were similar for inherited and sporadic NLEG subjects (P > 0.9, post-hoc Bonferroni test). Abnormal reductions were present in both dystonia groups (inherited: P < 0.024; sporadic: P < 0.001) within the range of values computed for nonmanifesting gene carriers (Fig. 1B, gray). LEG subjects, in contrast, exhibited consistently normal FA in this region.
An analogous approach was used to identify regions with microstructural changes associated with upper limb manifestations. The comparison of scans from affected subjects with and without arm dystonia was complicated by the fact that in dystonia (Inzelberg et al. 1993), nearly all of the subjects had some degree of right upper extremity involvement (see Supplementary Table 1). Nonetheless, half (11/22 = 50%) of the arm dystonia subjects had left-sided symptoms while the others did not (see Materials and Methods). Thus, we sought to identify upper limb-related microstructural changes in this cohort by comparing scans from dystonia subjects with and without left-arm symptoms (LARM and NLARM) within the hypothesis-testing volume (Fig. 2A, blue; see Supplementary Table 2). A significant group difference (Fig. 2A, red) was detected in right hemisphere subrolandic white matter ([37, −26, 38]; Zmax 2.56, cluster size 66 voxels, Puncorr < 0.005) subjacent to the motor cortical representation of the left hand (yellow), which was identified by fMRI in the same subjects during finger tapping (see Table 1). In this region, FA values (Fig. 2B, gray) were reduced in NLARM subjects relative to their LARM counterparts (P < 0.001, post-hoc Bonferroni test). As above, the low FA values seen in this region in NLARM subjects were consistently subnormal, falling within the measured range for nonmanifesting gene carriers (Fig. 2B, gray). In contrast, in LARM subjects, FA values in this region fell consistently within the normal range (Fig. 2B, white).
Clinical Correlates of Pathway Microstructure
We next examined the relationship between the observed microstructural changes and the severity of clinical manifestations in these subjects. To do this, we transposed the upper limb-related cluster described above and positioned it as a “mirror” volume (Fig. 3A, red) in the contralateral (left) hemisphere. Analysis of the fMRI scans acquired during right-hand finger tapping demonstrated the proximity of the mirror cluster ([−37, −26, 38]) to the motor cortical representation of the right hand (Fig. 3A, yellow). FA values for this region (Fig. 3B) correlated with independent right arm dystonia severity ratings (r = 0.69, P < 0.001; Pearson's correlation) such that more severe clinical manifestations were associated with relative preservation of tract integrity in this region.
The clinical relevance of the subrolandic FA measurements in dystonia was further demonstrated in an analysis of the DTI data from the subset of dystonia subjects with symptoms restricted to the dominant right arm (see Materials and Methods). In these individuals, FA values measured in the upper limb-related subrolandic areas were more asymmetrical than in healthy control subjects (group × side interaction: F1,17 = 7.24, P < 0.015; RMANOVA). In the dystonia subjects (Fig. 3C, gray), arm-related FA was lower (P < 0.001, post-hoc test) on the “uninvolved” cerebral hemisphere (opposite the asymptomatic upper limb) relative to its “involved” counterpart (opposite the clinically affected upper limb). In contrast, in healthy subjects (Fig. 3C, white), side-to-side FA differences in this region were not significant (P > 0.9). Indeed, in accord with the preceding findings, FA values measured in the arm-related region of the “involved” hemispheres were in the normal range, but were consistently reduced on the “uninvolved” side.
Localization of Tract Changes
Tractographic reconstructions were performed to relate the observed microstructural abnormalities to specific neuroanatomical projection pathways. This was accomplished by using the subrolandic cluster identified in the leg-related FA contrast (Fig. 4, red) as the starting region, and the associated thalamic (blue) and motor cortical (yellow) clusters as termination regions (see Materials and Methods). The resulting thalamocortical tract reconstructions demonstrated bilateral reductions in leg-related fiber numbers (Table 2) in both inherited and sporadic NLEG subjects, and relatively preserved fiber numbers in the LEG group [inherited NLEG: 355 (−75%); sporadic NLEG: 256 (−82%); LEG: 1197 (−14%); control: 1394 (100%), P < 0.001; one-way ANOVA]. Analogous group differences were not observed for corticostriatal and corticospinal tract reconstructions from these subjects (P > 0.1, one-way ANOVA).
Figure 4.

Thalamocortical tract differences related to phenotype. Display of reconstructed thalamocortical fiber tracts from patients with inherited (LEG and NLEG) and sporadic (NLEG) dystonia and from healthy volunteer subjects. Projection pathways were reconstructed using the subrolandic lower limb-related FA cluster (red) as the seed region and the corresponding motor cortical (yellow) and ventral thalamic (blue) fMRI activation clusters as the target regions (see Materials and Methods). Thalamocortical fiber numbers were preserved in the LEG dystonia subjects (−14%, relative to the healthy control group), but were reduced in both inherited and sporadic NLEG dystonia patients (−75% and −82%, respectively). [The fiber number for each group is presented to the right of the reconstructed fiber tract].
Table 2.
Fiber numbers of reconstructed tracts
| Thalamocortical | Corticostriatal | Corticospinal | |
|---|---|---|---|
| Leg (inherited) | 1197 ± 104 (−14%) | 325 ± 14 (+8%) | 1332 ± 37 (−11%) |
| Nonleg (inherited) | 355 ± 119 (−75%)* | 310 ± 10 (+3%) | 1498 ± 90 (+0.5%) |
| Nonleg (sporadic) | 256 ± 29 (−82%)* | 306 ± 7 (+2%) | 1433 ± 37 (−4%) |
| Healthy control | 1394 ± 101 | 300 ± 6 | 1491 ± 68 |
*P < 0.001, post-hoc test (see text).
Because of methodological limitations, analogous reconstructions of upper limb-related fiber tracts were not performed (see Materials and Methods). Nonetheless, in accord with the absence of leg symptoms in the unilateral arm dystonia subjects (Supplementary Table 1), bilateral reductions in leg-related thalamocortical fiber numbers (Supplementary Fig. 1) were evident in these individuals [“involved” (left) hemisphere: 417 (−67%), control 1260 (100%); “uninvolved” (right) hemisphere: 525 (−62%), control 1349 (100%), P < 0.001, one-way ANOVA].
Genotypic Versus Phenotypic Changes in Pathway Microstructure
Finally, we determined whether members of the current dystonia cohort additionally exhibited microstructural changes involving the proximal CbTC pathway segment. To this end, we first determined whether reductions in cerebellothalamic tract integrity were present in the inherited dystonia subjects. Indeed, an area with significantly reduced FA was discerned in paravermian deep cerebellar white matter. This cluster (Fig. 5A, red) was in close proximity to the genotypic white matter abnormality (yellow) described in the original DTI cohort. Cerebellothalamic pathway reconstructions were performed for each group (Fig. 5B) using the current cerebellar white matter cluster (red) as the starting region and the thalamic fMRI activation cluster (blue) as the terminating region. Cerebellothalamic fiber numbers were reduced in the inherited dystonia group [dystonia: 877 (−57%); control: 2062 (100%)]. In accordance with the tandem lesion model, measurements of mean microstructrual integrity for the entire distal penetrance-related white matter volume were normal (Fig. 5A, right) in the new cohort of clinically manifesting gene carriers. Indeed, without exception, these individuals exhibited greater FA in this region compared with the proximal segment of the pathway (P < 0.0001, paired Student's t-test). We note that as a group, the sporadic dystonia subjects exhibited a 70% reduction in cerebellothalamic fiber numbers (Fig. 5B, bottom right). However, at the individual case level, these changes were found to be more variable than in their inherited counterparts. Thus, cerebellar FA reductions greater than 1 standard deviation (SD) below the normal mean were evident in 11/13 (85%) of inherited subjects, but only in 8/12 (67%) of sporadic cases.
Figure 5.

Cerebellothalamic pathway involvement in dystonia. (A) Left: comparison of the DTI scans from inherited dystonia subjects and healthy volunteers revealed a significant cluster in which FA was reduced in the disease group (Supplementary Table 2). This region (red) was located in paravermian cerebellar white matter, in proximity to the cluster (yellow) identified independently in a previous study of dystonia gene carriers and control subjects (see Materials and Methods). Right: FA values (Supplementary Table 2) measured in prespecified cerebellar (CER) and subrolandic white matter (SWM) volumes, located, respectively, along the proximal and distal motor cerebellothalamocortical (CbTC) pathway segments. CER FA was abnormally low in the current group of inherited dystonia patients (P < 0.0001, Student's t-test) with reductions of 1 SD or more below the normal mean in 11/13 (85%) of these subjects. SWM FA, in contrast, was normal in this group. At the individual subject level, FA values for affected gene carriers (horizontal lines) were consistently higher (more intact) in the distal relative to the proximal CbTC pathway segments (P < 0.0001, paired Student's t-test). [Individual subject FA values for each region were z-transformed with respect to corresponding healthy control values]. (B) Display of reconstructed cerebellothalamic fiber tracts from healthy volunteers and from inherited (LEG and NLEG) and sporadic (NLEG) dystonia subjects. Projection pathways were reconstructed using the cerebellar white matter (red) and ventral thalamic activation (blue) clusters described above (see Materials and Methods). On average, cerebellothalamic fiber numbers were reduced by 61% in the inherited dystonia group, with nearly identical changes (−61%) for LEG and NLEG subjects. A mean reduction of 70% was noted for the sporadic subjects (see Results). [The fiber number for each group is presented to the right of the reconstructed tract].
Discussion
In this study, we extended the tandem lesion penetrance model (Argyelan et al. 2009; Ulug et al. 2011) to explain the phenotypic variation that characterizes inherited or idiopathic dystonia. Based on this formulation (Fig. 6), we posited that the distribution of clinical manifestations in affected individuals is determined by somatotopically specific changes in the distal segment of the CbTC motor pathway. We found that subrolandic thalamocortical projections to the primary arm area were intact in subjects with upper limb symptoms. In contrast, the integrity of leg-related thalamocortical fiber tracts was abnormally reduced in these “nonleg” (NLEG) subjects, as well as in completely nonpenetrant mutation carriers. Analogously, leg-related thalamocortical projections were intact in subjects with lower limb symptoms, although the integrity of arm-related pathways was substantially reduced in these individuals. Given that more severe limb symptoms were associated with relative preservation of the somatotopically relevant fiber tracts, these projection pathways may represent a novel therapeutic target for this disorder.
Figure 6.

Somatotopic changes underlying phenotypic variation in dystonia. (A) Model of phenotypic variation in dystonia determined by somatotopic differences in the distal segment of the cerebellothalamocortical (CbTC) motor pathway. Based on the “tandem lesion” penetrance model (Argyelan et al. 2009; Ulug et al. 2011), we proposed that proximal cerebellothalamic tract abnormalities (black ovals) are present in dystonia gene carriers irrespective of penetrance or clinical phenotype. Additional tract projections (gray ovals) in regions corresponding to the distal thalamocortical pathway segment regulate gene penetrance and determine whether leg (left) or arm (right) manifestations are present in a given individual. (B) CbTC fiber tracts in the healthy control group reconstructed using the subrolandic white matter clusters identified in the phenotype-related FA contrast (A, gray ovals) in conjunction with the corresponding leg/arm motor cortical (yellow (left)/green (right)) and thalamic (blue) fMRI activation clusters (see Materials and Methods). (C) Compared with the healthy control group (B), thalamocortical lower limb fiber tracts were preserved in dystonia subjects with leg symptoms (LEG, left). In contrast, tract integrity was abnormally reduced in affected subjects without leg involvement (NLEG, right) and in clinically unaffected (nonmanifesting) mutation carriers (see text). (D) The situation was similar in subjects with arm dystonia (ARM, left). In these individuals thalamocortical upper limb fiber tracts were preserved, but were abnormally reduced in their counterparts without arm dystonia (NARM, right), and in nonmanifesting gene carriers (see text). In contrast to the somatotopic differences seen in the distal CbTC pathway in relation to phenotype, cerebellothalamic tract integrity was consistently reduced in gene carriers, irrespective of clinical phenotype (C and D, black ovals).
The association of limb symptoms with somatotopic differences in the integrity of thalamocortical projection pathways was verified through individual tract reconstructions. In keeping with the FA data, lower limb-related thalamocortical tract counts were near normal in individuals with leg involvement, whereas substantial reductions were evident in those without this manifestation. Importantly, the analysis of the individual case reconstructions revealed the findings to be anatomically selective in that analogous group differences in corticostriatal and corticospinal tract counts were not present.
The potential clinical relevance of the findings is borne out in the study of upper limb-related white matter microstructure. In this study, subjects were selected for right motor dominance, and as previously reported (Inzelberg et al. 1993), limb dystonia is commonly lateralized to the dominant body side. The consistent involvement of right upper limb in our dystonia subjects is, therefore, not surprising. Nonetheless, the relatively random occurrence of limb symptoms on the nondominant side (50% vs. 50%) enabled the LARM vs. NLARM contrast to detect specific microstructural changes associated with upper limb dystonia. Nonetheless, hemispheric asymmetry in the sensorimotor region is relatively subtle (Zilles et al. 1996) and may not be discernible at the smoothing levels employed for voxel-wise analysis of the DTI images in this study. Thus, when transposed to the “mirror region” on the left, the subrolandic white matter cluster that was identified in the LARM versus NLARM FA contrast maintained its proximity to the ipsilateral cortical hand region. Of note, FA values measured in the transposed cluster exhibited a significant positive correlation with independent ratings of right-arm dystonia severity, associating more severe symptoms with higher (more intact) FA values. Similarly, the subjects with unilateral right-arm dystonia exhibited normal FA in the contralateral left hemisphere mirror cluster, while significant reductions were evident on the right hemisphere opposite the clinically normal left upper limb. Indeed, consistent with the absence of leg symptoms in these individuals (Supplementary Table 1), lower limb-related thalamocortical tract numbers were substantially reduced in this dystonia subgroup (Supplementary Fig. 1). In aggregate, the findings indicate that the distribution and clinical severity of limb manifestations in dystonia is associated with specific somatotopic changes in subrolandic white matter microstructure.
Other Findings
The somatotopic changes in white matter microstructure associated with limb symptoms were present in individuals with sporadic as well as inherited dystonia. Even so, the current data do not exclude the possibility that inherited and sporadic dystonia are distinguished by microstructural differences involving other brain regions. Indeed, such a difference may exist with regard to the proximal CbTC pathway segment. As in our previous study (Argyelan et al. 2009), the current set of DYT1 and DYT6 mutation carriers (Fig. 5B) exhibited consistent reductions in cerebellothalamic tract counts. Although group-level analysis disclosed analogous proximal segment changes in sporadic dystonia, the findings were less consistent when evaluated at the individual subject level. The possibility that other motor systems are involved in at least a portion of individuals with sporadic dystonia is borne out by reports of microstructural changes involving the putamen and in pallidothalamic outflow pathways in sporadic cervical dystonia (Fabbrini et al. 2008; Blood et al. 2012).
In accordance with the “tandem lesion” model, greater disability was associated with preserved connectivity in somatotopically relevant thalamocortical pathways. In general terms, therapeutic interventions, such as internal globus pallidus deep brain stimulation, function indirectly by modulating abnormal thalamocortical activity in patients with intractable generalized symptoms. In this context, deep brain stimulation and related stereotaxic approaches act by converting the systems-level changes seen in affected individuals into functional patterns more typical of nonmanifesting carriers (Argyelan et al. 2009). Indeed, in this vein, we have found that abnormal resting elevations in motor network activity are evident in patients with dystonia (Carbon et al. 2010; Crowell et al. 2012), and that these changes can be ameliorated by therapeutic internal globus pallidus stimulation (Ulug et al. 2011). The present data suggest that selective targeting of somatotopically relevant thalamocortical projections can also be therapeutically beneficial, especially in patients with refractory limb symptoms. In this regard, reversible stimulation approaches will likely be preferable to localized tract ablation. Moreover, to avoid unintentional contact with nearby corticospinal and corticostriatal projection pathways in the subrolandic region, it may be desirable to approach the relevant fiber tracts closer to their thalamic origin. Nonetheless, before this intervention can be considered further, validation of the current findings will be needed as well as tests of the procedure in an experimental model of the disorder.
This study was limited by several methodological issues. Because upper limb fibers cross in the superior longitudinal fasciculus, it was not always possible to reliably reconstruct the corresponding thalamocortical fiber tracts on a group basis. That said, the significant FA differences observed in the upper limb subjects suggest that similar somatotopic relationships apply in the corresponding projection pathways. It has recently been shown that FA measurements in subrolandic white matter can be influenced by limb immobilization (Langer et al. 2012). In this vein, one may consider the related notion that changes in white matter FA can similarly result from sustained involuntary limb movements. Even so, FA values measured in the most severely affected subjects in the current cohort, as well as the manifesting gene carriers reported in our earlier study (Argyelan et al. 2009), were consistently normal, rather than elevated. DTI measurements conducted before and after chemodenervation for limb symptoms may shed light on this question.
Supplementary Material
Supplementary material can be found at: http://www.cercor.oxfordjournals.org/.
Funding
This work was supported by the National Institute of Neurological Disorders and Stroke (R01 NS072514 to D.E.). The content is solely the responsibility of the authors and does not necessarily represent the official views of the National Institute of Neurological Disorders and Stroke or the National Institutes of Health. The sponsor did not play a role in study design, collection, analysis and interpretation of data, writing of the report, or in the decision to submit the paper for publication.
Supplementary Material
Notes
The authors wish to thank Dr Steven J. Frucht (Mount Sinai Medical Center, New York, NY) and Dr Seth Pullman (Columbia Presbyterian Medical Center, New York, NY) for assistance with patient recruitment. Conflict of Interest: D.E. has served as a scientific advisory board member and has received honoraria from The Bachmann-Strauss Dystonia and Parkinson Foundation. He is listed as coinventor of patents re: Markers for use in screening patients for nervous system dysfunction and a method and apparatus for using same, without financial gain. He has received research support from the NIH (NINDS) and The Bachmann-Strauss Dystonia and Parkinson Foundation. All other authors declare no competing financial interests.
References
- Albanese A, Asmus F, Bhatia KP, Elia AE, Elibol B, Filippini G, Gasser T, Krauss JK, Nardocci N, Newton A, et al. 2011. EFNS guidelines on diagnosis and treatment of primary dystonias. Eur J Neurol. 18:5–18. [DOI] [PubMed] [Google Scholar]
- Albanese A, Bhatia K, Bressman SB, Delong MR, Fahn S, Fung VS, Hallett M, Jankovic J, Jinnah HA, Klein C, et al. 2013. Phenomenology and classification of dystonia: a consensus update. Mov Disord. 28:863–873. [DOI] [PMC free article] [PubMed] [Google Scholar]
- Argyelan M, Carbon M, Niethammer M, Ulug AM, Voss HU, Bressman SB, Dhawan V, Eidelberg D. 2009. Cerebellothalamocortical connectivity regulates penetrance in dystonia. J Neurosci. 29:9740–9747. [DOI] [PMC free article] [PubMed] [Google Scholar]
- Aumann TD. 2002. Cerebello-thalamic synapses and motor adaptation. Cerebellum. 1:69–77. [DOI] [PubMed] [Google Scholar]
- Blood AJ, Kuster JK, Woodman SC, Kirlic N, Makhlouf ML, Multhaupt-Buell TJ, Makris N, Parent M, Sudarsky LR, Sjalander G, et al. 2012. Evidence for altered basal ganglia-brainstem connections in cervical dystonia. PLoS One. 7:e31654. [DOI] [PMC free article] [PubMed] [Google Scholar]
- Breakefield XO, Blood AJ, Li Y, Hallett M, Hanson PI, Standaert DG. 2008. The pathophysiological basis of dystonias. Nat Rev Neurosci. 9:222–234. [DOI] [PubMed] [Google Scholar]
- Burke RE, Fahn S, Marsden CD, Bressman SB, Moskowitz C, Friedman J. 1985. Validity and reliability of a rating scale for the primary torsion dystonias. Neurology. 35:73–77. [DOI] [PubMed] [Google Scholar]
- Carbon M, Argyelan M, Ghilardi MF, Mattis P, Dhawan V, Bressman S, Eidelberg D. 2011. Impaired sequence learning in dystonia mutation carriers: a genotypic effect. Brain. 134:1416–1427. [DOI] [PMC free article] [PubMed] [Google Scholar]
- Carbon M, Argyelan M, Habeck C, Ghilardi MF, Fitzpatrick T, Dhawan V, Pourfar M, Bressman SB, Eidelberg D. 2010. Increased sensorimotor network activity in DYT1 dystonia: a functional imaging study. Brain. 133:690–700. [DOI] [PMC free article] [PubMed] [Google Scholar]
- Carbon M, Eidelberg D. 2009. Abnormal structure-function relationships in hereditary dystonia. Neuroscience. 164:220–229. [DOI] [PMC free article] [PubMed] [Google Scholar]
- Carbon M, Ghilardi MF, Argyelan M, Dhawan V, Bressman SB, Eidelberg D. 2008. Increased cerebellar activation during sequence learning in DYT1 carriers: an equiperformance study. Brain. 131:146–154. [DOI] [PMC free article] [PubMed] [Google Scholar]
- Crowell AL, Ryapolova-Webb ES, Ostrem JL, Galifianakis NB, Shimamoto S, Lim DA, Starr PA. 2012. Oscillations in sensorimotor cortex in movement disorders: an electrocorticography study. Brain. 135:615–630. [DOI] [PMC free article] [PubMed] [Google Scholar]
- Daskalakis ZJ, Paradiso GO, Christensen BK, Fitzgerald PB, Gunraj C, Chen R. 2004. Exploring the connectivity between the cerebellum and motor cortex in humans. J Physiol. 557:689–700. [DOI] [PMC free article] [PubMed] [Google Scholar]
- Efron B, Tibshirani R. 1998. An introduction to the Bootstrap. New York: CRC Press, LLC. [Google Scholar]
- Fabbrini G, Pantano P, Totaro P, Calistri V, Colosimo C, Carmellini M, Defazio G, Berardelli A. 2008. Diffusion tensor imaging in patients with primary cervical dystonia and in patients with blepharospasm. Eur J Neurol. 15:185–189. [DOI] [PubMed] [Google Scholar]
- Fahn S, Bressman SB, Marsden CD. 1998. Classification of dystonia. Adv Neurol. 78:1–10. [PubMed] [Google Scholar]
- Fuchs T, Gavarini S, Saunders-Pullman R, Raymond D, Ehrlich ME, Bressman SB, Ozelius LJ. 2009. Mutations in the THAP1 gene are responsible for DYT6 primary torsion dystonia. Nat Genet. 41:286–288. [DOI] [PubMed] [Google Scholar]
- Inzelberg R, Zilber N, Kahana E, Korczyn AD. 1993. Laterality of onset in idiopathic torsion dystonia. Mov Disord. 8:327–330. [DOI] [PubMed] [Google Scholar]
- Jenkinson M, Bannister P, Brady M, Smith S. 2002. Improved optimization for the robust and accurate linear registration and motion correction of brain images. Neuroimage. 17:825–841. [DOI] [PubMed] [Google Scholar]
- Langer N, Hanggi J, Muller NA, Simmen HP, Jancke L. 2012. Effects of limb immobilization on brain plasticity. Neurology. 78:182–188. [DOI] [PubMed] [Google Scholar]
- Niethammer M, Carbon M, Argyelan M, Eidelberg D. 2011. Hereditary dystonia as a neurodevelopmental circuit disorder: Evidence from neuroimaging. Neurobiol Dis. 42:202–209. [DOI] [PMC free article] [PubMed] [Google Scholar]
- O'Riordan S, Raymond D, Lynch T, Saunders-Pullman R, Bressman SB, Daly L, Hutchinson M. 2004. Age at onset as a factor in determining the phenotype of primary torsion dystonia. Neurology. 63:1423–1426. [DOI] [PubMed] [Google Scholar]
- Ozelius LJ, Hewett JW, Page CE, Bressman SB, Kramer PL, Shalish C, de Leon D, Brin MF, Raymond D, Corey DP, et al. 1997. The early-onset torsion dystonia gene (DYT1) encodes an ATP-binding protein. Nat Genet. 17:40–48. [DOI] [PubMed] [Google Scholar]
- Tanabe LM, Kim CE, Alagem N, Dauer WT. 2009. Primary dystonia: molecules and mechanisms. Nat Rev Neurol. 5:598–609. [DOI] [PMC free article] [PubMed] [Google Scholar]
- Ulug AM, Vo A, Argyelan M, Tanabe L, Schiffer WK, Dewey S, Dauer WT, Eidelberg D. 2011. Cerebellothalamocortical pathway abnormalities in torsinA DYT1 knock-in mice. Proc Natl Acad Sci USA. 108:6638–6643. [DOI] [PMC free article] [PubMed] [Google Scholar]
- Vo A, Argyelan M, Eidelberg D, Ulug AM. 2013. Early registration of diffusion tensor images for group tractography of dystonia patients. J Magn Reson Imaging. 37:67–75. [DOI] [PMC free article] [PubMed] [Google Scholar]
- Zilles K, Dabringhaus A, Geyer S, Amunts K, Qu M, Schleicher A, Gilissen E, Schlaug G, Steinmetz H. 1996. Structural asymmetries in the human forebrain and the forebrain of non-human primates and rats. Neurosci Biobehav Rev. 20:593–605. [DOI] [PubMed] [Google Scholar]
Associated Data
This section collects any data citations, data availability statements, or supplementary materials included in this article.