

Abstract
OBJECTIVE
In the United States (US), national efforts to reduce hospital readmissions have been enacted, including the application of substantial insurance reimbursement penalties for hospitals with elevated rates. Readmissions after severe sepsis remain under-studied and could possibly signify lapses in care and missed opportunities for intervention. We sought to characterize 7- and 30-day readmission rates following hospital admission for severe sepsis as well as institutional variations in readmission.
DESIGN
Retrospective analysis of 345,657 severe sepsis discharges from University HealthSystem Consortium (UHC) hospitals in 2012.
SETTING
US
PATIENTS
We applied the commonly cited method described by Angus, et al. for identification of severe sepsis, including only discharges with sepsis present on admission.
MEASUREMENTS AND MAIN RESULTS
We identified unplanned, all-cause readmissions within 7- and 30-days of discharge using claims-based algorithms. Using mixed effects logistic regression, we determined factors associated with 30-day readmission. We used risk-standardized readmission rates (RSRRs) to assess institutional variations. Among 216,328 eligible severe sepsis discharges, there were 14,932 readmissions within 7 days (6.9%; 95% CI 6.8–7.0) and 43,092 within 30 days (19.9%; 95% CI 19.8–20.1). Among those readmitted within 30 days, 66.9% had an infection and 40.3% had severe sepsis on readmission. Patient severity, length of stay, and specific diagnoses were associated with increased odds of 30-day readmission. Observed institutional 7-day readmission rates ranged from 0–12.3%, 30-day rates from 3.6–29.1%, and 30-day RSRRs from 14.1–31.1%. Greater institutional volume, teaching status, trauma services, location in the Northeast and lower ICU rates were associated with poor RSRR performance.
CONCLUSIONS
Severe sepsis readmission places a substantial burden on the healthcare system, with one-in-fifteen and one-in-five severe sepsis discharges readmitted within 7 and 30 days, respectively. Hospitals and clinicians should be aware of this important sequela of severe sepsis.
Keywords: Sepsis, infection, healthcare utilization, outcomes
INTRODUCTION
Severe sepsis is the syndrome of microbial infection complicated by systemic inflammation and organ dysfunction.(1) Severe sepsis is a major United States (US) problem, accounting for over 750,000 hospital admissions, 570,000 Emergency Department visits and 200,000 deaths annually.(1–4) Effective sepsis care is complex, encompassing early recognition and aggressive treatment with intravenous fluids, antibiotics and vasopressors, among other therapies. There is also growing awareness that severe sepsis encompasses long-term sequelae. For example, initial severe sepsis survivors have higher risks of death and cognitive dysfunction, and exhibit a greater use of health care resources after hospital discharge.(4–7)
The US Patient Protection and Affordable Care Act (ACA) established the reduction of hospital readmissions as an important national goal.(8) Although readmissions are important from institutional financing and healthcare efficiency perspectives, these events also place an enormous burden on patients, leading to prolonged illness, distress, and lost productivity.(9) A growing body of literature describes hospital readmissions after initial treatment for severe sepsis.(6, 7, 10–12) Sepsis readmissions are important not only because of the potential financial implications, but also because these events may signify shortcomings in initial inpatient treatment or follow-up outpatient care. Studies of community medical centers and samples of tertiary care hospitals have identified increased short- and long-term readmission rates among patients discharged after treatment for sepsis.(6, 7, 10, 11) However, there are no national data describing hospital readmissions after severe sepsis. Furthermore, few studies have focused on very early severe sepsis readmissions (i.e. within 7 days of discharge) or identified the relationships between institutional factors and readmission performance.
The University HealthSystem Consortium (UHC) is a national alliance of 120 not-for-profit academic medical centers and 300 affiliated hospitals. In this study, we sought to characterize hospital readmissions associated with severe sepsis among hospitals participating in the UHC and hypothesized that discharge-level as well as institutional characteristics would be associated with readmission following sepsis.
MATERIALS AND METHODS
STUDY DESIGN
We analyzed hospital discharge data from the UHC clinical database (CDB) and conducted a retrospective cohort study. The study received approval from the Institutional Review Board of the University of Alabama at Birmingham.
DATA SOURCE
The UHC is a collaborative effort encompassing academic medical centers and affiliated hospitals in the US.(13) Representing 42 states, UHC aims to improve institutional clinical, operational and financial performance. For quality improvement purposes, UHC maintains the CDB, which contains administrative data submitted by hospitals in the consortium. This data source captures the elements of the standard UB-04 reporting form and encompasses data pertaining to patient demographics, discharge diagnoses, procedures and outcomes. We used UHC CDB data for reporting member institutions for the period January 1 through December 31, 2012 (213 hospitals), linking with survey data from the American Hospital Association in order to ascertain institutional characteristics.
CASE SELECTION
This analysis consisted of patients admitted with severe sepsis present on admission. We excluded patients <18 years old, prisoners or those discharged to law enforcement, and patients with unknown or other disposition (i.e. left against medical advice). We also excluded hospitalizations for rehabilitation, psychiatric, or cancer care using Agency for Healthcare Research and Quality Clinical Classifications Software (AHRQ CCS) codes, which represent a tool for clustering patient diagnoses and procedures into meaningful categories.(14) In defining a population at risk of readmission, we also excluded transfers from other facilities and index deaths. (Figure 1A) Transfers were excluded, as extraneous, unobservable factors related to care received at a prior hospital may impact readmission following discharge.
FIGURE 1. Exclusion criteria and case definition for unplanned severe sepsis readmission.
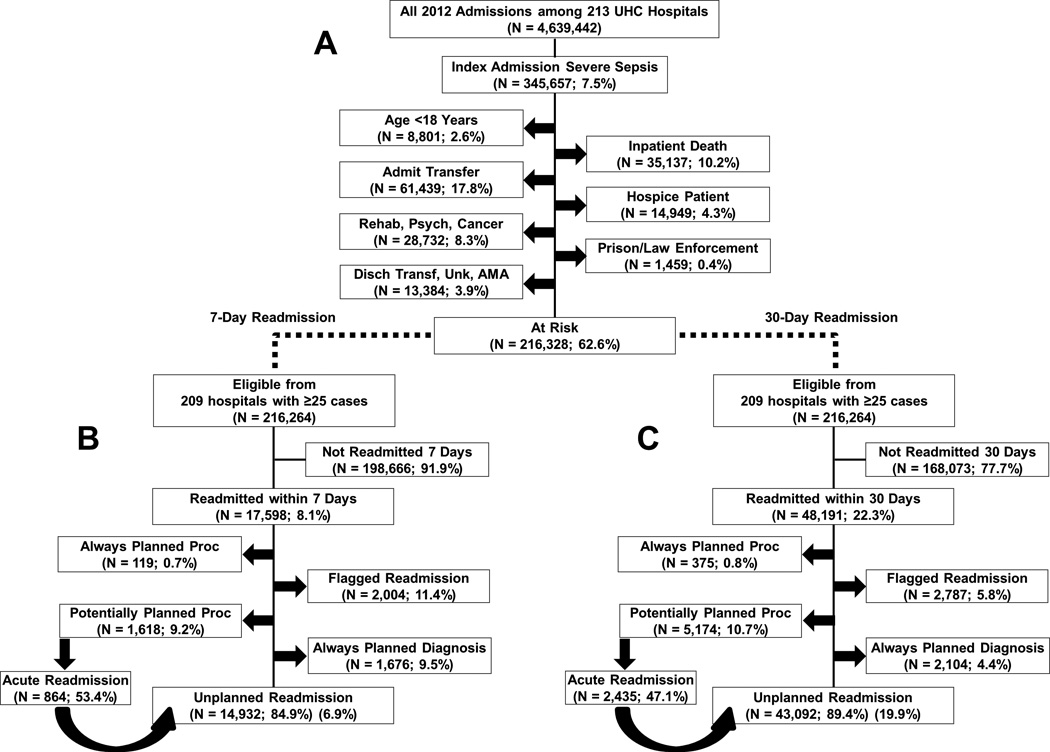
Percentages do not sum to 100% as cases could meet multiple criteria. Readmissions with potentially planned procedures were considered unplanned if the principal diagnosis CCS code was acute. A) exclusion criteria; B) unplanned 7-day readmission definition; C) unplanned 30-day readmission definition. “Flagged” readmissions were for scheduled chemotherapy, radiation therapy, or dialysis treatment; same-day transfer to psychiatric facility, oncology ward, or inpatient rehabilitation; alcohol and drug treatment admission; or cases for childbirth labor and delivery. N = 2,910 index visit related to psych/rehabilitation; N = 25,900 had presence of cancer CCS code; N = 10,251 discharged as a transfer; N = 2,839 discharged AMA; N = 294 discharge unknown. CCS = clinical classification software; AMA = against medical advice; UHC = University HealthSystem Consortium.
Using the widely applied system of Angus, et al., we defined severe sepsis as hospitalizations with discharge diagnoses for both infection and organ dysfunction.(1–3) As done in prior studies, we expanded the Angus definitions to also include the following ICD-9 organ dysfunction codes: 518.8 (respiratory failure), 786.03 (apnea), and 799.1 (respiratory arrest).(1–3) We also classified hospitalizations with the discharge codes 995.91 (sepsis) as infection and 995.92 (severe sepsis) as severe sepsis. For a discharge with the 995.91 code to be considered severe sepsis, a corresponding organ dysfunction code was required.
Prior studies identifying severe sepsis using the Angus, et al. criteria utilized all available hospital discharge diagnoses, precluding the ability to distinguish initial hospital presentation with severe sepsis from the later development of severe sepsis during the stay. We defined severe sepsis using only discharge diagnoses that were present upon hospital admission, which were determined by coders at each institution and indicated by “present-on-admission” flags in the UHC CDB. This strategy allowed us to focus upon patients initially presenting to the hospital with severe sepsis, an important distinction as severe sepsis developing later during the stay could arise through independent mechanisms that may vary by institution (e.g. surgical site infections) and may not be thoroughly identifiable in UHC data.
OUTCOMES
The primary outcomes were unplanned readmission within 7 and 30 days of discharge from the index admission. We assessed both 7- and 30-day readmission rates, as some experts question the link between an index admission and a subsequent hospitalization four weeks later.(15) Readmissions included only those returning to the same institution, as we were unable to capture readmissions from outside hospitals.
Some hospital admissions are “planned;” for example, individuals initially discharged after an unstable angina episode but brought back for scheduled percutaneous coronary intervention. To distinguish planned from unplanned readmissions, we followed algorithms proposed in the Centers for Medicare and Medicaid Services (CMS) hospital-wide readmission measure (HWR).(14) The HWR was developed in order to compare hospital performance in all-cause unplanned readmission for Medicare beneficiaries, and is slated for incorporation into reimbursement penalty calculations.
Following HWR protocols, using CCS codes, we excluded readmissions with an “always planned” procedure (i.e. transplant or delivery) or diagnosis (i.e. chemotherapy, delivery, or rehabilitation).(14) (eTable 1) Among “potentially planned” readmissions (i.e. coronary artery bypass graft), we classified a readmission as unplanned if the primary discharge diagnosis was acute or a complication of care. (eTable 2A and 2B) Using variables available in the data set, we also excluded readmissions for scheduled chemotherapy, radiation therapy, or dialysis treatment; same-day transfer to psychiatric facility, oncology ward, or inpatient rehabilitation; alcohol and drug treatment admission; or cases for childbirth labor and delivery that were not accounted for using CCS codes (“flagged” readmissions). We performed all analyses at the discharge level, not accounting for repeat visits by the same patient. This approach is consistent with the CMS HWR, and a readmitted sepsis case was allowed to serve as an index admission for subsequent readmission.(14)
We defined a readmission as related to the index admission if the diagnosis related group (DRG) for the readmission matched the index admission, the CCS principal diagnosis or procedure code for the readmission matched the index admission, or the principal readmission diagnosis was related to a complication (ICD-9 codes 996.00–999.9). With this definition of relatedness and a severe sepsis definition using diagnosis codes, a readmission could feasibly be related but not for severe sepsis and vice versa. (Figure 2) For example, a severe sepsis patient admitted with heart failure and pneumonia could be placed in a non-sepsis DRG with a non-infectious primary ICD-9 code. The subsequent readmission may or may not have the same DRG or primary code. If there was severe sepsis present on admission for both discharges, but these classifiers did not match, this readmission would not be considered related by our definition. However, both would be deemed severe sepsis discharges.
FIGURE 2. Relationship between index severe sepsis admissions and hospital readmissions.
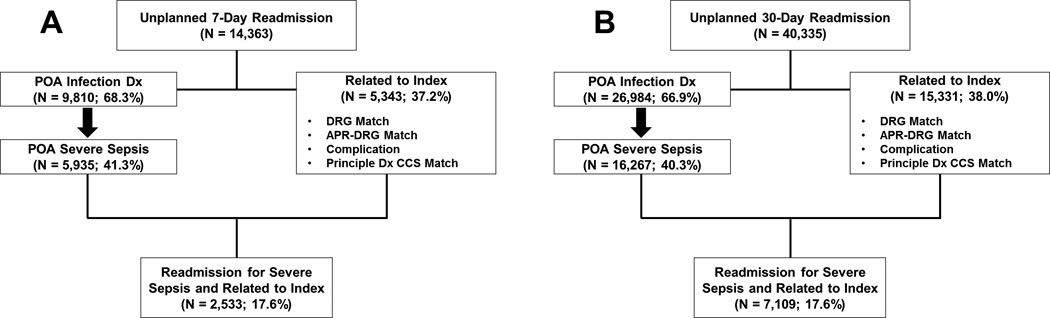
A) classification of 7-day readmissions; B) classification of 30-day readmissions. POA = present on admission; DRG = diagnosis-related group; APR-DRG = all patients refined diagnosis-related group; CCS = clinical classification software.
HOSPITALIZATION AND INSTITUTIONAL CHARACTERISTICS
We examined basic demographics including age, race, sex, and pay type. In addition, we determined length of stay (LOS), intensive care unit (ICU) admission, and comorbidities. We categorized LOS into short (≤2 days), medium (3–6), and long (≥7 days), in order to account for short-stay patients that may have different readmission risks from the rest of the severe sepsis population. We calculated a weighted Charlson score using secondary diagnosis codes. Risk-adjustment measures, including UHC predicted mortality and all-patients refined diagnosis-related group (APR-DRG) severity of illness (SOI) were also examined. In accordance with the proposed HWR, we also defined condition-specific indicators using CCS and diagnosis codes for the index hospitalization.(14) We determined ICU admission rates, mortality rates, and measures of severity for both index and readmissions. We also assessed institutional characteristics, including total severe sepsis volume, severe sepsis ICU utilization, and percentage of severe sepsis cases insured by Medicaid and aged 65 or older. Institutional control, region, population setting (large vs. small/medium metropolitan area) and services were obtained from American Hospital Association data.
STATISTICAL ANALYSIS
We calculated 7- and 30-day readmission rates among severe sepsis cases meeting inclusion criteria and reported these as percentages. We compared characteristics of the index discharge and the readmission, using tests which accounted for paired comparisons, including McNemar’s test of marginal homogeneity, Bowker’s test of symmetry, and the Wilcoxon signed rank test.
To determine factors associated with odds of unplanned readmission, we used multivariable mixed effects logistic regression. Due to the nested structure of the data, all models were fit using mixed effects logistic regression and incorporated hospital identifiers as random intercepts. The first model we fit included variables with plausible underlying conceptual frameworks, including age, sex, race, pay-type, severity of illness, Charlson score, ICU admission, index LOS, infection type and organ dysfunction.
In order to assess hospital variation, we fit an additional model and estimated Risk-Standardized Readmission Rates (RSRRs). As there is no established risk adjustment method for readmission after sepsis, we followed the methodology for model selection outlined in the HWR used for CMS hospital comparison.(14) (eTable 3) In order to obtain hospital-specific RSRRs, we fit a random intercept logistic regression model in Stata and output empirical Bayes estimates for each hospital, exponentiating to obtain measures in the form of “Observed-to-Expected” ratios. These ratios were then multiplied by the overall readmission rate. We assessed model collinearity by examining variance inflation factors, and accounted for institutional volume by allowing shrinkage based on estimate reliability and excluding hospitals with fewer than 25 severe sepsis cases. We reported RSRRs for 30-day readmission only as there is currently no validated method for calculating 7-day RSRRs. Institutional characteristics were compared between hospitals with RSRRs in the bottom and top two quintiles (good and poor performers, respectively), using non-parametric Wilcoxon rank-sum tests for continuous and Pearson Chi-Square tests for categorical measures. We used SAS 9.3 (Cary, North Carolina) and Stata 13.1 (College Station, Texas) for all analyses.
RESULTS
POPULATION CHARACTERISTICS
During 2012, there were 345,657 severe sepsis cases admitted to 213 hospitals contributing data to the UHC CDB (7.5% of all discharges), with a median of 1,538 per hospital (interquartile range (IQR) 755–2,232). After initial exclusion criteria were applied, there were 216,328 severe sepsis discharges eligible for readmission analysis. (Figure 1A) The most common reasons for exclusion included transfer from another facility (N=61,439; 17.7%), inpatient death (N=35,137; 10.2%), and a cancer diagnosis (N =25,900; 7.5%).
The population of eligible severe sepsis discharges was 65.6% white, 23.9% black, 50.9% female, 52.1% aged 65 years or older, and 64.9% insured by Medicare. The most common infection types were those classified as infectious or parasitic diseases, genitourinary infections, and those affecting the respiratory system. (Table 1) Among severe sepsis cases, organ dysfunction affecting the renal, respiratory, and cardiovascular systems were most common.
TABLE 1.
Infection and organ dysfunction types for severe sepsis patients
| N (Col %) | Unplanned 7-Day Readmission % (95% CI) |
Unplanned 30-Day Readmission % (95% CI) |
|
|---|---|---|---|
| All Eligible Discharges | 2,808,754 | 3.9 (3.9–3.9) | 10.8 (10.7–10.8) |
| Severe Sepsis (Infection + Organ Dysfunction or Coded SS) Present on Hospital Admission |
216,328 | 6.9 (6.8–7.0) | 19.9 (19.8–20.1) |
| ICD-9 Infection Category | |||
| Infectious and Parasitic Diseases | 104,012 (48.1) | 7.1 (7.0–7.3) | 20.4 (20.2–20.7) |
| Respiratory System | 72,992 (33.7) | 6.6 (6.4–6.7) | 19.1 (18.9–19.4) |
| Digestive System | 25,150 (11.6) | 9.8 (9.5–10.2) | 26.5 (25.9–27.0) |
| Genitourinary | 85,015 (39.3) | 6.6 (6.4–6.8) | 19.1 (18.8–19.3) |
| Skin and Subcutaneous Tissue | 22,656 (10.5) | 6.3 (6.0–6.7) | 18.8 (18.2–19.3) |
| Other | 28,689 (13.3) | 7.5 (7.2–7.8) | 22.1 (21.6–22.5) |
| ICD-9 Organ Dysfunction Category | |||
| Cardiovascular | 46,253 (21.4) | 7.2 (7.0–7.4) | 20.0 (19.7–20.4) |
| Hematological | 36,001 (16.6) | 7.6 (7.3–7.8) | 21.4 (21.0–21.9) |
| Neurologic | 24,180 (11.2) | 7.2 (6.9–7.5) | 19.3 (18.8–19.8) |
| Renal | 115,385 (53.3) | 7.1 (7.0–7.3) | 20.1 (19.9–20.4) |
| Respiratory | 52,201 (24.1) | 7.0 (6.8–7.3) | 20.5 (20.1–20.8) |
| Hepatic | 2,228 (1.0) | 8.6 (7.4–9.8) | 21.9 (20.2–23.6) |
| ICD-9 Coded Severe Sepsis | 32,879 (15.2) | 7.6 (7.3–7.8) | 20.4 (19.9–20.8) |
Legend: Column percentages relative to the total number of severe sepsis cases and may exceed 100% because select patients presented with multiple infections and/or organ dysfunctions. 95% confidence intervals estimated using the exact binomial method for all proportions. CI = confidence interval; SS = severe sepsis; ICD-9 = international classification of diseases, 9th revision.
After excluding discharges from four hospitals with <25 cases (N=64), among 216,262 discharges, 14,932 resulted in unplanned readmission within 7 days (6.9%; 95% CI 6.8–7.0), and 43,092 within 30 days (19.9%; 95% CI 19.8–20.1). (Figure 1B and 1C) These rates were substantially higher than observed readmission for non-sepsis discharges (7-day: 3.9%; 30-day: 10.8%). Readmission rates for infection and organ dysfunction types were fairly consistent, with only gastrointestinal infection patients exhibiting increased readmission. (Table 1)
INDEX VS. READMISSION CHARACTERISTICS
Among 14,932 7-day readmissions and 43,092 30-day readmissions, complete readmission information was available for 14,363 (96.2%) and 40,335 (93.6%), respectively. Of 7-day readmissions, 5,343 (37.2%) were related to the index hospitalization and 5,935 (41.3%) were for severe sepsis. (Figure 2A) For 30-day readmissions, the proportions were similar compared to 7-day, with 15,331 (38.0%) related to the index and 16,267 (40.3%) for severe sepsis. (Figure 2B) The majority of 7- and 30-day readmissions following severe sepsis had a diagnosis of infection (68.3% and 66.9%, respectively). (Figure 2A and 2B) Among 30-day readmissions, 6.2% resulted in inpatient death, which was lower than for index severe sepsis discharges not readmitted (16.8%). Compared with the index admission, readmissions also had lower direct cost, LOS, ICU admission, APR SOI, and risk of mortality, suggesting reduced patient severity. (Table 2)
TABLE 2.
Discharge characteristics of index hospitalization and unplanned readmission occurring within 30 days.
| All Non- Sepsis Discharges |
Non- Readmitted Sepsis Dischs. |
Readmitted Sepsis Discharges | |||
|---|---|---|---|---|---|
| Index | Readmission | p (Index vs. Readmit |
|||
| N = 2,582,679 | N = 173,172 | N = 40,335* | |||
| Total Direct Cost ($) (Median, IQR)** |
4,592 (2,646–9,321) |
6,516 (3,650–12,684) |
7,920 (4,397–15,234) |
5,849 (3,253–11,292) |
<0.001a |
| LOS (days) (Median, IQR)*** |
3 (2–5) |
5 (3–9) |
6 (4–10) |
5 (3–8) |
<0.001a |
| Admitted to ICU (at any time during hospitalization) (%) |
13.3 | 29.4 | 31.8 | 23.7 | <0.001b |
| APR-DRG SOI (%)**** | <0.001c | ||||
| Minor | 27.9 | 0.4 | 0.2 | 1.9 | |
| Moderate | 40.0 | 6.4 | 3.4 | 13.9 | |
| Major | 27.1 | 52.5 | 46.3 | 48.9 | |
| Extreme | 5.0 | 40.7 | 50.1 | 35.3 | |
| UHC Predicted Mortality (%)**** | <0.001c | ||||
| Q 1 | 26.0 | 1.6 | 0.7 | 1.8 | |
| Q 2 | 28.6 | 9.3 | 6.7 | 11.7 | |
| Q 3 | 26.6 | 21.3 | 20.4 | 26.5 | |
| Q 4 | 18.8 | 67.9 | 72.2 | 59.9 | |
Legend:
paired Wilcoxon signed-rank test;
McNemar’s test of marginal homogeneity;
Bowker’s test of symmetry.
Readmission information unavailable for 2,757;
2,033 missing;
498 missing;
7 missing.
UHC predicted mortality reported as quartiles relative to all hospitalizations. ICU = intensive care unit; APR-DRG = all patients refined diagnosis-related group; SOI = severity of illness; UHC = University HealthSystem Consortium; IQR = interquartile range.
MIXED EFFECTS MODELS FOR 30-DAY READMISSION
As characterized by APR SOI, Charlson score, and LOS, increased severity of illness was associated with unplanned 30-day readmissions. (Table 3) Prior to adjustment for other factors, readmissions were more likely among patients receiving care in the ICU during the index admission. After adjustment, in the full model, admission to the ICU was associated with reduced odds of readmission. Compared with Medicare beneficiaries, Medicaid beneficiaries exhibited higher and privately insured individuals exhibited lower unplanned readmission rates. (Table 3) Index admissions with digestive infections also had increased odds of readmission. (Table 3) A separate model used for RSRR estimation included additional CCS diagnosis codes. (eTable 3)
TABLE 3.
Characteristics of severe sepsis hospitalizations with and without an unplanned 30-day readmission.
| Characteristic | No Unplanned 30-day Readmission |
Unplanned 30-day Readmission |
Multivariable OR (95% CI) (Readmission vs. No Readmission) |
|---|---|---|---|
| % | % | ||
| N = 170,274 | N = 42,400 | ||
| Age (years) (mean, SD) (24 Missing) | 64.9 (17.5) | 64.2 (17.1) | 0.99 (0.99–1.00) |
| Sex (3 Missing) | |||
| Female | 48.9 | 49.4 | 1.03 (1.01–1.05) |
| Male | 51.1 | 50.6 | Ref |
| Race (1,936 Missing) | |||
| White | 65.7 | 65.3 | Ref |
| Black/African American | 23.7 | 24.5 | 1.00 (0.97–1.03) |
| Other | 10.6 | 10.2 | 0.96 (0.92–1.00) |
| Pay Type | |||
| Medicare | 64.7 | 66.5 | Ref |
| Medicaid | 14.2 | 16.6 | 1.03 (0.99–1.07) |
| Private | 13.9 | 12.2 | 0.78 (0.75–0.81) |
| Self-Pay | 4.7 | 3.0 | 0.64 (0.60–0.68) |
| Other | 2.6 | 1.8 | 0.69 (0.64–0.76) |
| APR-DRG SOI (12 Missing) | |||
| Minor | 0.4 | 0.2 | Ref |
| Moderate | 6.5 | 3.4 | 1.03 (0.79–1.33) |
| Major | 52.9 | 36.5 | 1.45 (1.13–1.87) |
| Extreme | 40.3 | 49.9 | 1.85 (1.43–2.38) |
| Index Admission LOS (days) (1,646 Missing) | |||
| ≤ 2 | 15.4 | 11.0 | Ref |
| 3–6 | 44.8 | 41.0 | 1.19 (1.15–1.24) |
| ≥ 7 | 39.9 | 48.0 | 1.42 (1.36–1.47) |
| Weighted Charlson Comorbidity Score | |||
| 0 | 16.4 | 10.1 | Ref |
| 1 | 19.5 | 15.0 | 1.24 (1.19–1.29) |
| ≥ 2 | 64.1 | 74.9 | 1.70 (1.64–1.76) |
| Admitted to ICU (at any time during hospitalization) |
29.0 | 31.3 | 0.90 (0.87–0.92) |
| ICD-9 Infection Category | |||
| Infectious and Parasitic Diseases | 47.6 | 49.1 | 0.98 (0.96–1.01) |
| Respiratory System | 34.2 | 32.5 | 0.91 (0.88–0.94) |
| Digestive System | 10.6 | 15.4 | 1.35 (1.30–1.40) |
| Genitourinary | 39.7 | 37.6 | 0.99 (0.96–1.01) |
| Skin and Subcutaneous Tissue | 10.6 | 9.9 | 0.90 (0.87–0.94) |
| Other | 12.8 | 14.6 | 1.05 (1.02–1.09) |
| ICD-9 Organ Dysfunction Category | |||
| Cardiovascular | 21.3 | 21.4 | 0.99 (0.96–1.02) |
| Hematological | 16.3 | 17.9 | 1.00 (0.97–1.04) |
| Neurologic | 11.2 | 10.8 | 0.96 (0.92–0.99) |
| Renal | 53.3 | 53.9 | 0.94 (0.91–0.97) |
| Respiratory | 23.9 | 24.7 | 1.03 (1.00–1.06) |
| Hepatic | 1.0 | 1.1 | 0.92 (0.83–1.02) |
Legend: Characteristics refer to index hospitalization. Odds ratios were determined using a multivariable mixed effects regression model with hospital identifiers included as random intercepts. Complete data for 212,674 eligible discharges, representing 209 hospitals. Four hospitals with fewer than 25 eligible cases, totaling 64 discharges, were excluded. OR = odds ratio; CI = confidence interval; SD = standard deviation; APR-DRG = all patients-refined diagnosis-related group; SOI = severity of illness; ICU = intensive care unit.
INSTITUTIONAL VARIATIONS IN SEVERE SEPSIS READMISSIONS
Observed 7-day readmission rates among 209 eligible hospitals ranged from 0 to 12.3%, with a median of 6.6% (IQR 5.4–7.6). Observed 30-day readmission rates ranged from 3.6 to 29.1%, with a median of 19.3% (IQR 17.0–21.0). (Figure 3A) Valid risk-standardization was possible only for 30-day readmissions. Thirty-day RSRRs ranged from 14.1% to 31.1% with a median of 19.7% (IQR 18.3–22.1). (Figure 3B and 3C) Institutions in the highest two quintiles (N= 83; worst RSRR performance) generally had higher severe sepsis volume and lower ICU utilization compared to institutions in the lowest two quintiles (N = 84; best RSRR performance); these poor performing institutions were also more likely to be teaching hospitals, offer trauma services, and be located in the Northeast Census region. (Table 4)
FIGURE 3. Distribution of institutional severe sepsis readmission rates among study hospitals.

Data was available for 212,674 eligible severe sepsis discharges with complete covariate information, representing 209 hospitals. Four hospitals with fewer than 25 eligible cases, totaling 64 discharges, were excluded. A) Institutional variation in observed 30-day readmission; B) Institutional variation in 30-Day RSRRs; C) Caterpillar plot for 30-day RSRRs. RSRR = risk-standardized readmission rate. Error bars represent 95% confidence interval limits. Black line indicates 19.9%, or an observed-to-expected ratio of one.
TABLE 4.
Institutional characteristics by risk-standardized severe sepsis readmission performance.
| RSRR Performance | |||
|---|---|---|---|
| Lowest 2 Quintiles (Best Performance) 14.1 – 19.2% (N = 84) |
Highest 2 Quintiles (Worst Performance) 20.7 – 31.1% (N = 83) |
p* | |
| Case Volume (Median; IQR) | 863 (413–1,278) | 1,029 (689–1,651) | 0.007 |
| Percent ICU Admission (Median; IQR) | 32.0 (26.7–38.7) | 28.7 (24.2–33.7) | 0.028 |
| Percent Medicaid Discharges (Median; IQR) | 11.1 (6.3–17.8) | 12.5 (7.7–17.7) | 0.231 |
| Percent Aged 65+ (Median; IQR) | 57.2 (41.6–66.6) | 51.5 (39.3–69.0) | 0.815 |
| Large Metro Area (N; %) | 60 (71.4) | 57 (68.7) | 0.698 |
| Trauma Hospital (N; %) | 33 (42.3) | 55 (69.6) | 0.001 |
| Teaching Hospital (N; %) | 51 (60.7) | 63 (75.9) | 0.035 |
| Bed Size > 400 (N; %) | 33 (39.3) | 50 (60.2) | 0.007 |
| Census Region (N; %) | 0.025 | ||
| Northeast | 15 (17.9) | 31 (37.4) | |
| Midwest | 26 (31.0) | 25 (30.1) | |
| South | 30 (35.7) | 18 (21.7) | |
| West | 13 (15.5) | 9 (10.8) | |
| Hospital Type (N; %) | 0.756 | ||
| Government, Non-Federal | 21 (25.0) | 25 (30.1) | |
| Non-Government, Non-Profit | 60 (71.4) | 55 (66.3) | |
| Investor-Owned | 3 (3.6) | 3 (3.6) | |
Legend:
P-values from non-parametric Wilcoxon rank-sum tests for continuous measures and Pearson Chi-Square tests of association for categorical. RSRR = Risk-Standardized Readmission Rate; ICU = intensive care unit; IQR = interquartile range.
DISCUSSION
In this cohort of more than 216,000 patients admitted with severe sepsis in 2012, one in twenty experienced an unplanned readmission within 7 days and one in five experienced an unplanned readmission within 30 days after hospital discharge. Institutional rates of 30-day readmission varied more than two-fold, as RSRRs ranged from 14–31%. We also observed large differences in severe sepsis volume, ICU utilization, and hospital services offered between hospitals with the highest and lowest RSRRs. The 30-day severe sepsis readmission rates observed in this and other studies are similar in magnitude to those of conditions such as heart failure, pneumonia, and acute myocardial infarction (AMI).(14, 16–21) Considering the potential impact of severe sepsis readmissions on patient wellbeing as well as the financial implications for healthcare systems, effective strategies for the reduction of readmissions in this population must be identified and a greater understanding of the long-term consequences of readmissions is needed.
A number of studies have characterized hospital readmissions after sepsis, but focused on different populations. In a study of 6,344 sepsis patients from twenty-one community-based hospitals in a northern California integrated healthcare system, Liu, et al. found that 17.9% were readmitted within 30 days.(7) Similar to our analysis, severity of illness, comorbidity burden, and LOS were associated with risk of readmission. Several additional studies have recently examined readmission following sepsis, collectively demonstrating the substantial burden of sepsis readmission in terms of cost, mortality, and healthcare resource utilization.(10–12)
In a series of two publications, Prescott, et al. examined one-year healthcare utilization in survivors of severe sepsis and diagnoses upon readmission using data from the Health and Retirement Study.(6, 22) In a matched analysis, the authors identified elevated resource utilization for sepsis compared with nonsepsis controls, with 26.5% of severe sepsis patients readmitted within 30 days.(6) Our results are consistent, showing a 30-day readmission rate of nearly 20%. In a separate study, the authors also examined the primary diagnosis code among severe sepsis readmissions within 90 days, finding that 11.9% had a primary diagnosis related to infection.(22) We examined all diagnosis codes and used a more comprehensive definition of infection, identifying a much higher proportion of readmissions with an infection diagnosis.
Our study differs from prior efforts in several important ways. We examined a more diverse patient population, incorporating a larger range of hospitals and encompassing patients from a range of health insurance coverage types. We focused on those patients initially admitted to the hospital with severe sepsis, distinguishing those with severe sepsis present on admission. The current study is also unique in that we defined unplanned hospital readmissions using CMS HWR algorithms in a new data set and examined institutional factors associated with readmission performance.(14)
The observed severe sepsis readmissions may be due to the natural biological course of the condition. Numerous studies highlight the long-term sequelae that persist after recovery from severe sepsis. Wang, et al. found that there is two-fold increased risk of death five years after a sepsis hospitalization.(4) Sepsis patients may experience a period of immunosuppression following hospitalization, potentially increasing susceptibility to infection.(23) Wang, et al. observed an increased risk of subsequent infection and hospitalization among ICU survivors; sepsis on the index admission was the strongest predictor of post-discharge recurrent infection, readmission for infection, and post-discharge mortality.(24) Iwashnya, et al. identified cognitive impairment in survivors of sepsis.(5) Physiological changes or complications resulting from the stress of hospitalization (disrupted sleep, poor nourishment, pain and discomfort, mental stress, and physical deconditioning) could also make individuals more vulnerable to short-term readmission.(17, 25) Early systematic outpatient or other follow-up care may potentially play a key role in the identification and treatment of these sequelae.
While not evaluated in our study, another potential explanation for severe sepsis readmissions is the quality of hospital care during the index severe sepsis admission. International consensus guidelines underscore the importance – and difficulty – of early sepsis detection and aggressive structured care.(26) In this series, after all exclusions were applied, only 31% of index severe sepsis cases were admitted to the ICU at any time during hospitalization. An important unanswered question is whether less intense inpatient care (-i.e., without use of the ICU) may render the patient more susceptible to decompensation after discharge. Additional study must identify sepsis care processes potentially tied to sepsis readmissions. Of note, the hospital length-of-stay for severe sepsis readmissions was not brief, with readmitted cases hospitalized for a median of five days. This observation suggests that the readmission events have significant medical complexities and do not comprise brief care episodes.
The observed ICU admission rate in the current analysis is lower than prior reports.(2, 27, 28) Angus, et al. observed a severe sepsis ICU admission rate of 51.1%, but those data originate from 1995, almost twenty years prior to the current series.(2) The promulgation of the Surviving Sepsis Campaign guidelines has radically changed ED sepsis management since the Angus paper, and widespread ED early sepsis detection and aggressive resuscitation would be expected to result in lower need for ICU utilization. Walkey, et al. published a more current analysis using UHC data, finding an ICU admission rate of 69%, but their data used a narrower definition of severe sepsis, limiting to patients with diagnosis codes for septicemia, and did not apply the same exclusions.(27) Consistent with the Angus methodology, we used a wider range of infection-related codes. Our data also originate from hospitals affiliated with large academic medical centers, which may have different thresholds for and patterns of ICU admission.(28) For example, select institutions may be more accustomed to managing mid-range sepsis acuity in regular hospital ward settings rather than in the ICU. We also excluded inpatient deaths and transfers, which included discharges more likely to be admitted to the ICU.
The more than two-fold institutional RSRR variation and the observed differences in characteristics between hospitals performing in the bottom versus top two quintiles were interesting. As UHC is a consortium of the largest US academic medical centers, and participation is voluntary with the overarching goal of quality improvement, it could be expected that the hospitals in our sample would be well-attuned to sepsis care guidelines. This prompts a need for further study into what factors may lead to such pronounced variation in outcomes. In our sample, the best performing institutions were non-teaching, non-trauma hospitals with lower volume among severe sepsis patients. This could suggest differences in non-inpatient institutional resource availability, with discharges from smaller volume hospitals less likely to have access to comprehensive outpatient services and subsequently less likely to return for care within the same system. Alternatively, despite our efforts to adjust RSRR estimates for case-mix using a large number of patient characteristics, smaller hospitals may simply provide care for patients of lesser severity. Finally, low volume hospitals could indeed be outperforming those with higher volumes, potentially due to increased attention and staff availability to provide adequate care for a given patient. The best performers also had a higher ICU admission rate compared to the worst performers. This finding could suggest that ICU access blocks may explain some of the observed variation in readmission.
A wide range of strategies have been implemented to reduce readmission of other conditions.(29–33) For example, targeted interventions may reduce readmission among patients with heart failure, including patient education, medication counseling with enhanced discharge planning and follow-up, and coaching of patients and caregivers.(31–33) Observational studies on heart failure and AMI readmission have also supported the partnering of hospitals with community physicians or other local hospitals, increasing the frequency of nurses providing medication reconciliation at discharge, providing discharge summaries to patients’ primary care provider, and arranging outpatient follow-up prior to discharge.(29, 30) While the needs of sepsis patients clearly differ from those surviving AMI and heart failure, these parallel studies offer evidence that coordinated care between hospital and outpatient providers may prove effective. It is important to note that while sepsis survivors may exhibit myriad sequelae, the optimal strategies for detecting or managing these complications remain undefined.
LIMITATIONS
Our study focused on events with severe sepsis present on admission rather than severe sepsis developing during hospitalization, future efforts should explore readmission in this unique population. Our observed readmission rates may have been higher with the inclusion of the latter subgroup. Among severe sepsis discharges, some follow-up data could not be identified; for example, individuals readmitted to a different institution, or those who died at home. Despite these limitations, we still observed substantial severe sepsis readmission rates, and thus our estimates may be conservatively low. Although we were not able to capture all readmissions, same-hospital rates may still have utility in quality improvement initiatives.(34) Our observations originate from hospitals affiliated with academic medical centers; readmission rates may differ for community-based centers. We excluded transfers from outside hospitals, which could have impacted the associations identified between risk factors and readmission (e.g. ICU admission). Also, miscoding of readmissions could have occurred. However, prior work indicates that readmissions were accurately coded in this database and that clinical data were highly concordant with information obtained on chart review.(35)
Inaccurate discharge diagnoses may have led to misclassification of severe sepsis. However, the Angus strategy for identifying severe sepsis has been widely employed in previous epidemiologic studies, including several using the same UHC database.(27, 36) We were unable to determine more granular aspects of severe sepsis hospitalizations, such as information related to care transitions or social support. These factors are likely important determinants of readmission risk and merit future study. Our study was conducted at the discharge level as we could not track patients across hospitals, meaning that index discharges could represent readmissions from a prior encounter. In our comparison of hospital RSRRs, we were unable to obtain information prior to hospital admission and may not have achieved adequate risk adjustment. However, the observed discrimination was similar to that of the models utilized in the HWR and prior studies suggest that effective risk adjustment strategies can be implemented in sepsis studies using administrative data.(14, 37)
CONCLUSIONS
In conclusion, in this study of patients hospitalized with severe sepsis, one in five was readmitted within 30-days of discharge and institutional readmission rates varied more than two-fold, with several institutional characteristics associated with performance. Hospitals and physicians must determine the etiologies for and develop strategies to reduce severe sepsis readmissions.
Supplementary Material
Acknowledgments
Financial Support: Mr. Donnelly received support from the Agency for Healthcare Research and Quality, Rockville, Maryland (T32-HS013852). Dr. Wang received grant support from the National Institute for Nursing Research (R01-NR012726 ). The funding sources outlined in this manuscript had no role in the study’s design, conduct, and reporting.
LIST OF ABBREVIATIONS
- UHC
University HealthSystem Consortium
- RSRR
Risk-Standardized Readmission Rate
- CI
Confidence Interval
- ACA
Patient Protection and Affordable Care Act
- CMS
Centers for Medicare and Medicaid Services
- AMI
Acute Myocardial Infarction
- CDB
Clinical Database
- AHRQ
Agency for Healthcare Research and Quality
- CCS
Clinical Classifications Software
- SIRS
Systemic Inflammatory Response Syndrome
- HWR
Hospital-Wide Readmission Measure
- DRG
Diagnosis Related Group
- LOS
Length of Stay
- ICU
Intensive Care Unit
- APR
All-Patients Refined
- SOI
Severity of Illness
- IQR
Interquartile Range
Footnotes
Dr. Hohmann disclosed that he does not have any potential conflicts of interest.
AUTHORSHIP
All authors participated in the study design, analysis and writing of the manuscript. No other persons participated in the analyses, drafting or revision of the manuscript.
CONFLICTS OF INTEREST
None of the authors disclose any conflicts of interest relevant to this report.
Contributor Information
John P. Donnelly, Email: johndonnelly@uabmc.edu.
Samuel F. Hohmann, Email: hohmann@uhc.edu.
Henry E. Wang, Email: hwang@uabmc.edu.
REFERENCES
- 1.Wang HE, Shapiro NI, Angus DC, et al. National estimates of severe sepsis in United States emergency departments. Crit Care Med. 2007;35(8):1928–1936. doi: 10.1097/01.CCM.0000277043.85378.C1. [DOI] [PubMed] [Google Scholar]
- 2.Angus DC, Linde-Zwirble WT, Lidicker J, et al. Epidemiology of severe sepsis in the United States: analysis of incidence, outcome, and associated costs of care. Crit Care Med. 2001;29(7):1303–1310. doi: 10.1097/00003246-200107000-00002. [DOI] [PubMed] [Google Scholar]
- 3.Angus DC, Wax RS. Epidemiology of sepsis: an update. Crit Care Med. 2001;29(7 Suppl):S109–116. doi: 10.1097/00003246-200107001-00035. [DOI] [PubMed] [Google Scholar]
- 4.Wang HE, Szychowski JM, Griffin R, et al. Long-term mortality after community-acquired sepsis: a longitudinal population-based cohort study. BMJ Open. 2014;4(1):e004283. doi: 10.1136/bmjopen-2013-004283. [DOI] [PMC free article] [PubMed] [Google Scholar]
- 5.Iwashyna TJ, Ely EW, Smith DM, et al. Long-term cognitive impairment and functional disability among survivors of severe sepsis. JAMA. 2010;304(16):1787–1794. doi: 10.1001/jama.2010.1553. [DOI] [PMC free article] [PubMed] [Google Scholar]
- 6.Prescott HC, Langa KM, Liu V, et al. Increased 1-year healthcare use in survivors of severe sepsis. Am J Respir Crit Care Med. 2014;190(1):62–69. doi: 10.1164/rccm.201403-0471OC. [DOI] [PMC free article] [PubMed] [Google Scholar]
- 7.Liu V, Lei X, Prescott HC, et al. Hospital readmission and healthcare utilization following sepsis in community settings. J Hosp Med. 2014 doi: 10.1002/jhm.2197. [DOI] [PMC free article] [PubMed] [Google Scholar]
- 8.Readmissions Reduction Program. [cited 2014 July 13th]; Available from: http://www.cms.gov/Medicare/Medicare-Fee-for-Service-Payment/AcuteInpatientPPS/Readmissions-Reduction-Program.html.
- 9.Jencks SF, Williams MV, Coleman EA. Rehospitalizations among patients in the Medicare fee-for-service program. N Engl J Med. 2009;360(14):1418–1428. doi: 10.1056/NEJMsa0803563. [DOI] [PubMed] [Google Scholar]
- 10.Jones TK, Fuchs BD, Small DS, et al. Post-Acute Care Use and Hospital Readmission After Sepsis. Ann Am Thorac Soc. 2015 doi: 10.1513/AnnalsATS.201411-504OC. [DOI] [PMC free article] [PubMed] [Google Scholar]
- 11.Goodwin AJ, Rice DA, Simpson KN, et al. Frequency, cost, and risk factors of readmissions among severe sepsis survivors. Crit Care Med. 2015;43(4):738–746. doi: 10.1097/CCM.0000000000000859. [DOI] [PMC free article] [PubMed] [Google Scholar]
- 12.Ortego A, Gaieski DF, Fuchs BD, et al. Hospital-based acute care use in survivors of septic shock. Crit Care Med. 2015;43(4):729–737. doi: 10.1097/CCM.0000000000000693. [DOI] [PMC free article] [PubMed] [Google Scholar]
- 13.University HealthSystem Consortium. [cited 2014 July 13th]; Available from: https://www.uhc.edu/
- 14.Yale New Haven Health Services Corporation/Center for Outcomes Research and Evaluation (YNHHSC/CORE) [Accessed July 13th, 2014];2013 Measure Updates and Specifications Report: Hospital-Wide All-Cause Unplanned Readmission Measure (Version 2.0) 2013 Mar; http://qualitynet.org/dcs/ContentServer?cid=1219069855841&pagename=QnetPublic%2FPage%2FQnetTier4&c=Page.
- 15.Joynt KE, Jha AK. A path forward on Medicare readmissions. N Engl J Med. 2013;368(13):1175–1177. doi: 10.1056/NEJMp1300122. [DOI] [PubMed] [Google Scholar]
- 16.Suter LG, Li SX, Grady JN, et al. National Patterns of Risk-Standardized Mortality and Readmission After Hospitalization for Acute Myocardial Infarction, Heart Failure, and Pneumonia: Update on Publicly Reported Outcomes Measures Based on the 2013 Release. J Gen Intern Med. 2014 doi: 10.1007/s11606-014-2862-5. [DOI] [PMC free article] [PubMed] [Google Scholar]
- 17.Dharmarajan K, Hsieh AF, Lin Z, et al. Diagnoses and timing of 30-day readmissions after hospitalization for heart failure, acute myocardial infarction, or pneumonia. JAMA. 2013;309(4):355–363. doi: 10.1001/jama.2012.216476. [DOI] [PMC free article] [PubMed] [Google Scholar]
- 18.Dharmarajan K, Hsieh AF, Lin Z, et al. Hospital readmission performance and patterns of readmission: retrospective cohort study of Medicare admissions. BMJ. 2013;347:f6571. doi: 10.1136/bmj.f6571. [DOI] [PMC free article] [PubMed] [Google Scholar]
- 19.Krumholz HM, Lin Z, Keenan PS, et al. Relationship between hospital readmission and mortality rates for patients hospitalized with acute myocardial infarction, heart failure, or pneumonia. JAMA. 2013;309(6):587–593. doi: 10.1001/jama.2013.333. [DOI] [PMC free article] [PubMed] [Google Scholar]
- 20.Krumholz HM, Lin Z, Drye EE, et al. An administrative claims measure suitable for profiling hospital performance based on 30-day all-cause readmission rates among patients with acute myocardial infarction. Circ Cardiovasc Qual Outcomes. 2011;4(2):243–252. doi: 10.1161/CIRCOUTCOMES.110.957498. [DOI] [PMC free article] [PubMed] [Google Scholar]
- 21.Lindenauer PK, Normand SL, Drye EE, et al. Development, validation, and results of a measure of 30-day readmission following hospitalization for pneumonia. J Hosp Med. 2011;6(3):142–150. doi: 10.1002/jhm.890. [DOI] [PubMed] [Google Scholar]
- 22.Prescott HC, Langa KM, Iwashyna TJ. Readmission diagnoses after hospitalization for severe sepsis and other acute medical conditions. JAMA. 2015;313(10):1055–1057. doi: 10.1001/jama.2015.1410. [DOI] [PMC free article] [PubMed] [Google Scholar]
- 23.Wang TS, Deng JC. Molecular and cellular aspects of sepsis-induced immunosuppression. J Mol Med (Berl) 2008;86(5):495–506. doi: 10.1007/s00109-007-0300-4. [DOI] [PubMed] [Google Scholar]
- 24.Wang T, Derhovanessian A, De Cruz S, et al. Subsequent infections in survivors of sepsis: epidemiology and outcomes. J Intensive Care Med. 2014;29(2):87–95. doi: 10.1177/0885066612467162. [DOI] [PMC free article] [PubMed] [Google Scholar]
- 25.Krumholz HM. Post-hospital syndrome--an acquired, transient condition of generalized risk. N Engl J Med. 2013;368(2):100–102. doi: 10.1056/NEJMp1212324. [DOI] [PMC free article] [PubMed] [Google Scholar]
- 26.Dellinger RP, Carlet JM, Masur H, et al. Surviving Sepsis Campaign guidelines for management of severe sepsis and septic shock. Crit Care Med. 2004;32(3):858–873. doi: 10.1097/01.ccm.0000117317.18092.e4. [DOI] [PubMed] [Google Scholar]
- 27.Walkey AJ, Wiener RS. Hospital case volume and outcomes among patients hospitalized with severe sepsis. Am J Respir Crit Care Med. 2014;189(5):548–555. doi: 10.1164/rccm.201311-1967OC. [DOI] [PMC free article] [PubMed] [Google Scholar]
- 28.Mayr FB, Yende S, Angus DC. Epidemiology of severe sepsis. Virulence. 2014;5(1):4–11. doi: 10.4161/viru.27372. [DOI] [PMC free article] [PubMed] [Google Scholar]
- 29.Bradley EH, Curry L, Horwitz LI, et al. Hospital strategies associated with 30-day readmission rates for patients with heart failure. Circ Cardiovasc Qual Outcomes. 2013;6(4):444–450. doi: 10.1161/CIRCOUTCOMES.111.000101. [DOI] [PMC free article] [PubMed] [Google Scholar]
- 30.Bradley EH, Curry L, Horwitz LI, et al. Contemporary evidence about hospital strategies for reducing 30-day readmissions: a national study. J Am Coll Cardiol. 2012;60(7):607–614. doi: 10.1016/j.jacc.2012.03.067. [DOI] [PMC free article] [PubMed] [Google Scholar]
- 31.Koehler BE, Richter KM, Youngblood L, et al. Reduction of 30-day postdischarge hospital readmission or emergency department (ED) visit rates in high-risk elderly medical patients through delivery of a targeted care bundle. J Hosp Med. 2009;4(4):211–218. doi: 10.1002/jhm.427. [DOI] [PubMed] [Google Scholar]
- 32.Parry C, Min SJ, Chugh A, et al. Further application of the care transitions intervention: results of a randomized controlled trial conducted in a fee-for-service setting. Home Health Care Serv Q. 2009;28(2–3):84–99. doi: 10.1080/01621420903155924. [DOI] [PubMed] [Google Scholar]
- 33.Krumholz HM, Amatruda J, Smith GL, et al. Randomized trial of an education and support intervention to prevent readmission of patients with heart failure. J Am Coll Cardiol. 2002;39(1):83–89. doi: 10.1016/s0735-1097(01)01699-0. [DOI] [PubMed] [Google Scholar]
- 34.Nasir K, Lin Z, Bueno H, et al. Is same-hospital readmission rate a good surrogate for all-hospital readmission rate? Med Care. 2010;48(5):477–481. doi: 10.1097/MLR.0b013e3181d5fb24. [DOI] [PubMed] [Google Scholar]
- 35.Sutton JM, Hayes AJ, Wilson GC, et al. Validation of the University HealthSystem Consortium administrative dataset: concordance and discordance with patient-level institutional data. J Surg Res. 2014;190(2):484–490. doi: 10.1016/j.jss.2014.03.044. [DOI] [PubMed] [Google Scholar]
- 36.Wang HE, Donnelly JP, Shapiro NI, et al. Hospital Variations in Severe Sepsis Mortality. Am J Med Qual. 2014 doi: 10.1177/1062860614534461. [DOI] [PubMed] [Google Scholar]
- 37.Lagu T, Lindenauer PK, Rothberg MB, et al. Development and validation of a model that uses enhanced administrative data to predict mortality in patients with sepsis. Crit Care Med. 2011;39(11):2425–2430. doi: 10.1097/CCM.0b013e31822572e3. [DOI] [PubMed] [Google Scholar]
Associated Data
This section collects any data citations, data availability statements, or supplementary materials included in this article.