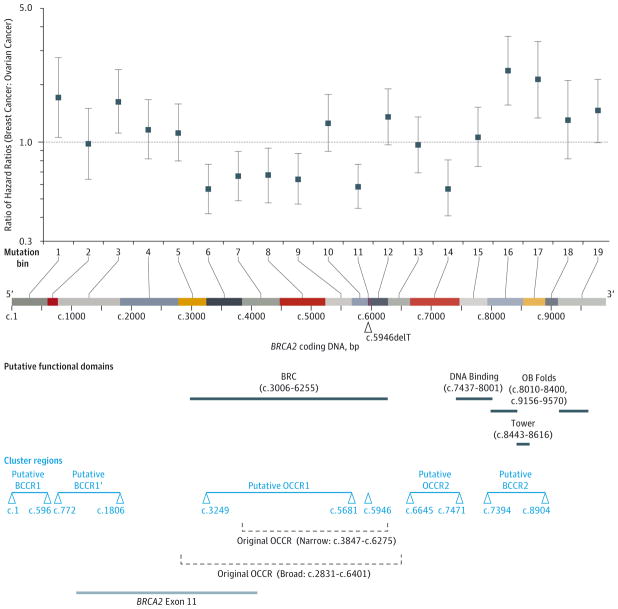
Figure 3. Hazard Ratio of Breast Cancer Relative to the Hazard Ratio of Ovarian Cancer by BRCA2 Nucleotide Position.
The graph shows the ratio of hazard ratios (blue data markers) and 95% CI (error bars) for the mutation bins defined across the span of the coding DNA sequence of the BRCA2 gene. The black arrowhead under the bins indicates a founder mutation of clinical interest in the Ashkenazi Jewish population. The regions inferred to be breast cancer cluster regions (BCCRs) and ovarian cancer cluster regions (OCCRs) are shown at the bottom; the solid light blue lines indicate regions found to be statistically significant. eTable 3 in the Supplement lists the bins and risks used to define to define the BCCRs and OCCRs.

