

Abstract
We have developed a 3D cell/tissue culture bioreactor compatible with hyperpolarized (HP) 13C MR and interrogated HP [1-13C] lactate production and efflux in human renal cell carcinoma (RCC) cells. This platform is capable of resolving intracellular and extracellular HP lactate pools, allowing the kinetic measurement of lactate production and efflux in the context of cancer aggressiveness and response to therapy. HP 13C MR studies were performed on 3 immortalized human renal cell lines: HK2, a normal renal proximal tubule cell line from which a majority of RCCs arise, UMRC6, a cell line derived from a localized RCC and UOK262, an aggressive and metastatic RCC. The intra- (Lacin) and extracellular (Lacex) HP lactate signals were robustly resolved in dynamic 13C spectra of the cell lines due to a very small but reproducible chemical shift difference(0.031 ± 0.0005 ppm). Following HP [1-13C] pyruvate delivery, the ratio of HP Lacin/Lacex was significantly lower for UOK262 cells compared to both UMRC6 as well as the HK2 cells due to a significant (p<0.05) increase in the Lacex pool size. The Lacin/Lacex correlated with the MCT4 mRNA expression of the cell lines, and inhibition of MCT4 transport using DIDS resulted in a significant reduction in the HP Lacex pool size. The extension of these studies to living patient derived RCC tissue slices using HP [1,2-13C2]pyruvate demonstrated a similarly split lactate doublet with a high Lacex pool fraction; in contrast, only a single NMR resonance is noted for HP [5-13C]glutamate consistent with intracellular localization. These studies support the importance of lactate efflux as a biomarker of cancer aggressiveness and metastatic potential, and the utility of the MR compatible 3D cell/tissue culture bioreactor to study not only cellular metabolism but also transport. Additionally, this platform offers a sophisticated way to follow therapeutic interventions and screen novel therapies that target lactate export.
Keywords: Hyperpolarized 13C magnetic resonance (HP 13C MR), dynamic nuclear polarization (DNP), pyruvate, lactate, aerobic glycolysis, lactate efflux, renal cell carcinoma (RCC), cancer aggressiveness
Graphical Abstract

Intra- and extra- cellular lactate pools were reliably distinguished and validated using a susceptibility matched MR compatible 3D cell culture bioreactor using hyperpolarized (HP) 13C magnetic resonance spectroscopy. The HP lactate (Lacin/Lacex) ratio correlates with the lactate exporter, MCT4, expression and can be used to discriminate between renal cells of varying aggressiveness (HK-2 – normal renal epithelial cells; UOK262-metastatic renal cell carcinoma (RCC); UMRC6 - aggressive localized RCC). The combination of HP 13C MR with the bioreactor platform can be used to interrogate the crucial role of lactate production and its efflux in cancer aggressiveness and metastases.
Introduction
There is growing evidence that the up-regulation of aerobic glycolysis and lactate production and efflux is an adaptation of cancer cells that aids in survival, growth, and metastasis (1,2). Tumor excretion of lactic acid, combined with poor tumor perfusion, results in an acidic extracellular pH in tumors compared with normal tissue (3). The resulting acidic environment promotes cancer aggressiveness and metastasis by promoting a degradation of the extracellular matrix by proteinases (4,5), increasing angiogenesis through the release of VEGF (6), and inhibiting the immune response to tumor antigens (7). Extracellular acidification also may render tumors chemo-resistant (8). Taken together, these observations suggest that not only increased lactic acid production but also its efflux are important parameters associated with aggressive cancer phenotypes (9,10). Moreover, tumor-specific metabolic shifts, such as increased production and efflux of lactate, can potentially be exploited for cancer therapy with minimal impact on normal tissues (3).
Hyperpolarized 13C MRI is a new molecular imaging technique that allows rapid and noninvasive monitoring of dynamic pathway-specific metabolic and physiologic processes (11). Fast 13C MR after injection of hyperpolarized (HP) [1-13C]pyruvate has allowed the measurement of increased HP [1-13C]lactate production in both pre-clinical models of cancer (12) and patients with prostate cancer (13). Increased HP [1-13C]pyruvate to lactate conversion has been associated with cancer presence (14) and correlated with increasing cancer aggressiveness/pathologic grade (15). Furthermore, reduced HP [1-13C]lactate early after therapy correlated with therapeutic efficacy (16–19). Current HP 13C MRI approaches have not delineated intracellular and extracellular lactate pools, although recent diffusion weighted HP 13C MR approaches have shown the potential to interrogate these two compartments (20–22).
An MR compatible 3D cell/tissue culture bioreactor has been engineered and used to provide a platform to serially monitor the metabolism of viable human cells (23) and tissues (24) in a very controlled environment and with excellent spectral resolution. The bioreactor set-up provides a continuous perfusion of nutrients at a well-regulated temperature with adequate oxygen delivery. The use of smaller cell and tissue sample chamber in a 5 mm diameter susceptibility–matched bioreactor design has provided a high mass sensitivity (filling factor) with sufficient B0 field homogeneity under continuous perfusion conditions for the acquisition of well-resolved serial multinuclear (31P and 13C) NMR spectra from small amounts of living cells (≈ 8 million) and tissues (≈ 60 mg) (25).
The goal of this study was to determine if the MR compatible 3D culture bioreactor could be used with HP 13C MR to monitor both the increased cellular production of lactate and its efflux in renal cell carcinoma, thereby providing a means to test the importance of this process in cancer aggressiveness, metastasis and response to therapy. To accomplish this, HP 13C MR studies were performed on 3 human renal cell lines in the MR compatible 3D cell culture bioreactor: HK-2 renal proximal tubule cell line (from which most renal cell carcinomas arise), UMRC6 derived from a localized renal cell carcinoma (RCC), and UOK262 established from a highly aggressive metastatic RCC. These cell lines are also known to have differential levels of lactate production and efflux (26). The ability of the bioreactor platform to measure the inhibition of lactic acid efflux using a small molecule monocarboxylate transporter (MCT) inhibitor, DIDS, was also investigated. Lactate is exported out of the cell by the monocarboxylate transporters, predominately MCT4 (27). DIDS irreversibly and efficiently binds to MCT transporters (an order of magnitude higher affinity for MCT4 than MCT1) and inhibits lactate efflux and to a lesser degree pyruvate uptake (27,28). The studies described in this manuscript demonstrate that intra- and extra-cellular pools of lactate can be detected and quantified in dynamic (3 sec temporal resolution) 1D 13C MR spectra after injection of HP [1-13C]pyruvate and that the HP intracellular/extracellular [1-13C]lactate ratio differentiates between localized and metastatic human renal cell carcinoma lines. Further, we have shown that the HP intracellular/extracellular lactate fraction correlates with MCT4 mRNA expression, and the inhibition of lactate efflux with DIDS results in significantly decreased extracellular lactate.
Material and Methods
Cell lines
All three cell lines were grown in monolayers in DMEM (Dulbeco’s Modified Eagle’s medium) with 4.5g/L glucose media with 10% serum. HK-2 cell line (29) was purchased from ATCC (Manassas, Virginia). The other 2 cells lines, UMRC6 and UOK262, were a kind gift from Dr. Bart Grossman (MD Anderson Cancer Center, Houston, TX) and Dr. W. Marston Linehan (National Cancer Institute, Bethesda, MD) respectively. The UMRC6 cells were derived from a localized human clear cell renal cell carcinoma (30). The UOK262 cells were derived from a metastasis of the highly aggressive hereditary leiomyomatosis renal cell carcinoma (HLRCC).
MR experiments
As described previously (26), trypsinized cells were prepared for bioreactor MR experiments by electrostatic encapsulation into alginate microspheres. A homogenous mixture of 200 – 250 μL of cell-laden microspheres (Supplementary Figure S1) were maintained at physiological conditions by circulating media at 37oC and supplying 95% air/ 5% CO2 via a gas exchanger in the 5mm MR compatible bioreactor. 500MHz Varian Inova (Agilent Technologies, Palo Alto, CA) console equipped with a 5mm, triple-tuned, direct-detect, broadband probe was used for the bioreactor studies. A hypersense polarizer (Oxford Instruments, Oxford, UK) was used to polarize 14.2 M [1-13C]pyruvate mixed with 15 mM of the trityl radical (GE Health, Menlo Park, CA, USA) and 2.5 mM gadolinium chelate. 16 μmols HP [1-13C]pyruvate was injected into the bioreactor containing the cell-laden microspheres. A 30o flip angle was used to acquire carbon data every 3s for a total of 5 minutes. Cell viability was assessed by phosphorous spectra acquired with 2048 averages, repetition time of 2s and a 90 degree pulse. The Electronic REference To access In vivo Concentrations (ERETIC) signal (31) was adapted for the phosphorous channel and used to estimate the amount of β-NTP of cells within the sensitive volume of the RF coil, a more stringent measure of viable cells. The intracellular inorganic phosphate (Pi) peak was resolved from the Pi signal arising from the circulating media for both the UOK262 as well as the UMRC6 cells. The intracellular pH of these cells were calculated using the chemical shift of the Pi peak, the known pH of the media (7.67 ± 0.04 at 37°C), and published methods (32,33). All bioreactor studies were conducted under the continuous perfusion condition of 0.5 ml/min (n=6), except for the flow modulation experiments when the pump was stopped 15 seconds after the completion of the hyperpolarized substrate infusion (n=3). For MCT inhibition studies (n=3), DiDS (4,4′-Diisothiocyanatostilbene-2,2′-Disulfonic Acid, Disodium Salt ) was purchased from Molecular Probes (Life Technologies, Foster City, CA) and dissolved in DMSO to a concentration of 1mM. It was added via a filter to the media used to perfuse the cells, after baseline phosphorous and carbon measurements were made.
The rate of lactate accumulation in the media of the UOK262 cells grown in 25mM [3-13C]pyruvate in 2D culture with and without DIDS inhibition was quantified by 1H MR spectroscopy (n=3 each). The media of the UOK262 cells were sampled serially over 8 hours. Fully relaxed 1H NMR spectra were measured in an 800MHz Bruker DRX spectrometer (Billerica, MA) equipped with a cryo-cooled 5mm triple-axis heteronuclear probe and the J-coupled 13C satellite resonance was quantified using ACD/Labs software as described below.
qRT-PCR
mRNA qRT-PCR was performed as described previously (26) on the total RNA extracted from the cells with RNAeasy procedure kit (Qiagen, USA). In brief, reverse transcription using iScript cDNA Synthesis kit (BioRad Laboratories, Hercules, CA, USA) was performed and subsequently the cDNA generated was utilized for PCR in triplicate with TaqMan chemistry on the ABI 7900HT (Applied Biosystems, Foster City, CA, USA). Assays for MCT4 was procured from Applied Biosystems (Foster City, CA, USA). The mRNA expression was calculated relative to the housekeeping gene β–actin.
Data analysis
The MR data was processed and analyzed using ACD/Labs software (Toronto, Ontario, Canada). The β-NTP peak was quantified in nmols from the 31P spectra by normalizing the integrated peak area against the calibrated ERETIC peak. The 13C data were processed with (5 Hz) broadening and deconvolved with Lorentzian peak fitting. The hyperpolarized lactate data (total area under the curve over time) was then normalized to nmols of β-NTP, and the pyruvate peak area for comparison across experiments and cell lines. All data are represented as mean ± standard error. A student’s t-test was used to assess the difference between groups. Significant (p<0.05) differences between cell lines were denoted by an asterisk (*).
Renal tissue slice bioreactor set-up
Renal tumor tissues were obtained from nephrectomy and sliced into 300 μm thick disks and cultured for 12 hours (34). 4 slices were placed in the 5mm MR compatible bioreactor using a specialized construct to hold the tissue in place, and were well perfused in circulating medium at physiological temperature. NMR data were acquired on a narrow bore 11.7T Varian INOVA equipped with a 5mm broadband probe. 31P spectra were obtained to monitor tissue viability. HP 13C MR was acquired dynamically (10° pulses, 3 s interval for 300 s) following injection of 1mL of 4mM of [1,2-13C2] pyruvate to assess its metabolism in the renal carcinoma tissue slices.
Results
Combining Hyperpolarized 13C MRS with a MR Compatible Bioreactor Provides a Measure of the Intra- /Extra- cellular Compartmentalization of Lactate
The custom built 5mm diameter MR compatible bioreactor allowed the metabolic evaluation of an average of 40 ± 7 million cells with good sensitivity (HP lactate S/N ranging from 19 to 216 depending on the cell line) and excellent B0 field homogeneity (average water line width at half maximum, LWHM, is 11.37 ± 0.69 Hz). These line-widths were routinely obtained by gradient shimming along the Z-axis followed by manual shimming of the X and Y gradients which took approximately 15 minutes. This B0 field homogeneity was achievable due to the material utilized in the construction of the bioreactor having a similar magnetic susceptibility to that of water, and by ensuring there were no air interfaces (i.e. air bubbles) within the bioreactor. Figure 1A shows a schematic of the 5mm bioreactor that was optimized for maximal homogeneity and minimal cell culture material requirement. The viability of all three cell lines during the course of the hyperpolarized MR studies was demonstrated by 31P NMR spectra acquired before and after each hyperpolarized [1-13C]pyruvate injection (Figure 1B). The 31P spectra were similar to what was previously published for these cell lines (HK-2, UMRC6, and UOK262) (26), and the β-NTP did not change significantly during the time course of the hyperpolarized studies. 31P NMR also demonstrated similar intracellular pH’s of 7.32 ± 0.01 and 7.33 ± 0.04 respectively for UMRC6, and U0K262 RCC cell lines. Unfortunately, the intracellular Pi peak of the HK-2 cell line could not be spectrally resolved from the media Pi peak, presumably due either to the more alkaline intracellular pH of this cell line or the inherently low intracellular Pi levels due to the non-glycolytic nature of these proximal tubular cells (35).
Figure 1.

Bioreactor set-up and the viability assessment. (A) Graphical representation of the 5mm MR compatible bioreactor optimized for maximal homogeneity. (B) Representative 31P spectra of showing unaltered bioenergetics of the UOK262 cells under study before and after hyperpolarized carbon-13 experiment.
A splitting of the lactate peak was observed for all three renal cell lines (HK-2, UMRC6, and UOK262) studied. Figure 2A (top) shows an example of the splitting of the hyperpolarized [1-13C]lactate peak (upfield peak: 183.13 ± 0.006 and downfield peak: 183.15 ± 0.006 ppm) for the UOK262 cells encapsulated in alginate microspheres at 81 seconds (time point of maximum 13C lactate signal) after the injection of hyperpolarized [1-13C]pyruvate in the MR compatible bioreactor. The lower panel in figure 2A shows the 13C carbonyl NMR signals from co-polarized HP [1-13C]pyruvate and HP [1-13C]lactate in perfused alginate microspheres devoid of UOK262 cells. The presence of a single lactate resonance demonstrates that the differences in magnetic field susceptibility of the alginate microsphere microenvironment alone is not responsible for the splitting of the hyperpolarized lactate peak, and suggests that the resonance at 183.15 ppm corresponds to extracellular lactate pool. The assignment of the downfield 183.15 resonance as arising from the extracellular lactate pool was also supported by peak line-width measurements. The LWHM for the upfield lactate resonance (4.3 ± 0.1 Hz) was significantly larger than the downfield resonance (2.5 ± 0.07 Hz), which was similar to the LWHM observed for lactate in the alginate beads without the presence of cells (2.18 ± 0.05 Hz). Based on these findings we initially assigned the up- and down-field lactate resonances as arising from intra- and extra-cellular lactate pools. The difference in chemical shift (3.92 ± 0.06 Hz) of the intra- and extra-cellular lactate resonances was reproducible within the same study as well as between studies. Although the intra- and extra-cellular lactate resonances were not baseline resolved, the resonances were sufficiently separated to be accurately fit to two Lorentzian line shapes (figure 2B).
Figure 2.

Differential compartmentalization of HP [1-13C] lactate. (A) Lower panel shows the spectrum in alginate microspheres devoid of cells, infused with copolarized [1-13C] lactate and [1-13C] pyruvate. Only one peak was observed for the [1-13C]lactate signal. While two peaks were observed in the alginate microspheres with UOK262 cells when infused with HP [1-13C] pyruvate (upper panel). The inset (2.5x) clearly shows the well resolved peaks of lactate, where the chemical shift of the downfield peak coincides with that of the signal of lactate in empty alginate microspheres. (B) Lorentzian decomposition of the 2 peaks clearly reveals the wider line width of the Lacin peak compared to the Lacex peak (downfield). (C) Plot of Lacin (blue diamonds) as a function of cell density. The x-axis represents the β-NTP concentration, which was used to quantify the viable UOK262 cells within the sensitive coil of the bioreactor.
Several studies were performed to modulate the extra- and intra- cellular lactate pools in order to confirm the chemical shift of the corresponding lactate resonances. These studies included; (a) increasing cell density within the bioreactor in order to increase intracellular lactate, (b) inhibiting the efflux of lactate in order to decrease extracellular lactate, (c) stopping media flow during the hyperpolarized MR study in order to increase extracellular lactate, and (d) quantifying the amount of non-hyperpolarized lactate in the media to correlate with extracellular hyperpolarized lactate measurements. The results of these validation studies are provided below. Although leakage of LDH from a small number of dead cells in the bioreactor is possible, this leakage did not result in a significant media LDH concentration (Supplementary Figure 2) and therefore did not confound the interpretation of the extracellular lactate pool.
In figure 2C, a linear increase in intracellular lactate resonance was demonstrated as UOK262 cell density in the bioreactor was increased. In these studies, the cell density of viable UOK262 cells within the sensitive volume of the MR coil was calculated based on the β-NTP resonance in the 31P spectra using the value of 18.6 ± 1.5 fmols of ATP/cell previously determined for the UOK262 cell line (26).
Figure 3A shows representative 13C NMR spectra of hyperpolarized [1-13C]lactate acquired from untreated (top) and DIDS treated UOK262 cells (bottom) taken at the time of maximum lactate production after injection of hyperpolarized pyruvate (dotted line in figure 3B). The corresponding plots of the dynamic (every 3 sec.) intra- and extra- cellular [1-13C]lactate spectra before and after DIDS treatment are shown in Figure 3B. There is a clear visual reduction in the extracellular HP lactate peak in the treated spectra and an associated reduction in the area under the curve for extracellular hyperpolarized lactate of the treated versus untreated UOK262 cells. Figure 3C (solid bar) quantitatively shows that there is a 64 ± 15% increase in the Lacin/Lacex pool ratio when lactate efflux was inhibited by DIDS. With DIDS inhibition, the total HP [1-13C]lactate pool also decreased by 57 ± 11% relative to untreated cells due to the inhibition of pyruvate uptake by DIDS inhibition of MCT1. This confounding change in total hyperpolarized [1-13C]lactate pool size with DIDS inhibition is eliminated by taking the Lacin/Lacex ratio which clearly demonstrates a much larger impact on the extracellular lactate pool consistent with the higher affinity of DIDS for MCT4 as compared to MCT1 (27).
Figure 3.

Differential modulation of the lactate pools. (A) Representative 13C MR spectra of hyperpolarized [1-13C]lactate acquired from untreated (top) and DIDs treated UOK262 cells acquired at the time of maximal lactate production (indicated by the dotted line in B). (B) Dynamic measurement of HP Lacex (filled circles) and Lacin (open circles) without (top panel) and with DIDS treatment (bottom panel). (C) Bar graph of the HP [1-13C]lactate peaks of UOK262 cells under different flow and treatment conditions relative to control (flow at 0.5ml/min) normalized to 100%. The bar filled with black slanted lines represent the Lacin/Lacex ratio of UOK262 cells pretreated with DIDS inhibitor for 45 minutes (n=3). The change in the ratio is significantly different (p=0.016). The grey bar denotes the Lacin/Lacex measurements after flow was stopped 15 secs post HP [1-13C] pyruvate infusion for a period of 4.25 minutes (n=3) and has a p of 0.055 as measured by students’s t-test when compared to control.
Subsequently, we compared the dynamic 13C NMR spectra of hyperpolarized [1-13C]lactate acquired from UOK262 cells using a normal constant media flow rate (0.5ml/min) to those acquired when flow was stopped 15 seconds after the infusion of hyperpolarized [1-13C]pyruvate. 15 seconds was the time required for the bolus of pyruvate to arrive in the cellular compartment of the bioreactor. Figure 3C shows that the Lacin/Lacex peak area ratio was reduced by 34 ± 6 % (p=0.055) under stop flow conditions relative to the constant media flow condition. The decrease in the Lacin/Lacex ratio was due to an increase in the extracellular lactate peak area (164 ± 74% of control) since it was no longer flowing out of the sensitive volume of the NMR coil, while the intracellular lactate peak remained relatively constant (102 ± 46% of control). Under stop-flow conditions, the total HP [1-13C]lactate pool increased by 29 ± 58% relative to the same cells under normal flow conditions, presumably due to the increased time that the [1-13C]pyruvate bolus was exposed to the cells leading to increased uptake and conversion to lactate. This confounding increase in total hyperpolarized [1-13C]lactate pool size was eliminated by using the Lacin/Lacex ratio.
Stopping the media flow did not have an impact on the viability of the UOK262 cells as determined by stable β-NTP peak area in 31P spectra acquired before and after the stoppage of media flow. The efflux of lactate and its associated proton into the media during this period of no flow resulted in a transient reduction in extracellular pH (≤ 6.8), as observed by the “yellowing” of the phenol red indicator in the media. This media was equilibrated with fresh media flowing into the cell-containing chamber, soon after the flow was turned on at the end of the hyperpolarized experiment, with the media pH returning to 7.6. There was no difference in the resonance frequency of the extracellular lactate during this transient change in media pH, suggesting that the downfield shift of extracellular lactate was not due to a more acidic extracellular pH. This is also supported by the finding that the 13C chemical shift of the carbonyl resonance of lactate decreased rather than increased with decreasing pH (0.015 ppm up-field shift going from pH 7.4 to 6.9).
Finally, for UOK262 cells grown in [3-13C]pyruvate containing media the rate of extracellular [3-13C]lactate accumulation in 2D culture was sampled serially over 8 hours and quantified by measuring the 13C satellites of the lactate methyl protons in 800 MHz 1H MR spectra. Figure 4 shows a plot of [3-13C]lactate accumulation in the media over time for untreated and DIDS treated UOK262 cells. Fitting this data demonstrated a lactate efflux of 1.34 nmols/min/million cells for the untreated UOK262 cells. In the presence of DIDS, the rate of lactate efflux was reduced by 64% to 0.48 nmols/min/million cells. This reduction in lactate efflux was similar to that observed with integrated hyperpolarized extracellular lactate signal intensity (total area under the curve over time) after treatment with DIDS (Figure 3B).
Figure 4.
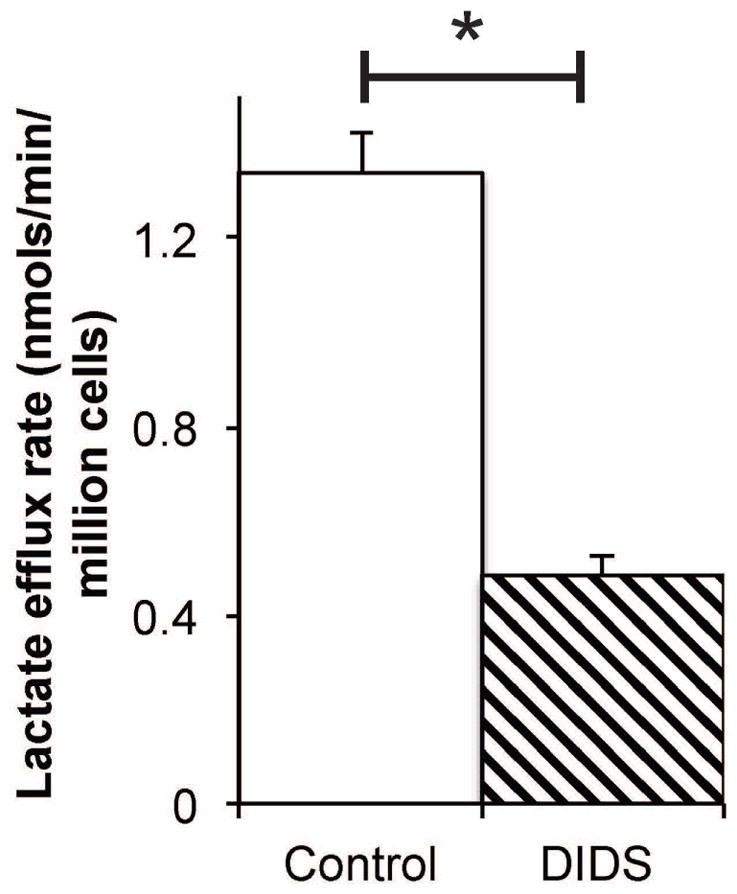
Rate of lactate efflux inhibition of UOK262 cells using non-HP MR measurements. Bar graph of [3-13C]lactate efflux rate of untreated (n = 3) and DIDS treated (slanted lines, n = 3) UOK262 cells grown in [3-13C]pyruvate containing media. The significantly decreased efflux rate (p ≤ 0.05) with DIDS treatment relative to the untreated controls is consistent with hindered lactate efflux due to MCT4 inhibition.
Taken together the results of these studies clearly demonstrate that the up- and down-field hyperpolarized [1-13C] lactate resonance were due to the intra- and extra-cellular pools of lactate.
Hyperpolarized intracellular to extracellular [1-13C]lactate ratio differentiates the varying aggressiveness of RCC cells
HP 13C MR studies were performed on 3 renal cell lines, ranging from normal renal tubule cells (HK-2), localized RCC (UMRC6), to metastatic RCC (UOK262). These cell lines were selected since they demonstrate varying intra- and extra-cellular lactate pool sizes due to their known differential MCT1, MCT4 and LDHA mRNA expression and LDH activity (26). Hyperpolarized 13C MR studies demonstrated significantly different Lacin/Lacex ratios for the three cell lines. The bar graph in figure 5A shows that the Lacin/Lacex ratio in UOK262 cells is significantly lower than that of UMRC6 as well as HK-2 cells by more than 2 and 2.5 fold. This is due to a significant increase in the HP extracellular 13C lactate fraction that comprises 38 ± 5% of the total 13C lactate pool in UOK262 cells, and was significantly greater than that for UMRC6 and HK-2 cells, at 23±4% and 17±1%, respectively. MCT4 mRNA expression (p<0.05) was significantly elevated in the UOK262 cells compared to the other cell lines (HK-2 p=0.0011, UMRC6 p=0.0171), and figure 5B shows a negative linear correlation (R2 of 0.997) of MCT4 mRNA expression and hyperpolarized Lacin/Lacex ratio for the three cell lines.
Figure 5.

Estimation of extracellular HP lactate pools in renal cells of varying phenotypes. (A) Graph of Lacin/Lacex for HK2, UMRC6 and UOK262 cell lines. The Lacin/Lacex increases going from UOK262, to UMRC6 to HK-2 (n=3 each). The metastatic UOK262 cell line had significantly (p<0.05) lower HP Lacin/Lacex ratio than both HK2 and UMRC6 cell lines. (B) Graph of HP Lacin/Lacex as a function of MCT4 mRNA expression. A negative linear correlation exists between the measured HP Lacin/Lacex ratio and the MCT4 mRNA expression in the 3 cell lines studied. All data are represented as mean ± std.error.
Measurement of Intra- and Extra- Cellular Lactate in Living Human Renal Tissue Slices
The ability of this approach to measure intra- and extra-cellular lactate was extended to living patient-derived renal tissue slices in the 5 mm MR compatible bioreactor. Five slices with approximately 88 mg of tissue (wet weight) from high-grade urothelial carcinoma were used for this study. Tissue viability, monitored using 31P, was maintained for the duration of the study (4.5 hours). Figure 6 shows the 13C spectrum of the living human tissue slice cultures (TSCs) in the 5mm bioreactor, after injection of HP [1,2-13C2]pyruvate. Both the flux to HP [1,2-13C2]Lactate and [5-13C]glutamate was observed. Similar to renal cancer cell lines, the lactate doublet (centered at 183.1ppm) was split by the intra- and extra-cellular micro-environment, with extracellular lactate resonating 3.92 Hz downfield of the intracellular pool, while only a singlet denoting the intracellular compartment was observed for the [5-13C]glutamate. The ratio of the extracellular pool of lactate to the total lactate signal (42 ± 2 %) is similar to the aggressive metastatic UOK262 cell line, indicating a similar up-regulation of MCT4 mRNA expression. There was a 3- fold increase in MCT4 mRNA expression in patient-derived renal cancer relative to normal renal tissue, and a 4 fold increase in MCT4 mRNA expression in UOK262 cells relative to normal HK2 cells.
Figure 6.
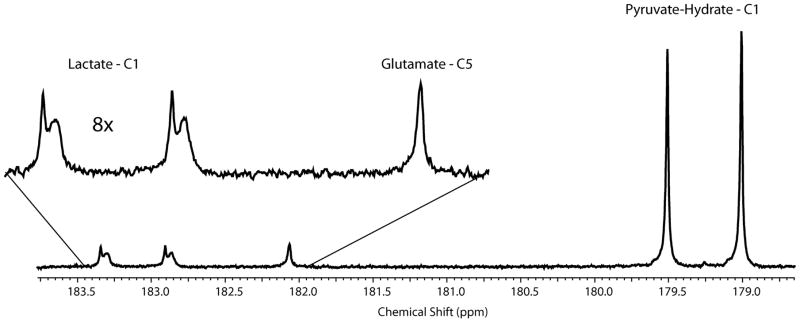
13C spectrum of HP [1,2-13C2]pyruvate metabolism of tissue slice culture. 4 tissue slices of a high-grade urothelial carcinoma were perfused in the 5mm MR compatible bioreactor. The C-1 doublet of HP [1,2-13C2]lactate from metabolism of [1,2-13C2]pyruvate, each split into two peaks represents the two cellular compartments. And only a singlet denoting the intracellular compartment is observed for the [5-13C]glutamate is seen in the spectral inset.
Discussion
In this study, intra- and extra-cellular HP 13C lactate pools were dynamically measured using a 5mm susceptibility matched MR compatible 3D cell culture bioreactor. The intra- and extra-cellular HP lactate signals could be resolved in 1D 13C spectra due to a chemical shift difference between the two resonances (0.031 ± 0.0005 ppm), which was reproducible across studies and cell lines. Although the exact origin of the downfield shift of the extra- relative to the intra-cellular lactate pool is not known, it was not due to a lower extracellular pH, since reduced extracellular pH would have resulted in an extracellular lactate chemical shift in the opposite direction. The observed difference in chemical shift could arise from differences in the bulk magnetic susceptibility or differences in hydrogen bonding between the intra- and extra-cellular microenvironments. Intra- and extra-cellular chemical shift differences, attributed in part to bulk magnetic susceptibility, have been previously reported in 1H, 19F, 31P, and 13C magic angle spinning NMR spectra of erythrocyte cell suspensions (36,37) and for intra- and extra-myocellular lipid signals in in vivo muscle spectra (38). Additionally, as observed by Kuchel et al (36,37,39–42) and further validated by Barry et al (43) protein induced differences in hydrogen bonding between the intracellular and extracellular compartment have also resulted in NMR chemical shift differences between the compartments.
The extracellular HP lactate signal was used to discriminate normal HK-2 renal epithelial cells from both RCC cell lines (UOK262, UMRC6), and more importantly to differentiate the metastatic UOK262 RCC cell line from the localized RCC cell line UMRC6. The extracellular HP lactate findings are consistent with prior steady-state labeling studies with [1-13C]glucose which demonstrated that [3-13C]lactate in the media was highest for UOK262 followed by UMRC6 and HK2 cells (26). There was also a robust linear correlation between the MCT4 mRNA expression of the three cell lines and hyperpolarized Lacin/Lacex ratio, which is due to significant changes in the extracellular lactate pool size. This finding is consistent with the up-regulation of aerobic glycolysis and lactate production and efflux associated with a more aggressive, metastatic cancer phenotype (9). The observed increased lactate efflux is known to be facilitated by an overexpression of MCT4 (monocarboxylate transporters) (27,28). It has been shown in numerous cancers, including cervical cancer (44), prostate cancer (45), lung cancer (46) and clear cell RCC (47), that MCT4 up-regulation correlates with aggressive, invasive behavior. The MCT4 transporter serves two important functions; 1) the export of lactate to maintain a high rate of glycolysis and 2) removal of protons to maintain alkaline intracellular pH. 31P NMR measurements in this study demonstrated a constant alkaline intracellular pH for both of the RCC cell lines consistent with the ability of cells to maintain a constant intracellular pH regardless of the degree of lactate production. While the cancer cell lines produced and transported more lactate out of the cell, the normal renal cell line also produced and transported a substantial amount of lactate. The relatively high level of extra-cellular HP lactate signal observed in the HK-2 cells could be due both to a metabolic aberration associated with immortalization of the normal renal epithelium, and/or the fact that normal human kidney cortex cells also express substantial MCT4 (48) which is key to the lactate shuttle between the cortex and the medulla (49).
Considering the important function that MCT4 plays in maintaining the glycolytic tumor phenotype and alkaline intracellular pH, MCT4 inhibition has been considered as a therapeutic target (3,50), and this paper demonstrates that the MR compatible bioreactor platform can be used to monitor such a therapeutic approach in real-time. The inhibition of lactate efflux by DIDS resulted in a significant reduction of the extracellular HP lactate pool in the aggressive metastatic UOK262 cell line. However, there was also a small reduction of the intracellular HP lactate pool that is consistent with DIDS’s ability to bind and inhibit both MCT1 and 4 transporters although with different affinities. Consistent with the higher affinity of DIDS for MCT4 as compared to MCT1 (27), the observed significant increase in the Lacin/Lacex ratio was primarily due to a reduction in the in Lacex pool.
The results of these studies demonstrate the importance of lactate efflux as a biomarker of cancer presence and metastatic potential and the utility of the MR compatible 3D cell and tissue culture bioreactor as a platform capable of studying not only cellular metabolism, but also transport and the impact of therapeutic interventions. The extension of these studies to living patient-derived human renal cancer tissue slices was also demonstrated. Recent 1H and HP 13C MR studies of 3D patient derived tissue slice cultures in a MR compatible bioreactor have demonstrated that they provide a more realistic model of the human situation for metabolic investigation (24). In this study we were able to observe the intra- and extra-cellular lactate pools using five 300 μm × 8 mm slices (≈ 88 mg) of renal cancer obtained at surgery, after injection of HP [1,2-13C2]pyruvate. The use of the doubly-labeled pyruvate allowed the measurement of flux to both HP [1,2-13C2]Lactate and [5-13C]glutamate. Interestingly, the downfield shift of the extracellular lactate resonance was identical to that observed for the renal cells, and the ratio of the extracellular pool of lactate to the total lactate signal was very similar to what was observed for the UOK262 cell line. This finding was consistent with over-expression of MCT4 in both RCC tissues and cells. The MCT4 mRNA expression in patient derived renal cancer tissue slices was ≈ 3 fold higher than normal renal tissue, similar to the fold increase (4 fold higher) in MCT4 mRNA expression in UOK262 cells relative to the normal HK2 cells. Only a single resonance was observed HP [5-13C]glutamate which arises from the C-2 carbon of HP [1,2-13C2]pyruvate in the TCA cycle. This finding is consistent with glutamate being predominately intracellular (51,52), and demonstrates that this technique can be used to study the compartmentalization of metabolites other than lactate. The practicality of acquiring localized HP 13C MR kinetic data opens the possibility of measuring metabolic fluxes by fitting the dynamic data to kinetic models (15,53,54). However, the modeling of metabolic fluxes from HP 13C MR data is still in its infancy and current approaches suffer from a number of factors, including assumed/estimated T1’s, unknown metabolite pool sizes, and the assumptions underlying the specific models used. Therefore the ability to measure metabolite pool sizes and estimate their respective T1’s in the very controlled environment of a 3D MR compatible bioreactor could aid in calculating and interpreting in vivo metabolic fluxes measured by HP 13C MR.
Although there are a number of ways to measure extracellular lactate in vitro, only 2 of those techniques can be applied for in vivo measurements, namely steady state MR spectroscopic and microelectrode measurements. Diffusion weighted 1H and 1H-13C(proton observed carbon-edited) spectroscopy approaches have previously been used to assess the compartmentalization of the lactate in the rat brain in vivo, but these measurements are limited by poor signal-to-noise requiring long acquisition times for single time point, single voxel measurements (56,57) and therefore unable to provide dynamic measurements of lactate efflux as is achievable for cells and tissues in the MR compatible bioreactor. While the microelectrode technique can yield dynamic measurements, it lacks specific localization, and is invasive (55). In contrast, dynamic hyperpolarized MR technique can estimate in real time the rate of lactate export from the cell and help distinguish between localized and metastatic cancer cells as demonstrated. Hyperpolarized 13C MR has already been applied to patient studies, thereby demonstrating future applicability to in vivo measurements (13). The small difference in chemical shift between the extra- and intra-cellular lactate resonance observed in our ex vivo studies will be difficult to resolve in vivo. However, the results of such ex vivo studies can be used to help interpret the results of in vivo diffusion weighted HP 13C MR studies in pre-clinical animal models (22,58), as well as future patient studies (20). This platform also could provide a rapid and inexpensive way to test efficacy of drugs that target cellular metabolism and transport.
Supplementary Material
Acknowledgments
Grant Sponsor: National Institutes of Health (R01 EB013427, R01 EB017449, R01 CA183071, P41 EB013598, R21 EB005363, R00 EB014328 and R01 CA166655) and Department of Defense (USAMRMC CA110032)
We thank Bertram Koelsch, Dave Korenchen, Sukumar Subramaniam, Justin Delos Santos, Romelyn Delos Santos and Jessie Lee for assistance in performing experiments.
qRT-PCR analysis was conducted at the Genome Analysis Core Facility, Helen Diller Family Comprehensive Cancer Center, University of California, San Francisco
Abbreviations used
- HP
hyperpolarized
- MR
magnetic resonance
- MRS
magnetic resonance spectroscopy
- DNP
dynamic nuclear polarization
- RCC
renal cell carcinoma
- VEGF
vascular endothelial growth factor
- DMEM
Dulbeco’s Modified Eagle’s medium
- DIDS
4,4′-diisothiocyanostilbene-2,2′-disulfonic acid
- ATP
adenosine tri-phosphate
- MCT
monocarboxylate transporter
- LDH
lactate dehydrogenase
- TCA
tricarboxylic acid
- Lacin
intracellular lactate
- Lacex
extracellular lactate
- Lactot
total lactate
- S/N
signal to noise ratio
- DMSO
dimethyl sulfoxide
- LWHM
Line width at half maximum
References
- 1.Hirschhaeuser F, Sattler UGA, Mueller-Klieser W. Lactate: a metabolic key player in cancer. Cancer Research. 2011;71:6921–6925. doi: 10.1158/0008-5472.CAN-11-1457. [DOI] [PubMed] [Google Scholar]
- 2.Feron O. Pyruvate into lactate and back: from the Warburg effect to symbiotic energy fuel exchange in cancer cells. Radiother Oncol. 2009;92:329–333. doi: 10.1016/j.radonc.2009.06.025. [DOI] [PubMed] [Google Scholar]
- 3.Parks SK, Chiche J, Pouysségur J. Disrupting proton dynamics and energy metabolism for cancer therapy. Nat Rev Cancer Nature Publishing Group. 2013;13:611–623. doi: 10.1038/nrc3579. [DOI] [PubMed] [Google Scholar]
- 4.Estrella V, Chen T, Lloyd M, Wojtkowiak J, Cornnell HH, Ibrahim-Hashim A, Bailey K, Balagurunathan Y, Rothberg JM, Sloane BF, Johnson J, Gatenby RA, Gillies RJ. Acidity generated by the tumor microenvironment drives local invasion. Cancer Research. 2013;73:1524–1535. doi: 10.1158/0008-5472.CAN-12-2796. [DOI] [PMC free article] [PubMed] [Google Scholar]
- 5.Gatenby RA, Gawlinski ET, Gmitro AF, Kaylor B, Gillies RJ. Acid-mediated tumor invasion: a multidisciplinary study. Cancer Research. 2006;66:5216–5223. doi: 10.1158/0008-5472.CAN-05-4193. 2006 ed. [DOI] [PubMed] [Google Scholar]
- 6.Fukumura D, Xu L, Chen Y, Gohongi T, Seed B, Jain RK. Hypoxia and acidosis independently up-regulate vascular endothelial growth factor transcription in brain tumors in vivo. Cancer Research. 2001;61:6020–6024. [PubMed] [Google Scholar]
- 7.Lardner A. The effects of extracellular pH on immune function. J Leukoc Biol. 2001;69:522–530. [PubMed] [Google Scholar]
- 8.McCarty MF, Whitaker J. Manipulating tumor acidification as a cancer treatment strategy. Altern Med Rev. 2010;15:264–272. [PubMed] [Google Scholar]
- 9.Dhup S, Kumar Dadhich R, Ettore Porporato P, Sonveaux P. Multiple Biological Activities of Lactic Acid in Cancer: Influences on Tumor Growth, Angiogenesis and Metastasis. Curr Pharm Des Bentham Science Publishers. 2012;18:1319–1330. doi: 10.2174/138161212799504902. [DOI] [PubMed] [Google Scholar]
- 10.Coller HA. Is Cancer a Metabolic Disease? The American Journal of Pathology. 2014;184:4–17. doi: 10.1016/j.ajpath.2013.07.035. [DOI] [PMC free article] [PubMed] [Google Scholar]
- 11.Keshari KR, Wilson DM. Chemistry and biochemistry of 13C hyperpolarized magnetic resonance using dynamic nuclear polarization. Chem Soc Rev The Royal Society of Chemistry. 2014;43:1627–1659. doi: 10.1039/c3cs60124b. [DOI] [PMC free article] [PubMed] [Google Scholar]
- 12.Kurhanewicz J, Vigneron DB, Brindle K, Chekmenev EY, Comment A, Cunningham CH, DeBerardinis RJ, Green GG, Leach MO, Rajan SS, Rizi RR, Ross BD, Warren WS, Malloy CR. Analysis of cancer metabolism by imaging hyperpolarized nuclei: prospects for translation to clinical research. Neoplasia. 2011;13:81–97. doi: 10.1593/neo.101102. [DOI] [PMC free article] [PubMed] [Google Scholar]
- 13.Nelson SJ, Kurhanewicz J, Vigneron DB, Larson PEZ, Harzstark AL, Ferrone M, Van Criekinge M, Chang JW, Bok R, Park I, Reed G, Carvajal L, Small EJ, Munster P, Weinberg VK, Ardenkjaer-Larsen JH, Chen AP, Hurd RE, Odegardstuen L-I, Robb FJ, Tropp J, Murray JA. Metabolic Imaging of Patients with Prostate Cancer Using Hyperpolarized [1–13C]Pyruvate. Sci Transl Med. 2013;5:198ra108. doi: 10.1126/scitranslmed.3006070. [DOI] [PMC free article] [PubMed] [Google Scholar]
- 14.Chen AP, Albers MJ, Cunningham CH, Kohler SJ, Yen YF, Hurd RE, Tropp J, Bok R, Pauly JM, Nelson SJ, Kurhanewicz J, Vigneron DB. Hyperpolarized C-13 spectroscopic imaging of the TRAMP mouse at 3T-initial experience. Magn Reson Med. 2007;58:1099–1106. doi: 10.1002/mrm.21256. 2007 ed. [DOI] [PubMed] [Google Scholar]
- 15.Albers MJ, Bok R, Chen AP, Cunningham CH, Zierhut ML, Zhang VY, Kohler SJ, Tropp J, Hurd RE, Yen Y-F, Nelson SJ, Vigneron DB, Kurhanewicz J. Hyperpolarized 13C lactate, pyruvate, and alanine: noninvasive biomarkers for prostate cancer detection and grading. Cancer Research. 2008;68:8607–8615. doi: 10.1158/0008-5472.CAN-08-0749. [DOI] [PMC free article] [PubMed] [Google Scholar]
- 16.Chen AP, Chu W, Gu Y-P, Cunnhingham CH. Probing Early Tumor Response to Radiation Therapy Using Hyperpolarized [1-(13)C]pyruvate in MDA-MB-231 Xenografts. PLoS ONE. 2013;8:e56551. doi: 10.1371/journal.pone.0056551. [DOI] [PMC free article] [PubMed] [Google Scholar]
- 17.Brindle K. New approaches for imaging tumour responses to treatment. Nature Rev Cancer. 2008;8:1–14. doi: 10.1038/nrc2289. [DOI] [PubMed] [Google Scholar]
- 18.Park I, Bok R, Ozawa T, Phillips JJ, James CD, Vigneron DB, Ronen SM, Nelson SJ. Detection of early response to temozolomide treatment in brain tumors using hyperpolarized 13C MR metabolic imaging. J Magn Reson Imaging. 2011;33:1284–1290. doi: 10.1002/jmri.22563. [DOI] [PMC free article] [PubMed] [Google Scholar]
- 19.Chaumeil MM, Ozawa T, Park I, Scott K, James CD, Nelson SJ, Ronen SM. Hyperpolarized (13)C MR spectroscopic imaging can be used to monitor Everolimus treatment in vivo in an orthotopic rodent model of glioblastoma. Neuroimage. 2012;59:193–201. doi: 10.1016/j.neuroimage.2011.07.034. 2011 ed. [DOI] [PMC free article] [PubMed] [Google Scholar]
- 20.Koelsch BL, Reed GD, Keshari KR, Chaumeil MM, Bok R, Ronen SM, Vigneron DB, Kurhanewicz J, Larson PEZ. Rapid in vivo apparent diffusion coefficient mapping of hyperpolarized 13C metabolites. Magn Reson Med. 2014:n/a–n/a. doi: 10.1002/mrm.25422. [DOI] [PMC free article] [PubMed] [Google Scholar]
- 21.Schilling F, Düwel S, Köllisch U, Durst M, Schulte RF, Glaser SJ, Haase A, Otto AM, Menzel MI. Diffusion of hyperpolarized 13C-metabolites in tumor cell spheroids using real-time NMR spectroscopy. NMR Biomed. 2012:n/a–n/a. doi: 10.1002/nbm.2892. [DOI] [PubMed] [Google Scholar]
- 22.Søgaard LV, Schilling F, Janich MA, Menzel MI, Ardenkjaer-Larsen JH. In vivomeasurement of apparent diffusion coefficients of hyperpolarized 13C-labeled metabolites. NMR Biomed. 2014;27:561–569. doi: 10.1002/nbm.3093. [DOI] [PubMed] [Google Scholar]
- 23.Keshari KR, Kurhanewicz J, Jeffries RE, Wilson DM, Dewar BJ, Van Criekinge M, Zierhut M, Vigneron DB, Macdonald JM. Hyperpolarized 13C spectroscopy and an NMR-compatible bioreactor system for the investigation of real-time cellular metabolism. Magn Reson Med. 2010;63:322–329. doi: 10.1002/mrm.22225. [DOI] [PMC free article] [PubMed] [Google Scholar]
- 24.Keshari KR, Sriram R, Van Criekinge M, Wilson DM, Wang ZJ, Vigneron DB, Peehl DM, Kurhanewicz J. Metabolic reprogramming and validation of hyperpolarized 13C lactate as a prostate cancer biomarker using a human prostate tissue slice culture bioreactor. Prostate. 2013;73:1171–1181. doi: 10.1002/pros.22665. [DOI] [PMC free article] [PubMed] [Google Scholar]
- 25.Keshari KR, Van Criekinge M, Wilson DM, Wang ZJ, Koelsch BL, Sriram R, VanBrocklin HF, Kurhanewicz J. Hyperpolarized MR/PET compatible bioreactor for mulit-modality investigation of metabolism in malignant cells and primary tissues [Internet]. WMIS Conference Proceedings; [cited 2014 Jul 17]. Available from: http://www.wmis.org/abstracts/2013/data/papers/SS137.htm. [Google Scholar]
- 26.Keshari KR, Sriram R, Koelsch BL, Van Criekinge M, Wilson DM, Kurhanewicz J, Wang ZJ. Hyperpolarized 13C-pyruvate magnetic resonance reveals rapid lactate export in metastatic renal cell carcinomas. Cancer Research. 2013;73:529–538. doi: 10.1158/0008-5472.CAN-12-3461. [DOI] [PMC free article] [PubMed] [Google Scholar]
- 27.Dimmer KS, Friedrich B, Lang F, Deitmer JW, Bröer S. The low-affinity monocarboxylate transporter MCT4 is adapted to the export of lactate in highly glycolytic cells. Biochem J. 2000;350(Pt 1):219–227. [PMC free article] [PubMed] [Google Scholar]
- 28.Carpenter L, Halestrap AP. The kinetics, substrate and inhibitor specificity of the lactate transporter of Ehrlich-Lettre tumour cells studied with the intracellular pH indicator BCECF. Biochem J. 1994;304 ( Pt 3):751–760. doi: 10.1042/bj3040751. [DOI] [PMC free article] [PubMed] [Google Scholar]
- 29.Ryan MJ, Johnson G, Kirk J, Fuerstenberg SM, Zager RA, Torok-Storb B. HK-2: An immortalized proximal tubule epithelial cell line from normal adult human kidney. Kidney Int. 1994;45:48–57. doi: 10.1038/ki.1994.6. [DOI] [PubMed] [Google Scholar]
- 30.Grossman HB, Wedemeyer G, Ren LQ. Human renal carcinoma: characterization of five new cell lines. J Surg Oncol. 1985;28:237–244. doi: 10.1002/jso.2930280320. [DOI] [PubMed] [Google Scholar]
- 31.Albers MJ, Butler TN, Rahwa I, Bao N, Keshari KR, Swanson MG, Kurhanewicz J. Evaluation of the ERETIC method as an improved quantitative reference for 1H HR-MAS spectroscopy of prostate tissue. Magn Reson Med. 2009;61:525–532. doi: 10.1002/mrm.21808. [DOI] [PMC free article] [PubMed] [Google Scholar]
- 32.Adam WR, Koretsky AP, Weiner MW. 31P-NMR in vivo measurement of renal intracellular pH: effects of acidosis and K+ depletion in rats. doi: 10.1152/ajprenal.1986.251.5.F904. [DOI] [PubMed] [Google Scholar]
- 33.Lutz NW, Franks SE, Frank MH, Pomer S, Hull WE. Investigation of multidrug resistance in cultured human renal cell carcinoma cells by 31P-NMR spectroscopy and treatment survival assays. MAGMA. 2005;18:144–161. doi: 10.1007/s10334-005-0107-7. [DOI] [PubMed] [Google Scholar]
- 34.Thong AE, Zhao H, Ingels A, Valta MP, Nolley R, Santos J, Young SR, Peehl DM. Tissue slice grafts of human renal cell carcinoma: An authentic preclinical model with high engraftment rate and metastatic potential. Urologic Oncology: Seminars and Original Investigations. 2013 doi: 10.1016/j.urolonc.2013.05.008. [DOI] [PMC free article] [PubMed] [Google Scholar]
- 35.Wirthensohn G, Guder WG. Renal substrate metabolism. Physiol Rev. 1986;66:469–497. doi: 10.1152/physrev.1986.66.2.469. [DOI] [PubMed] [Google Scholar]
- 36.Philp DJ, Bubb WA, Kuchel PW. Chemical shift and magnetic susceptibility contributions to the separation of intracellular and supernatant resonances in variable angle spinning NMR spectra of erythrocyte suspensions. Magn Reson Med Wiley Online Library. 2004;51:441–444. doi: 10.1002/mrm.20019. [DOI] [PubMed] [Google Scholar]
- 37.Kuchel PW, CHAPMAN BE, XU ASL. Rates of anion transfer across erythrocyte membranes measured with NMR spectroscopy. Progress in Cell Research. 1992:105–119. [Google Scholar]
- 38.Boesch C, Kreis R. Dipolar coupling and ordering effects observed in magnetic resonance spectra of skeletal muscle. NMR Biomed. 2001;14:140–148. doi: 10.1002/nbm.684. [DOI] [PubMed] [Google Scholar]
- 39.Kirk K, Kuchel PW. Physical basis of the effect of hemoglobin on the phosphorus-31 NMR chemical shifts of various phosphoryl compounds. Biochemistry American Chemical Society. 1988;27:8803–8810. doi: 10.1021/bi00424a017. [DOI] [PubMed] [Google Scholar]
- 40.Kuchel PW. Spin-exchange NMR spectroscopy in studies of the kinetics of enzymes and membrane transport. NMR Biomed. 1990;3:102–119. doi: 10.1002/nbm.1940030303. [DOI] [PubMed] [Google Scholar]
- 41.Potts JR, Hounslow AM, Kuchel PW. Exchange of fluorinated glucose across the red-cell membrane measured by 19F-n.m.r. magnetization transfer. Biochem J. 1990;266:925–928. [PMC free article] [PubMed] [Google Scholar]
- 42.Larkin TJ, Bubb WA, Kuchel PW. pH and Cell Volume Effects on H2O and Phosphoryl Resonance Splitting in Rapid-Spinning NMR of Red Cells. Biophysical Journal. 2007;92:1770–1776. doi: 10.1529/biophysj.106.096149. [DOI] [PMC free article] [PubMed] [Google Scholar]
- 43.Barry JA, McGovern KA, Lien YH, Ashmore B, Gillies RJ. Dimethyl methylphosphonate (DMMP): a 31P nuclear magnetic resonance spectroscopic probe of intracellular volume in mammalian cell cultures. Biochemistry. 1993;32:4665–4670. doi: 10.1021/bi00068a026. [DOI] [PubMed] [Google Scholar]
- 44.Pinheiro C, Longatto-Filho A, Pereira SMM, Etlinger D, Moreira MAR, Jubé LF, Queiroz GS, Schmitt F, Baltazar F. Monocarboxylate transporters 1 and 4 are associated with CD147 in cervical carcinoma. Disease Markers. 2009;26:97–103. doi: 10.3233/DMA-2009-0596. [DOI] [PMC free article] [PubMed] [Google Scholar]
- 45.Pinheiro C, Longatto-Filho A, Azevedo-Silva J, Casal M, Schmitt FC, Baltazar F. Role of monocarboxylate transporters in human cancers: state of the art. J Bioenerg Biomembr Springer US. 2012;44:127–139. doi: 10.1007/s10863-012-9428-1. [DOI] [PubMed] [Google Scholar]
- 46.Meijer T, Schuurbiers O, Kaanders J. Differences in metabolism between adeno-and squamous cell non-small cell lung carcinomas: spatial distribution and prognostic value of GLUT1 and MCT4. Lung Cancer. 2012 doi: 10.1016/j.lungcan.2011.11.006. [DOI] [PubMed] [Google Scholar]
- 47.Gerlinger M, Santos CR, Spencer-Dene B, Martinez P, Endesfelder D, Burrell RA, Vetter M, Jiang M, Saunders RE, Kelly G, Dykema K, Rioux-Leclercq N, Stamp G, Patard J-J, Larkin J, Howell M, Swanton C. Genome-wide RNA interference analysis of renal carcinoma survival regulators identifies MCT4 as a Warburg effect metabolic target. J Pathol Blackwell Publishing. 2012;227:146–156. doi: 10.1002/path.4006. [DOI] [PMC free article] [PubMed] [Google Scholar]
- 48.Wang Q, Lu Y, Yuan M, Darling IM, Repasky EA, Morris ME. Characterization of monocarboxylate transport in human kidney HK-2 cells. Mol Pharm. 2006;3:675–685. doi: 10.1021/mp060037b. [DOI] [PubMed] [Google Scholar]
- 49.Bellomo R. Bench-to-bedside review: Lactate and the kidney. Critical Care BioMed Central. 2002;6:322. doi: 10.1186/cc1518. [DOI] [PMC free article] [PubMed] [Google Scholar]
- 50.Kennedy KM, Dewhirst MW. Tumor metabolism of lactate: the influence and therapeutic potential for MCT and CD147 regulation. Future Oncol. 2010;6:127–148. doi: 10.2217/fon.09.145. [DOI] [PMC free article] [PubMed] [Google Scholar]
- 51.Gegelashvili G, Schousboe A. Cellular distribution and kinetic properties of high-affinity glutamate transporters. Brain research bulletin Elsevier. 1998;45:233–238. doi: 10.1016/s0361-9230(97)00417-6. [DOI] [PubMed] [Google Scholar]
- 52.Danbolt NC. Glutamate uptake. Progress in Neurobiology. 2001;65:1–105. doi: 10.1016/s0301-0082(00)00067-8. [DOI] [PubMed] [Google Scholar]
- 53.Lee P, Leong W, Tan T, Lim M, Han W, Radda GK. In Vivo hyperpolarized carbon-13 magnetic resonance spectroscopy reveals increased pyruvate carboxylase flux in an insulin-resistant mouse model. Hepatology. 2013;57:515–524. doi: 10.1002/hep.26028. [DOI] [PubMed] [Google Scholar]
- 54.Zierhut ML, Yen Y-F, Chen AP, Bok R, Albers MJ, Zhang V, Tropp J, Park I, Vigneron DB, Kurhanewicz J, Hurd RE, Nelson SJ. Kinetic modeling of hyperpolarized 13C1-pyruvate metabolism in normal rats and TRAMP mice. J Magn Reson. 2010;202:85–92. doi: 10.1016/j.jmr.2009.10.003. [DOI] [PMC free article] [PubMed] [Google Scholar]
- 55.Rassaei L, Olthuis W, Tsujimura S, Sudhölter EJR, van den Berg A. Lactate biosensors: current status and outlook. Anal Bioanal Chem. 2014;406:123–137. doi: 10.1007/s00216-013-7307-1. [DOI] [PubMed] [Google Scholar]
- 56.Pfeuffer J, Tkác I, Gruetter R. Extracellular-intracellular distribution of glucose and lactate in the rat brain assessed noninvasively by diffusion-weighted 1H nuclear magnetic resonance spectroscopy in vivo. J Cereb Blood Flow Metab. 2000;20:736–746. doi: 10.1097/00004647-200004000-00011. [DOI] [PubMed] [Google Scholar]
- 57.Pfeuffer J, Lin JC, Delabarre L, Uğurbil K, Garwood M. Detection of intracellular lactate with localized diffusion {1H-13C}-spectroscopy in rat glioma in vivo. J Magn Reson. 2005;177:129–138. doi: 10.1016/j.jmr.2005.07.010. [DOI] [PubMed] [Google Scholar]
- 58.Patrick PS, Kettunen MI, Tee SS, Rodrigues TB, Serrao E, Timm KN, McGuire S, Brindle KM. Detection of transgene expression using hyperpolarized (13) C urea and diffusion-weighted magnetic resonance spectroscopy. Magn Reson Med. 2014 doi: 10.1002/mrm.25254. [DOI] [PubMed] [Google Scholar]
Associated Data
This section collects any data citations, data availability statements, or supplementary materials included in this article.