

Abstract
The “Warburg effect” describes a peculiar metabolic feature of many solid tumors, namely their high glycolytic activity for biosynthesis and an inefficient generation of ATP. During aerobic glycolysis, pyruvate is preferentially metabolized to lactate by the enzyme lactate dehydrogenase-A (LDH-A), suggesting a possible vulnerability at this target for small molecule inhibition in cancer cells. In this study, we used FX11, a small molecule inhibitor of LDH-A, to investigate this possible vulnerability in a panel of 15 patient-derived mouse xenograft (PDX) models of pancreatic cancer. Unexpectedly, the p53 status of the PDX tumor determined the response to FX11. Tumors harboring wild-type (WT) TP53 were completely resistant to FX11. In contrast, tumors harboring mutant TP53 exhibited increased apoptosis, reduced proliferation indices and attenuated tumor growth when exposed to FX11. [18F]-FDG PET-CT scans revealed a relative increase in glucose uptake in mutant TP53 versus WT TP53 tumors, with FX11 administration downregulating metabolic activity only in mutant TP53 tumors. Through a non-invasive quantitative assessment of lactate production, as determined by 13C magnetic resonance spectroscopy (MRS) of hyperpolarized pyruvate, we confirmed that FX11 administration inhibited pyruvate-to-lactate conversion only in mutant TP53 tumors, a feature associated with reduced expression of the TP53 target gene TIGAR, which is known to regulate glycolysis. Taken together, our findings highlight p53 status in pancreatic cancer as biomarker to predict sensitivity to LDH-A inhibition, with regard to both real-time non-invasive imaging by 13C MRS as well as therapeutic response.
INTRODUCTION
Pancreatic ductal adenocarcinoma (PDAC) is the fourth most common cause of cancer-related mortality in the United States, with an alarming rise in incidence and a projection that it will become the second most common cause of cancer deaths by 2030 (1). The 5-year survival rate of patients with advanced PDAC is <5%, which remained largely unchanged over the last four decades. The current treatment options for advanced PDAC include the multi-drug regimen FOLFIRINOX, or the combination of nab-paclitaxel plus gemcitabine (2). However, neither therapy is curative, providing a median survival of 11 and 8.5 months, respectively. The dismal prognosis of PDAC patients underscores the urgent need to identify novel therapeutic targets that exploit the underlying mechanistic vulnerabilities in cancer cells.
Reprogramming of cellular metabolism is one of the hallmarks of cancer (3). A critical aberration in metabolism that occurs in cancer cells is reflected in altered glucose metabolism. In normal tissues, lactate generation through glycolysis, and the resulting inefficient ATP production, is limited to anaerobic conditions, while pyruvate typically feeds into mitochondrial oxidative phosphorylation (OXPHOS) when adequate oxygen levels are present. In contrast, cancer cells preferentially convert glucose into lactate through glycolysis, even under normal oxygen concentrations, a phenomenon termed “aerobic glycolysis” or the Warburg effect (4,5). The enzyme lactate dehydrogenase-A (LDH-A) is involved in the conversion of pyruvate into lactate, utilizing NADH as a cofactor. By converting pyruvate to lactate, LDH-A regenerates the NAD+ needed to maintain glycolysis and diverts pyruvate from being converted to acetyl-CoA for oxidative phosphorylation (6). Aerobic glycolysis provides bioenergetic intermediates and generates ATP, while simultaneously suppressing excessive reactive oxygen species (ROS) production. The lactate produced by cancer cells acidifies the extracellular microenvironment, promoting invasion and metastases, reduced drug efficacy through ion tapping and evading immune recognition (7–9). The increase in glycolytic flux is a metabolic strategy of tumor cells to ensure survival and growth in nutrient-deprived environments (10).
LDH-A is up-regulated by various oncogenic transcription factors, such as HIF-1α and c-Myc, in cancers (11). Conversely, it has been documented that reduction of fermentative glycolysis through LDH-A blockade results in the inhibition of tumor growth and metastases in various preclinical models, implicating LDH-A as a viable therapeutic target (12–17). Blockade of LDH-A activity with the pharmacological inhibitor FX11 attenuates tumor progression across various preclinical models, including in PDAC cell lines (18). Given the expanding portfolio of pharmacological inhibitors that target aberrant cancer metabolism (19,20), it is imperative that molecular determinants of sensitivity and resistance to these inhibitors be identified, and further, clinically feasible assays that can provide insights into in vivo response in real-time be developed. In this study, we demonstrate that PDAC tumors are responsive to FX11 treatment in a TP53-dependent manner. We further demonstrate that 13C magnetic resonance spectroscopy (MRS) using hyperpolarized pyruvate provides a biochemically specific and clinically feasible approach for predicting in vivo response to LDH-A inhibition.
MATERIALS AND METHODS
Patient-derived PDAC xenografts (PDXs)
All animal experiments were performed in accordance with the guidelines for the Care and Use of Laboratory Animals and were approved by the Institutional Animal Care and Use Committee (IACUC) of Johns Hopkins University and the University of South Florida. Male nu/nu athymic mice (Harlan) were used for the study. Animals were maintained under pathogen-free conditions and a 12-hour light/12-hour dark cycle. Fresh PDAC specimens resected from patients at the time of surgery were implanted subcutaneously (s.c.) into the flanks of 6-week-old mice, as previously described (21,22). Grafted tumors were subsequently transplanted from mouse to mouse and maintained as a live PDX Bank in Johns Hopkins University, Baltimore as per the guidelines of Institutional Review Board–approved protocol.
In vivo efficacy of the LDH-A antagonist FX11 in patient-derived PDAC xenografts
Fifteen individual patient-derived PDAC xenografts were used for the FX11 study. The mutational status of common driver genes in PDAC has been previously described for these PDXs (23). Briefly, subcutaneously established tumors were harvested at the exponential growth phase, and were cut aseptically into cubes of 1–2 mm3. The tumor pieces were dipped in matrigel and implanted on both flanks of 6-week-old male nu/nu athymic mice (Harlan). When cohorts of tumors reached ~200 mm3, mice (5 mice/group; 8–10 tumors in each arm) were randomly assigned to 1) Control (vehicle) and 2) FX11 (2.2 mg/kg), injected intraperitoneally, once daily for 4 weeks. Tumors were measured twice per week using a digital caliper, allowing discrimiation of size modifications >0.1 μmm. Individual tumor volumes were calculated using the formula: tumor volume V = a × b2/2, where a being the largest dimension of the tumor, b the smallest.
Effect of FX11 treatment on Tumor cell proliferation and apoptosis
Excised tumors from the vehicle and FX11 treatment (harvested from the 28 day efficacy study) were fixed in 10% neutral buffered formalin and processed into paraffin blocks. Sections were deparaffinized in xylene and rehydrated in graded-alcohol washes. H&E staining was performed using standard procedure. The assessment of cellular proliferation was conducted using an anti-MIB-1 (Ki-67) antibody (clone K2, dilution 1:100, Ventana Medical Systems). Immunohistochemical detection of apoptosis was performed using Terminal deoxynucleotidyl transferase-mediated dUTP nick end labeling (TUNEL) assay with a commercial apoptosis detection kit (DeadEnd Fluorometric TUNEL System; Promega), according to the recommendations of the manufacturer. Stained sections were examined under light microscope and images were captured. Histograms for TUNEL and Ki-67 staining were generated by evaluating five high power fields of tumor section from two independent tumors per treatment arms (24).
TP53-induced glycolysis regulator (TIGAR) and p53 Immunohistochemistry
Anti-TIGAR and anti-p53 antibodies (rabbit polyclonal to TIGAR, abcam, ab37910 and rabbit polyclonal to p53, abcam, ab4060) were used for TIGAR and p53 IHC, respectively. The staining was performed as per manufacture’s protocol. Briefly, formalin fixed, paraffin embedded sections were deparaffinized and subjected to heat mediated antigen retrieval in citrate buffer prior to blocking in 10% serum for 1 hour at room temperature. The primary antibodies were diluted at 1/400 (TIGAR) and 1/100 (p53) and incubated with the sample for 1 hour at room temperature for TIGAR and 12 hours at 4°C for p53. A biotinylated goat anti-rabbit antibody was used as the secondary antibody (25,26). Stained sections were examined microscopically at 40× magnification and images were captured. The neoplastic areas were examined for staining and were graded according to the prevalence of both nuclear and cytoplasmic staining within the tumor. We used a 0 to 3 scale for staining intensity: 0, completely negative; 1, weak staining; 2, moderate staining; 3, strong staining (27). The staining was scored by evaluating sections from two separate tumors each from P420, JH033, P286, JH024, P253, P410, P194 and JH015.
Expression of human TIGAR transcripts in PDAC xenografts
Baseline TIGAR expression was determined in frozen tumors of two xenografts each with TP53 wild type and TP53 mutant status. Total RNA was extracted using RNeasy Mini Kit (Qiagen), cDNA was synthesized with SuperScript First Strand System (Invitrogen), and qRT-PCR for huTIGAR expression was conducted using FAST SYBR Green Master Mix (Applied Biosystems) on a Step One Plus Real-Time PCR System (Applied Biosystems). Human PGK1 and murine β-actin were used as housekeeping genes. The primer sequences used for huTIGAR are Forward 5′-ATGGAATTTTGGAGAGAA-3′ Reverse 5′-CCATGGCCCTCAGCTCAC-3′ (28). Relative expression of the mRNA was estimated using the 2−ΔΔCT method.
FDG-PET imaging of PDAC xenografts
[18F]-FDG-PET imaging was used to determine the baseline glucose uptake and the impact of FX11 therapy. Tumor bearing mice (N=5 each) from two PDX models - JH024 (TP53 wild type) and JH015 (TP53 mutant) were used for the study. Tumor bearing mice in JH024 and JH015 PDXs were treated with vehicle or FX11 (2.2 mg/Kg) i.p. for 7 consecutive days. Mice were imaged for determining the tumor glucose uptake by [18F]-FDG-PET prior to the commencement of vehicle or FX11 treatment (D1) and on day 7 of vehicle or FX11 treatment (D7). On the day of imaging, each mouse was injected with 250 μCi of [18F]-FDG via the tail vein and imaged 45 minutes post-injection using the Mosaic HP (Philips) Small Animal PET imagers with 15 minutes static acquisition. PET images were reconstructed and co-registered with CT images Amira version 5.2.2 (Visage Imaging, San Diego, CA) (29).
Pyruvate sample preparation and animal handling
Samples (~30 μL) of [1-13C] pyruvic acid (Isotec, Miamisburg, OH), containing 15 mM of OX63 trityl radical and 1.5 mM of the gadolinium chelate dotarem were polarized at 3.35T and 1.4K in the Hypersense DNP polarizer (Oxford Instruments) for one hour. The hyperpolarized pyruvate sample was rapidly dissolved in 4 mL of a superheated alkaline buffer comprising 100 mg/L ethylendiaminetetraacetic acid (EDTA), 40 mM of TRIS buffer, 40 mM of NaOH and 30 mM of NaCl. This produces 80 mM concentration of pyruvate with physiologic pH (7.4) for administration to animals. Hyperpolarized [1-13C] pyruvate solution of 350 μL was intravenously injected over a period of 12–15 seconds through a catheter placed in the jugular vein of the tumor-bearing mice.
Representative PDXs that were sensitive (JH015, P253) and resistant (JH024, JH033) to FX11 treatment were chosen for the hyperpolarized 13C-MRS study and T2-weighted MRI measurements. Mice with 500 mm3 subcutaneous tumors were selected for the imaging study. The jugular vein catheter was surgically implanted to facilitate polarized substrate injections. The mice were treated with vehicle or FX11 (2.2 mg/kg) i.p. for seven consecutive days (N=4 mice/group).
In vivo 13C MR spectroscopy
As preparation for the MRI experiment, mice were infused with isofluorane in a plastic anesthesia chamber with scavenging. Anesthetized mice were placed in a mouse-specific holder within the MRI coil, outfitted with a mouse-specific nose cone inhalant anesthesia and scavenging system for imaging. This system also contains a pad for respiration monitoring, and endo-rectal fiber optic temperature monitoring device, a heated pad for maintaining core body temperature and leads for electrocardiography (ECG monitoring). In vivo MR experiments were performed on a 7T, 31-cm horizontal bore magnet (Agilent, CA). Multi-slice T2-weighted anatomic images were acquired using a respiratory-gated spin-echo sequence with a TE=60ms, TR=4000ms, fat saturation, FOV 40 × 40 mm, echo train length = 8, matrix 256 × 128, slice thickness = 1 mm, 15 slices. Dynamic 13C MR spectra were acquired utilizing a dual tuned 1H - 13C volume coil (M2M, 35mm). All spectra were acquired using slice-selective pulse with a nominal flip angle of 9°, TR = 1 s, 30,000 complex points and spectral width of 50 kHz. In vivo data acquisition started right before the pyruvate injection and collected single transient spectra over a period of 150s from a 5-mm-thick tumor slice. The peak heights of pyruvate and lactate resonance spectra were used to calculate relevant ratios (Lac/Pyr).
Statistical Analysis
Statistical analysis was carried out by two-tailed unpaired t test using GraphPad Prism 5 software. Standard error of mean (SEM) or standard deviation (SD) is either represented in the graphs or following the means of all measures, as stated in figure legends. Statistical significance was considered at the P < 0.05 level.
RESULTS
Pharmacological LDH-A inhibition leads to tumor growth inhibition selectively in TP53 mutant PDAC xenografts
We sought to determine the treatment effect of FX11, a small molecule that can inhibit lactate dehydrogenase A (LDH-A), in a panel of 15 pancreatic cancer PDXs. A wide range of responses to 4 weeks of FX11 therapy was observed in these PDXs, with tumor growth inhibition (TGI) ranging from ~40% to a few PDXs reaching a marginally larger volume than the control group (Fig. 1A). Overall, three of the PDXs had significant TGI with FX11 monotherapy (P253, JH015, and P194) (Fig. 1B). In this panel, only two PDX were KRAS wild type (P410 and P420), and no specific pattern of response to FX11 was noted based on KRAS mutational status. Similarly SMAD4 mutational status did not yield any discernible pattern of response (Supplementary Table S1). On contrary, when the waterfall plot was segregated based on TP53 status, nearly all PDXs with any evident TGI (including the three tumors with significant inhibition) were TP53 mutant, while PDXs with minimal response or marginal enhancement in growth were uniformly TP53 wild type. We assessed proliferation (by Ki-67 nuclear labeling) and apoptosis (using TUNEL staining) in two TP53 wild type (JH033 and JH024) and two TP53 mutant (P253 and JH015) PDXs, and identified a significant reduction in proliferation, and a significant increase in apoptosis post-FX11 therapy that was restricted to the TP53 mutant xenografts (Fig. 2 A and B). Overall, these findings suggested that TP53 status is likely to be a key molecular determinant of response to pharmacological LDH-A inhibition.
Fig. 1. In vivo anti-tumor effects of LDH-A inhibitor, FX11 in human pancreatic cancer xenografts.

(A) FX11 treatment delays tumor progression, selectively in TP53 mutant (MUT) tumors. Tumors from fifteen individual patient-derived pancreatic cancer xenografts were implanted subcutaneously in athymic mice. Animals with established tumors (~200mm3) were injected with vehicle or FX11 (2.2 mg/kg) i.p. for four weeks. Relative tumor growth inhibition (TGI) was compared to vehicle treated mice on day 28. Tumors with TP53 wild type (WT) tumors were completely resistant to glycolytic inhibition, while a range of TGI was observed with mutant TP53 PDXs. (B) Three PDXs (P194, JH015 and P253) showed significant delay in tumor progression compared to vehicle treated mice. Points, mean ± SEM. N = 8–10 tumors per group. *P=0.0478, ** P=0.0011, ***P=0.0002 compared to vehicle treated mice.
Fig. 2. FX11 treatment induces apoptosis and inhibits tumor cell proliferation selectively in tumors with mutant TP53 status.

Immunohistochemical staining of TUNEL and Ki-67 in paraffin-embedded pancreatic tumors. Tumors resected on day 28 from vehicle and FX11 treatment groups (JH033, JH024, P253 and JH015) were used for analysis. Formalin-fixed, paraffin-embedded sections (5 μm) sections were stained for nuclear Ki-67 and TUNEL positive tumor cells. (A) Representative photomicrographs (20×) from TP53 wild-type tumors (JH033 and JH024). No significant induction of apoptosis or inhibition of Ki-67 was seen in FX11 treated tumors compared to vehicle treatment. (B) Representative photomicrographs (20×) from mutant TP53 tumors (P253 and JH015) showing that FX11 treatment significantly induced apoptosis and inhibits tumor cell proliferation compared to vehicle treatment. Quantification of TUNEL and Ki-67 positive tumor cells are shown on the right panel of figures. The data representative of mean ± SD were generated by evaluating five different high power fields (hpf) from three different tumors per group. **P<0.01, and ***P<0.005 compared to vehicle treated mice.
We also measured the expression of the p53 target TIGAR, whose expression has been linked to decreased glycolytic conversion to pyruvate and lactate. Using immunohistochemistry, we found that TIGAR expression was positively correlated with TP53 wild type status, and its expression appeared diminished in TP53 mutant tumors (Fig. 3A and B). Quantification of the p53 and TIGAR staining intensity in tumor sections of TP53 wild type PDXs revealed a significant increase in p53 and TIGAR expression compared to TP53 mutant PDXs (Fig. 3C). Baseline TIGAR mRNA expression was also reduced in TP53 mutant tumors compared to tumors with TP53 wild-type tumors, with a significant downregulation in one of two PDXs (Supplementary Fig. S1).
Fig. 3. TIGAR expression is elevated in human pancreatic PDX with wild type TP53 compared to tumors with mutant TP53 status.

Representative high power (40×) photomicrographs of p53 and TIGAR in stained tumor sections from (A) tumors with wild type TP53 status (P420, JH033, P286 and JH024) and (B) tumors with mutant TP53 status (P253, P410, P194 and JH015). Higher cytoplasmic expression of TIGAR was detected in wild type TP53 PDXs compared to mutant TP53 tumors. (C), Quantification of the staining intensity. TIGAR immunostaining in tumor sections of TP53 WT PDXs revealed a significant increase in TIGAR expression compared to TP53 MUT PDXs. Bars represent aggregate mean staining scores ± SD of TP53 MUT and TP53 WT PDXs.***P=0.0001, **P=0.0016 compared to TP53 MUT PDXs. a.u denotes arbitrary units.
FDG-PET imaging of PDAC xenografts
In light of the differential responses to LDH-A inhibition, we interrogated the pattern of 18F-deoxy-glucose (FDG) uptake at baseline and following FX11 therapy in two PDXs, one with wild type TP53 (JH024) and the second with a TP53 mutant (JH015). The FDG uptake rates were different between JH024 and JH015 tumors. At baseline (D1), JH015 tumors had elevated FDG uptake compared to JH024, indicating greater reliance on glycolysis for energy production (Fig. 4A and 4B). Notably, there were no alterations in tumor FDG uptake following 7 days of FX11 therapy in JH024 (Fig. 4A). In contrast, the avid glucose uptake observed in JH015 xenografts at baseline was significantly reduced following 7 days of FX11 therapy (Fig. 4B).
Fig. 4. FX11 treatment significantly reduces 18F-FDG uptake in tumor with mutant TP53 status.

Subcutaneous PDXs including (A) wild type TP53 (JH024) and (B) mutant TP53 (JH015) were treated with vehicle or FX11 (2.2 mg/Kg) i.p. for seven consecutive days. On the day of imaging (D1 and D7), mice were injected with 250 μCi of [18F]-FDG via the tail vein and imaged 45 minutes post-injection. While FX11 treatment did not significantly reduce the tumor 18F-FDG uptake in mice bearing JH024 (A), the treatment significantly reduced the 18F-FDG in mice bearing JH015 (B). Arrowheads point towards tumor location on the mouse flank. Histograms shown at the bottom panels of figure represent the standard uptake values (SUV) in tumors. SUV in tumors were normalized by dividing the values with values of 18F-FDG update in the liver of each animal at the time of image acquisition. Points, mean ± SEM. N = 3–4 mice per group. *P=0.0446, compared to vehicle treated mice.
Hyperpolarized 13C MR spectroscopy confirms that changes in lactate flux upon FX11 therapy are restricted to TP53 mutant xenografts
The recent development of hyperpolarized MR spectroscopic imaging methods to probe the biochemical and metabolic profile of tumors using 13C-labeled pyruvate as the tracer, and then monitor its intracellular conversion to various metabolites, offers a unique opportunity to examine in vivo responses to metabolism-targeted therapies. In order to assess the metabolic conversion of hyperpolarized pyruvate to lactate, two sets of PDXs that were either sensitive to FX11 treatment (JH015 and P253, both TP53 mutant) or resistant to FX11 treatment (JH024 and JH033, both TP53 wild type), respectively, were chosen for hyperpolarized 13C-MRS study. Representative dynamic 13C MRS spectra of JH033 tumor (FX11 resistant) captured prior to FX11 treatment and 7 days FX11 treatment are shown in Fig. 5A and 5B, respectively. Pyruvate and lactate peak intensities over time are shown in Fig. 5E and 5F. FX11 treatment was ineffective in altering the conversion flux from pyruvate to lactate in JH033. In contrast to the JH033 spectra, dynamic 13C MRS spectra of P253 showed that pyruvate-to-lactate conversion was significantly reduced after seven days of FX11 treatment as compared to spectra captured prior to FX11 treatment (Fig. 5C and 5D), and this was confirmed in the pyruvate and lactate peak intensities over time (Fig. 5G and 5H). Seven days vehicle treatment did not alter the flux of hyperpolarized pyruvate to lactate conversion in both JH033 and P253 tumors (13C MRS spectra not shown).
Fig. 5. Pyruvate-to-lactate conversion flux varies in PDXs, which were resistant and sensitive to FX11 treatment.
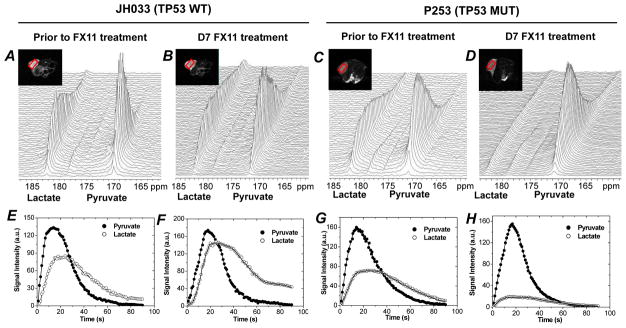
Representative dynamic 13C MR spectra acquired from FX11 resistant JH033 (TP53 wild type) and FX11 sensitive P253 tumor, a TP53 mutant PDX. Spectra captured prior to D7 FX11 treatment of JH033 and P253 are shown in A and B, and C and D, respectively. Sequential spectra were acquired from a 5-mm tumor slice over 150 seconds after i.v. injection of hyperpolarized [1-13C] pyruvate as described in materials and methods. Tumor lactate and pyruvate peak intensities with time after i.v. injection of hyperpolarized 13C pyruvate is shown prior to FX11 treatment (E and G) and D7 FX11 treatment (F and H) in JH033 and P253, respectively. Representative anatomical T2-weighted axial MR images containing slice ROI (red box) are shown in inset.
The integrated lactate-to-pyruvate ratio (Lac/Pyr) can be used to represent a drug therapy response marker in this study. The Lac/Pyr flux ratio was calculated from the area under the curve (as regarded a “Model-Free” approach) of the metabolic flux from the dynamic scan (30). The Lac/Pyr flux ratios in response to FX11 treatments were significantly different between tumors sensitive (P253 and JH015) and resistant (JH024 and JH033) to FX11 treatment (Fig. 6A). The Lac/Pyr ratios increased with time in the resistant (JH024 and JH033) tumors (Fig. 6A). In stark contrast, the Lac/Pyr of both sensitive tumors (P253 and JH015) showed a striking decrease in response to FX11 treatment (Fig. 6A). The tumor growth curves of representative tumors resistant (JH033) and sensitive (P253) to FX11 treatment are shown in Fig. 6B and 6C. We also evaluated the unidirectional conversion rate constants (kp = pyruvate-to-lactate) using modified Bloch’s equation of kinetic model (31). Consistent with the above results, the conversion rate constant (kp) decreased in FX11 sensitive tumors and increased in FX11 resistant tumors (Table 1).
Fig. 6. FX11 treatment reduces the lactate/pyruvate ratio, selectively in PDXs sensitive to FX11 treatment.

(A) Lac/Pyr ratio was reduced with FX11 treatment in PDXs sensitive to FX11 (P253 and JH015). However, the ratio was increased in PDXs resistant to FX11 treatment (JH024 and JH033). (B & C) Tumor growth curves representative of tumors which were resistant (JH033) and sensitive (P253) to FX11 treatment. N = 8–10 tumors in each group. Errors bars represent standard error of mean ± SEM. ** P=0.0011 compared to vehicle treated mice.
Table 1.
Apparent rate constants kP (pyruvate-to-lactate conversion) of tumors from FX11 pretreatment and D7 FX11 treatment. N= 4 tumors in each xenografts, mean±SD, P<0.05, Student’s t-test.
| PDXs | Prior to FX11 treatment kp (S1) | D7 FX11 treatment kp (S1) | P-values |
|---|---|---|---|
| P253 | 0.054 ± 0.004 | 0.029 ± 0.005 | 0.011 |
| JH015 | 0.055 ± 0.003 | 0.033 ± 0.004 | 0.013 |
| JH024 | 0.059 ± 0.005 | 0.077 ± 0.004 | 0.019 |
| JH033 | 0.061 ± 0.004 | 0.083 ± 0.003 | 0.016 |
DISCUSSION
Persistent aerobic glycolysis is a key metabolic dependency in tumorigenesis. LDH-A is a key regulator of glycolysis and plays a critical role in tumor maintenance (6). LDH-A is frequently up-regulated in aggressive cancers, and expression levels frequently correlate with poor prognosis (32,33). Further, knockdown of LDHA compromises the tumorigenic potential of malignant cells (6). LDH-A expression is significantly elevated in pancreatic cancer compared to paired normal tissues (12,34). While, forced expression of LDH-A enhances the proliferation of pancreatic cancer cells, knocking down of LDHA transcript expression inhibited cell growth and induced apoptosis (12). Silencing LDHA expression also inhibited growth of pancreatic cancer cells in vivo, suggesting LDH-A a potential target for pancreatic cancer therapy (12). Of note, systemic inhibition of LDH-A may not produce side effects in humans, since hereditary LDH-A deficiency does not provoke any symptoms under baseline circumstances (35).
The advent of metabolism-targeted agents has garnered interest in identifying genetic determinants of responses to these agents in cancer cells, especially for therapies that are not geared directly against specific activating events like IDH1 mutations. In this study, we examined the therapeutic efficacy of a small molecule LDH-A inhibitor across a panel of PDAC PDXs. Human pancreatic cancer xenografts used in the present study are annexed with desmoplastic stroma (Supplementary Figure S2), a well characterized feature of primary tumors and metastatic lesions of human PDAC (36). Masson’s trichrome staining and H&E histology from TP53 wild type and TP53 mutant tumors revealed that tumors were enriched with fibrotic stroma, irrespective of their TP53 status (Supplementary Figure S2). We identify that the sensitivity to LDH-A inhibition is dependent on p53 status of the tumor, with TP53 wild type cases demonstrating complete refractoriness to FX11. The basis for resistance to glycolytic inhibition could be the reduced dependence on glucose as an elemental fuel, as TP53 wild type PDXs had minimal FDG uptake. Of note, expression of TIGAR was higher in PDXs with wild type TP53 function, while TP53 mutations resulted in reduced TIGAR levels. TIGAR is a p53-inducible protein that functions to lower glycolytic flux and reduces cancer cell sensitivity to reactive oxygen species associated apoptosis (37–39). In TP53 wild type cells, TIGAR expression functions to decrease the levels of fructose-2-6-biphosphate, which suppresses glycolysis by diverting glucose-6-phosphate into the pentose phosphate pathway. The correlation of TIGAR expression with p53 status in pancreatic cancer PDXs could explain one potential mechanism for the reduced sensitivity to LDH-A inhibition in p53 wild type, high TIGAR cases, by reducing glycolytic dependence.
The understanding of cancer metabolism has deep roots in molecular biology and genetics but the ability to detect metabolism as it occurs in tumors without a biopsy is largely limited to PET imaging of enhanced glucose uptake into tumors using 18F-fluorodeoxyglucose. The recently discovered hyperpolarized MRI using DNP (dynamic nuclear polarization) technology has the potential of providing real-time images of metabolic processes in tumors at unprecedented levels of sensitivity for monitoring therapy responses (40–43). Hyperpolarized 13C magnetic resonance allows rapid and noninvasive monitoring of dynamic pathway-specific metabolic and physiologic processes. Hyperpolarized 13C MRS provides a unique ability to non-invasively assess metabolic fluxes and downstream product(s) in real time, which has been utilized for tumor diagnosis, to stage the extent of disease, and to monitor the response to therapy.
Transmembrane transport of pyruvate, lactate and ketone bodies are mediated by monocarboxylate transporters -1 and 4 (MCT-1 and MCT-4) (44). It has been documented that lactate produced by tumor cells can be taken up by stromal cells to regenerate pyruvate that either can be extruded to refuel the cancer cell or can be used for oxidative phosphorylation (45). Hypoxia-inducible factor 1α (HIF-1α) stimulates the conversion of glucose to pyruvate and lactate by up-regulating glucose transporter isoform 1 (GLUT1), hexokinase and LDH-A, as well as the lactate-extruding enzyme MCT-4 (46). A recent 13C MRS study confirmed the modulatory effect of LDH-A, lactate and MCT isoforms in hyperpolarized pyruvate to hyperpolarized lactate conversion in cancer cell lines (47). Results obtained in our 13C MRS experiments demonstrated a decrease in pyruvate to lactate conversion following FX11 treatment, in JH015 and P253, both TP53 mutant PDXs. In order to characterize the contribution of tumor lactate pool, LDH-A, HIF-1α, and MCT isoforms (MCT-1 and MCT-4) in attenuating hyperpolarized pyruvate to lactate production, we conducted baseline gene expression analysis and measuring the tumor lactate pool. Baseline tumor lactate, LDH-A, HIF-1α, MCT-1 and MCT-4 gene expression were not significantly different in tumors responded to FX11 treatment as compared to tumors resistant to FX11 treatment (Data not shown).
We measured the differences in pyruvate metabolism in pancreatic cancer xenografts, which were sensitive and resistant to FX11 treatment. Multiple injections of hyperpolarized pyruvate in the same animal enabled us to measure the flux changes and differential kinetics in pyruvate-to-lactate conversion within an individual tumor over time. Of note, we were able to gauge differences in pharmacodynamics of pyruvate to lactate conversion in real time at a point even before reduction in tumor volumes were observed in FX11-sensitive tumors. Our studies demonstrated the feasibility of using 13C hyperpolarized metabolic imaging as a non-invasive biomarker for monitoring response to metabolic therapy. The capability of MRS to non-invasively obtain metabolic information is a valuable asset in the metabolic profiling of tumors, and can provide molecular signatures of specific biological processes as a complementary imaging modality of FDG-PET.
The relatively small number of xenografts studied and the lack of detailed investigation of factors that might also influence dependence on glycolytic metabolism, including but not limited to intra-tumoral pH, O2 tension, interstitial pressure, tumor size, and growth fraction. Even though we have not conducted in vitro studies in support of the impact of mutant p53 in targeting Warburg effect, previous report indicated that tumor-associated mutant p53 stimulates the Warburg effect in cultured cells and demonstrated that targeting altered glucose metabolism could be a feasible therapeutic strategy for tumor carrying mutant p53 (48). Additional studies are needed to fully understand the mechanistic link in supportive of the influence of mutant p53 in deciding the sensitivity of LDH-A targeted therapy, or whether the phenomenon is demonstrable only in the in vivo milieu. Our data show that pharmacological inhibition of LDH-A may have utility in the treatment of tumors by reducing tumor growth of TP53 mutant tumors.
In summary, we observe that FX11, a LDH-A small molecule antagonist, attenuated in vivo tumor growth, induced apoptosis and reduced tumor cell proliferation, specifically in pancreatic cancer PDXs with mutant TP53. We used FDG PET-CT scans and document that PDXs with mutant TP53 tumors have relatively high glucose uptake compared to tumors with TP53 wild-type status. In addition, using hyperpolarized 13C magnetic resonance spectroscopy (HP-MRS), we demonstrate that FX11 treatment inhibited the pyruvate to lactate conversion only tumors with mutant TP53 status. Currently, we do not understand the mechanistic basis for the resistance of wild-type TP53 pancreatic cancer PDXs to FX11, particularly regarding the lack of an effect on the in vivo conversion of pyruvate to lactate. Further, it is notable that high concentrations of FX11 could have off-target effects beyond inhibition of LDH-A. Nonetheless, our collective studies are the first to document a link between tumor p53 status and LDH-A inhibitor sensitivity. Our work also suggests that the elevated glucose metabolism in TP53 mutant tumors can be exploited for the preferential targeting of these tumors by LDH-A inhibitor therapy. The effectiveness of the therapy can be monitored by in vivo metabolic imaging and can be readily applied to humans for monitoring tumor response to therapy.
Supplementary Material
Acknowledgments
We are very grateful to Elizabeth De Oliveira, Johns Hopkins University for expert help in animal experiments and Fatima Al-Shahrour and Héctor Tejero, CNIO, Spanish National Cancer Research Center for assistance in gene expression data analysis. This study was supported by funding from a Stand Up To Cancer Dream Team Translational Research Grant SU2C-AACR DT0509 (NVR and CVD). Stand Up To Cancer is a program of the Entertainment Industry Foundation administered by the American Association for Cancer Research. Research also supported by P30CA016520, R01CA051497, R01CA057341 (CVD), R01CA113669 (AM), the Wayne Huizinga Trust at Moffitt Cancer Center, R01 CA077575-14 (RJG)
Footnotes
Presented in part at 103rd AACR annual meeting; March 31– April 4, 2012 Chicago, IL (Abstract LB-61).
Conflict of Interest: The authors disclose no potential conflicts of interest.
References
- 1.Rahib L, Smith BD, Aizenberg R, Rosenzweig AB, Fleshman JM, Matrisian LM. Projecting cancer incidence and deaths to 2030: the unexpected burden of thyroid, liver, and pancreas cancers in the United States. Cancer research. 2014;74(11):2913–21. doi: 10.1158/0008-5472.CAN-14-0155. [DOI] [PubMed] [Google Scholar]
- 2.Thota R, Pauff JM, Berlin JD. Treatment of metastatic pancreatic adenocarcinoma: a review. Oncology. 2014;28(1):70–4. [PubMed] [Google Scholar]
- 3.Hanahan D, Weinberg RA. Hallmarks of cancer: the next generation. Cell. 2011;144(5):646–74. doi: 10.1016/j.cell.2011.02.013. [DOI] [PubMed] [Google Scholar]
- 4.Warburg O. The metabolism of tumors. London: Constable; 1930. pp. 5–47. [Google Scholar]
- 5.Kim JW, Dang CV. Cancer’s molecular sweet tooth and the Warburg effect. Cancer research. 2006;66(18):8927–30. doi: 10.1158/0008-5472.CAN-06-1501. [DOI] [PubMed] [Google Scholar]
- 6.Fantin VR, St-Pierre J, Leder P. Attenuation of LDH-A expression uncovers a link between glycolysis, mitochondrial physiology, and tumor maintenance. Cancer cell. 2006;9(6):425–34. doi: 10.1016/j.ccr.2006.04.023. [DOI] [PubMed] [Google Scholar]
- 7.Fischer K, Hoffmann P, Voelkl S, Meidenbauer N, Ammer J, Edinger M, et al. Inhibitory effect of tumor cell-derived lactic acid on human T cells. Blood. 2007;109(9):3812–9. doi: 10.1182/blood-2006-07-035972. [DOI] [PubMed] [Google Scholar]
- 8.Gottfried E, Kunz-Schughart LA, Ebner S, Mueller-Klieser W, Hoves S, Andreesen R, et al. Tumor-derived lactic acid modulates dendritic cell activation and antigen expression. Blood. 2006;107(5):2013–21. doi: 10.1182/blood-2005-05-1795. [DOI] [PubMed] [Google Scholar]
- 9.Koukourakis MI, Giatromanolaki A, Sivridis E, Gatter KC, Harris AL. Lactate dehydrogenase 5 expression in operable colorectal cancer: strong association with survival and activated vascular endothelial growth factor pathway--a report of the Tumour Angiogenesis Research Group. J Clin Oncol. 2006;24(26):4301–8. doi: 10.1200/JCO.2006.05.9501. [DOI] [PubMed] [Google Scholar]
- 10.Gatenby RA, Gillies RJ. A microenvironmental model of carcinogenesis. Nature reviews Cancer. 2008;8(1):56–61. doi: 10.1038/nrc2255. [DOI] [PubMed] [Google Scholar]
- 11.Dang CV. The interplay between MYC and HIF in the Warburg effect. Ernst Schering Found Symp Proc. 2007;(4):35–53. doi: 10.1007/2789_2008_088. [DOI] [PubMed] [Google Scholar]
- 12.Rong Y, Wu W, Ni X, Kuang T, Jin D, Wang D, et al. Lactate dehydrogenase A is overexpressed in pancreatic cancer and promotes the growth of pancreatic cancer cells. Tumour biology : the journal of the International Society for Oncodevelopmental Biology and Medicine. 2013;34(3):1523–30. doi: 10.1007/s13277-013-0679-1. [DOI] [PubMed] [Google Scholar]
- 13.Sheng SL, Liu JJ, Dai YH, Sun XG, Xiong XP, Huang G. Knockdown of lactate dehydrogenase A suppresses tumor growth and metastasis of human hepatocellular carcinoma. The FEBS journal. 2012;279(20):3898–910. doi: 10.1111/j.1742-4658.2012.08748.x. [DOI] [PubMed] [Google Scholar]
- 14.McCleland ML, Adler AS, Shang Y, Hunsaker T, Truong T, Peterson D, et al. An integrated genomic screen identifies LDHB as an essential gene for triple-negative breast cancer. Cancer research. 2012;72(22):5812–23. doi: 10.1158/0008-5472.CAN-12-1098. [DOI] [PubMed] [Google Scholar]
- 15.Dutta P, Le A, Vander Jagt DL, Tsukamoto T, Martinez GV, Dang CV, et al. Evaluation of LDH-A and glutaminase inhibition in vivo by hyperpolarized 13C-pyruvate magnetic resonance spectroscopy of tumors. Cancer research. 2013;73(14):4190–5. doi: 10.1158/0008-5472.CAN-13-0465. [DOI] [PMC free article] [PubMed] [Google Scholar]
- 16.Xie H, Hanai J, Ren JG, Kats L, Burgess K, Bhargava P, et al. Targeting lactate dehydrogenase--a inhibits tumorigenesis and tumor progression in mouse models of lung cancer and impacts tumor-initiating cells. Cell metabolism. 2014;19(5):795–809. doi: 10.1016/j.cmet.2014.03.003. [DOI] [PMC free article] [PubMed] [Google Scholar]
- 17.Wang YH, Israelsen WJ, Lee D, Yu VW, Jeanson NT, Clish CB, et al. Cell-state-specific metabolic dependency in hematopoiesis and leukemogenesis. Cell. 2014;158(6):1309–23. doi: 10.1016/j.cell.2014.07.048. [DOI] [PMC free article] [PubMed] [Google Scholar]
- 18.Le A, Cooper CR, Gouw AM, Dinavahi R, Maitra A, Deck LM, et al. Inhibition of lactate dehydrogenase A induces oxidative stress and inhibits tumor progression. Proc Natl Acad Sci U S A. 2010;107(5):2037–42. doi: 10.1073/pnas.0914433107. [DOI] [PMC free article] [PubMed] [Google Scholar]
- 19.Yen KE, Bittinger MA, Su SM, Fantin VR. Cancer-associated IDH mutations: biomarker and therapeutic opportunities. Oncogene. 2010;29(49):6409–17. doi: 10.1038/onc.2010.444. [DOI] [PubMed] [Google Scholar]
- 20.Yang ZJ, Chee CE, Huang S, Sinicrope FA. The role of autophagy in cancer: therapeutic implications. Molecular cancer therapeutics. 2011;10(9):1533–41. doi: 10.1158/1535-7163.MCT-11-0047. [DOI] [PMC free article] [PubMed] [Google Scholar]
- 21.Rubio-Viqueira B, Jimeno A, Cusatis G, Zhang X, Iacobuzio-Donahue C, Karikari C, et al. An in vivo platform for translational drug development in pancreatic cancer. Clin Cancer Res. 2006;12(15):4652–61. doi: 10.1158/1078-0432.CCR-06-0113. [DOI] [PubMed] [Google Scholar]
- 22.Rajeshkumar NV, De Oliveira E, Ottenhof N, Watters J, Brooks D, Demuth T, et al. MK-1775, a Potent Wee1 Inhibitor, Synergizes with Gemcitabine to Achieve Tumor Regressions, Selectively in p53-Deficient Pancreatic Cancer Xenografts. Clin Cancer Res. 2011;17(9):2799–806. doi: 10.1158/1078-0432.CCR-10-2580. [DOI] [PMC free article] [PubMed] [Google Scholar]
- 23.Jones S, Zhang X, Parsons DW, Lin JC, Leary RJ, Angenendt P, et al. Core signaling pathways in human pancreatic cancers revealed by global genomic analyses. Science (New York, NY. 2008;321(5897):1801–6. doi: 10.1126/science.1164368. [DOI] [PMC free article] [PubMed] [Google Scholar]
- 24.Mizuma M, Rasheed ZA, Yabuuchi S, Omura N, Campbell NR, de Wilde RF, et al. The gamma secretase inhibitor MRK-003 attenuates pancreatic cancer growth in preclinical models. Molecular cancer therapeutics. 2012;11(9):1999–2009. doi: 10.1158/1535-7163.MCT-12-0017. [DOI] [PMC free article] [PubMed] [Google Scholar]
- 25.Favier J, Briere JJ, Burnichon N, Riviere J, Vescovo L, Benit P, et al. The Warburg effect is genetically determined in inherited pheochromocytomas. PloS one. 2009;4(9):e7094. doi: 10.1371/journal.pone.0007094. [DOI] [PMC free article] [PubMed] [Google Scholar]
- 26.Korgun ET, Unek G, Herrera E, Jones CJ, Wadsack C, Kipmen-Korgun D, et al. Mapping of CIP/KIP inhibitors, G1 cyclins D1, D3, E and p53 proteins in the rat term placenta. Histochemistry and cell biology. 2011;136(3):267–78. doi: 10.1007/s00418-011-0841-z. [DOI] [PubMed] [Google Scholar]
- 27.Wong PP, Demircioglu F, Ghazaly E, Alrawashdeh W, Stratford MR, Scudamore CL, et al. Dual-action combination therapy enhances angiogenesis while reducing tumor growth and spread. Cancer cell. 2015;27(1):123–37. doi: 10.1016/j.ccell.2014.10.015. [DOI] [PubMed] [Google Scholar]
- 28.Rajendran R, Garva R, Ashour H, Leung T, Stratford I, Krstic-Demonacos M, et al. Acetylation mediated by the p300/CBP-associated factor determines cellular energy metabolic pathways in cancer. International journal of oncology. 2013;42(6):1961–72. doi: 10.3892/ijo.2013.1907. [DOI] [PubMed] [Google Scholar]
- 29.Weinstein EA, Liu L, Ordonez AA, Wang H, Hooker JM, Tonge PJ, et al. Noninvasive determination of 2-[18F]-fluoroisonicotinic acid hydrazide pharmacokinetics by positron emission tomography in Mycobacterium tuberculosis-infected mice. Antimicrobial agents and chemotherapy. 2012;56(12):6284–90. doi: 10.1128/AAC.01644-12. [DOI] [PMC free article] [PubMed] [Google Scholar]
- 30.Hill DK, Orton MR, Mariotti E, Boult JK, Panek R, Jafar M, et al. Model free approach to kinetic analysis of real-time hyperpolarized 13C magnetic resonance spectroscopy data. PloS one. 2013;8(9):e71996. doi: 10.1371/journal.pone.0071996. [DOI] [PMC free article] [PubMed] [Google Scholar]
- 31.Harrison C, Yang C, Jindal A, DeBerardinis RJ, Hooshyar MA, Merritt M, et al. Comparison of kinetic models for analysis of pyruvate-to-lactate exchange by hyperpolarized 13 C NMR. NMR in biomedicine. 2012;25(11):1286–94. doi: 10.1002/nbm.2801. [DOI] [PMC free article] [PubMed] [Google Scholar]
- 32.Koukourakis MI, Giatromanolaki A, Sivridis E, Bougioukas G, Didilis V, Gatter KC, et al. Lactate dehydrogenase-5 (LDH-5) overexpression in non-small-cell lung cancer tissues is linked to tumour hypoxia, angiogenic factor production and poor prognosis. British journal of cancer. 2003;89(5):877–85. doi: 10.1038/sj.bjc.6601205. [DOI] [PMC free article] [PubMed] [Google Scholar]
- 33.Koukourakis MI, Giatromanolaki A, Sivridis E. Lactate dehydrogenase isoenzymes 1 and 5: differential expression by neoplastic and stromal cells in non-small cell lung cancer and other epithelial malignant tumors. Tumour biology : the journal of the International Society for Oncodevelopmental Biology and Medicine. 2003;24(4):199–202. doi: 10.1159/000074430. [DOI] [PubMed] [Google Scholar]
- 34.Zhao D, Zou SW, Liu Y, Zhou X, Mo Y, Wang P, et al. Lysine-5 acetylation negatively regulates lactate dehydrogenase A and is decreased in pancreatic cancer. Cancer cell. 2013;23(4):464–76. doi: 10.1016/j.ccr.2013.02.005. [DOI] [PMC free article] [PubMed] [Google Scholar]
- 35.Kanno T, Sudo K, Maekawa M, Nishimura Y, Ukita M, Fukutake K. Lactate dehydrogenase M-subunit deficiency: a new type of hereditary exertional myopathy. Clinica chimica acta; international journal of clinical chemistry. 1988;173(1):89–98. doi: 10.1016/0009-8981(88)90359-2. [DOI] [PubMed] [Google Scholar]
- 36.Whatcott CJ, Diep CH, Jiang P, Watanabe A, LoBello J, Sima C, et al. Desmoplasia in primary tumors and metastatic lesions of pancreatic cancer. Clin Cancer Res. 2015 Feb 18; doi: 10.1158/1078-0432.CCR-14-1051. Epub ahead of print. [DOI] [PMC free article] [PubMed] [Google Scholar]
- 37.Bensaad K, Tsuruta A, Selak MA, Vidal MN, Nakano K, Bartrons R, et al. TIGAR, a p53-inducible regulator of glycolysis and apoptosis. Cell. 2006;126(1):107–20. doi: 10.1016/j.cell.2006.05.036. [DOI] [PubMed] [Google Scholar]
- 38.Lee P, Vousden KH, Cheung EC. TIGAR, TIGAR, burning bright. Cancer & metabolism. 2014;2(1):1. doi: 10.1186/2049-3002-2-1. [DOI] [PMC free article] [PubMed] [Google Scholar]
- 39.Wanka C, Steinbach JP, Rieger J. Tp53-induced glycolysis and apoptosis regulator (TIGAR) protects glioma cells from starvation-induced cell death by up-regulating respiration and improving cellular redox homeostasis. The Journal of biological chemistry. 2012;287(40):33436–46. doi: 10.1074/jbc.M112.384578. [DOI] [PMC free article] [PubMed] [Google Scholar]
- 40.Golman K, in ‘t Zandt R, Thaning M. Real-time metabolic imaging. Proc Natl Acad Sci U S A. 2006;103(30):11270–5. doi: 10.1073/pnas.0601319103. [DOI] [PMC free article] [PubMed] [Google Scholar]
- 41.Golman K, Zandt RI, Lerche M, Pehrson R, Ardenkjaer-Larsen JH. Metabolic imaging by hyperpolarized 13C magnetic resonance imaging for in vivo tumor diagnosis. Cancer research. 2006;66(22):10855–60. doi: 10.1158/0008-5472.CAN-06-2564. [DOI] [PubMed] [Google Scholar]
- 42.Day SE, Kettunen MI, Gallagher FA, Hu DE, Lerche M, Wolber J, et al. Detecting tumor response to treatment using hyperpolarized C-13 magnetic resonance imaging and spectroscopy. Nat Med. 2007;13(11):1382–87. doi: 10.1038/nm1650. [DOI] [PubMed] [Google Scholar]
- 43.Hu S, Balakrishnan A, Bok RA, Anderton B, Larson PE, Nelson SJ, et al. 13C-pyruvate imaging reveals alterations in glycolysis that precede c-Myc-induced tumor formation and regression. Cell metabolism. 2011;14(1):131–42. doi: 10.1016/j.cmet.2011.04.012. [DOI] [PMC free article] [PubMed] [Google Scholar]
- 44.Pinheiro C, Longatto-Filho A, Azevedo-Silva J, Casal M, Schmitt FC, Baltazar F. Role of monocarboxylate transporters in human cancers: state of the art. Journal of bioenergetics and biomembranes. 2012;44(1):127–39. doi: 10.1007/s10863-012-9428-1. [DOI] [PubMed] [Google Scholar]
- 45.Kroemer G, Pouyssegur J. Tumor cell metabolism: cancer’s Achilles’ heel. Cancer cell. 2008;13(6):472–82. doi: 10.1016/j.ccr.2008.05.005. [DOI] [PubMed] [Google Scholar]
- 46.Pouyssegur J, Dayan F, Mazure NM. Hypoxia signalling in cancer and approaches to enforce tumour regression. Nature. 2006;441(7092):437–443. doi: 10.1038/nature04871. [DOI] [PubMed] [Google Scholar]
- 47.Lodi A, Woods SM, Ronen SM. Treatment with the MEK inhibitor U0126 induces decreased hyperpolarized pyruvate to lactate conversion in breast, but not prostate, cancer cells. NMR in biomedicine. 2013;26(3):299–306. doi: 10.1002/nbm.2848. [DOI] [PMC free article] [PubMed] [Google Scholar]
- 48.Zhang C, Liu J, Liang Y, Wu R, Zhao Y, Hong X, et al. Tumour-associated mutant p53 drives the Warburg effect. Nature communications. 2013;4:2935. doi: 10.1038/ncomms3935. [DOI] [PMC free article] [PubMed] [Google Scholar]
Associated Data
This section collects any data citations, data availability statements, or supplementary materials included in this article.