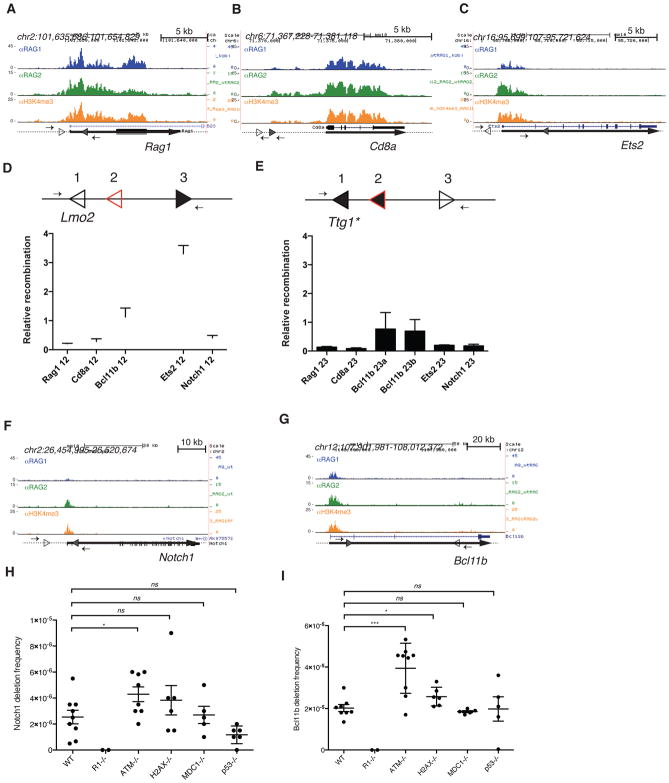
Figure 4. Off-target cleavage by RAG is rare and restricted by ATM.
RAG1, RAG2, and H3K4me3 ChIP-seq data are shown for (A) Rag1, (B) Cd8a, (C) Ets2, (F) Notch1, and (G) Bcl11b in WT mouse thymocytes. The 12-cRSSs and 23-cRSSs are indicated by open and filled triangles, respectively. Small arrows represent PCR primers used to assay for RAG-dependent deletions or inversions, and thick lines represent gene bodies. (D and E) The intrinsic recombination activity of selected cRSSs was assayed using a plasmid substrate, diagrammed above each panel. Arrows, PCR primers for recombination assay; position 1, reference cRSS (either the Lmo2 12-cRSS or a modified Ttg1 23-cRSS, open triangle); position 2, test 12- or 23-cRSS (red open triangle); position 3, appropriate consensus partner RSS (filled black triangle). Recombination activity (mean +SEM) of each test cRSS is shown relative to that of the reference cRSS. RAG-mediated deletions at the mouse (H) Notch1 and (I) Bcl11b loci were detected using a nested PCR assay. The frequency of deletions (mean ±SEM) is shown for WT, Rag1−/−, Atm−/−, H2ax−/, Mdc1−/−, and P53−/− thymocytes. Each point represents data generated from one mouse. Unpaired t-test, *p ≤ 0.05, *** p ≤ 0.001, ns = not significant. See also Figure S4 and Table S3.

