Abstract
Purpose
Myxopapillary ependymoma (MPE) is a distinct histological variant of ependymoma arising commonly in the spinal cord. Despite an overall favorable prognosis, distant metastases, subarachnoid dissemination, and late recurrences have been reported. Currently the only effective treatment for MPE is gross-total resection. We characterized the genomic and transcriptional landscape of spinal ependymomas in an effort to delineate the genetic basis of this disease and identify new leads for therapy.
Experimental Design
Gene expression profiling was performed on 35 spinal ependymomas, and copy number profiling on an overlapping cohort of 46 spinal ependymomas. Functional validation experiments were performed on tumour lysates consisting of assays measuring Pyruvate Kinase M activity (PKM), Hexokinase activity (HK), and lactate production.
Results
At a gene expression level, we demonstrate that spinal Grade II and MPE are molecularly and biologically distinct. These findings are supported by specific copy number alterations occurring in each histological variant. Pathway analysis revealed that MPE are characterized by increased cellular metabolism, associated with up-regulation of HIF-1α. These findings were validated by western blot analysis demonstrating increased protein expression of HIF-1α, HK2, PDK1, and phosphorylation of PDHE1A. Functional assays were performed on MPE lysates, which demonstrated decreased PKM activity, increased HK activity, and elevated lactate production.
Conclusions
Our findings suggest that MPE may be driven by a Warburg metabolic phenotype. The key enzymes promoting the Warburg phenotype: HK2, PKM2, and PDK are targetable by small molecule inhibitors/activators, and should be considered for evaluation in future clinical trials for MPE.
Keywords: Ependymoma, CNS, Myxopapillary, Cancer, Metabolism
INTRODUCTION
Ependymoma is an incurable malignancy in 45% of patients. It can arise within the entire central nervous system, and can manifest in both children and adults. While intracranial ependymomas predominate in childhood, spinal ependymomas are commonly observed from adolescence through to adulthood(1). Spinal ependymomas are generally slow-growing tumours, and are divided mainly into Grade I tumours, with myxopapillary histology, or Grade II tumours with more classic histological features(2). Myxopapillary ependymomas (MPE) are a distinct histological variant, arising in specific regions of the spine including the conus medullaris, cauda equina, or filum terminale(3). Despite an overall favorable prognosis, and classification as a Grade I tumour, MPE have been associated with distant metastases, subarachnoid disseminations, and late recurrences particularly in the pediatric population(4–10). Currently the only effective treatment for MPE is complete resection, while the benefits of radiation and chemotherapy remain unclear(11). Furthermore, given the location of these tumours in the spinal cord, the morbidity associated with surgery is high, placing patients at significant risk of incontinence, impotence, and paralysis. Compared to other ependymoma subtypes, the genetic basis of MPE is poorly characterized, thereby hindering the identification of pathways and ‘actionable’ drug targets(12–15). This challenge is further complicated by a difficulty in establishing in vitro and in vivo models of MPE. To this end, we characterized the genomic (n=46) and transcriptional (n=35) landscape of a total of 52 primary spinal ependymomas, in an effort to elucidate the molecular underpinnings of MPE, and to identify new leads for rationale targeted therapy.
MATERIALS AND METHODS
Tumour sample isolation and preparation
Clinical samples and data were utilized in accordance with research ethics board approval from both The Hospital of Sick Children (Toronto, Ontario) and DKFZ (Heidelberg, Germany). Informed consent was obtained from all patients in this study. Adult and fetal spine protein samples were purchased from Biochain. Detailed patient and sample information can be found in the Supplementary Table S1.
Copy number data processing and analysis
Genomic DNA and RNA from fresh frozen tumours were isolated according to the same procedures described by Witt and Mack et al., 2011. Genomic DNA was hybridized to Affymetrix SNP6.0 microarrays according to manufacturers instructions and pre-processed according to methods described in Witt and Mack et al., 2011. Median centering of copy number probes was performed before summarization and visualization using Integrated Genome Viewer (Broad Institute). Significant focal regions of gain or loss were identified by GISTIC2 (16).
Gene expression data processing and analysis
RNA was hybridized to Affymetrix Gene 1.0ST microarrays according to manufacturers instructions. Array data was preprocessed using the same methods described by Witt and Mack et al., 2011. Consensus hierarchical clustering (HCL, R package: ConsensusClusterPlus) was performed using 1000 genes exhibiting the greatest median absolute deviation, and 5000 genes for consensus non-negative matrix factorization (R package: NMF). Silhouette analysis was used to evaluate sample membership following consensus HCL, and SigClust was used to determine statistical significance of subgroups. A comparison was made between consensus HCL and NMF using a Rand Index, and assessed statistically by permutation of sample labels and repetition of the Rand Index calculation in order to generate a null distribution.
Pathway analysis of gene expression data
Gene set enrichment analysis was performed using gene sets described in Witt and Mack et al., 2011 and visualized using Cytoscape: EnrichmentMap(17, 18). Single Sample GSEA was also performed (Broad: GenePattern) to evaluate pathways and biological samples over-represented in individual samples(19). A Wilcoxon-Rank sum test was used, with FDR correction (Benjamini-Hochberg method), to compare the pathways/processes differentially activated between Myxopapillary and Grade II spinal ependymoma.
Western blot analysis
Tumour samples were lysed in PLC lysis buffer containing protease and phosphatase inhibitors (Sigma-Aldrich). Protein concentration was determined using the BCA (bicinchoninic acid) assay (Thermo Fisher Scientific). 30 µg of protein lysate were loaded into 10 or 12% SDS-PAGE gels. Proteins were then transferred onto PVDF membrane (NEN Research Products) using a semi-dry transfer apparatus (Bio-Rad Laboratories). Membranes were blocked in 5% milk TBST or 5% BSA TBST as per manufacturer instructions for an hour and probed for varying proteins at 4°C overnight. See Supplementary Table S2 for dilutions and suppliers. After incubation, membranes were washed in TBST (3 × 10 min washes) and incubated with horseradish peroxidase–conjugated antibodies against the species the primary antibody was raised against (Bio-Rad Laboratories). Protein detection and quantification was performed by using Chemi-luminescence Reagent Plus (PerkinElmer) using the Alpha Imager HP imaging system for non-saturated densitometric analysis and exposure to X-ray film.
Immunohistochemistry Staining
A non-overlapping cohort of 39 spinal ependymomas was analyzed by immunohistochemistry (IHC) for PKM2 protein expression (Schebo Bio) as previously reported(20). Tumours were assigned a score from 0–3 based upon the following criteria: 0: ≤ 5% positivity, 1: > 5% but < 25% positivity, 2: 25% to 75% positivity, 3: ≥ 75% positivity. Because our initial hypothesis was that PKM2 expression is elevated in spinal MPEs, we used a one-sided Wilcoxon-rank sum test to compare the scoring results in our independent cohort of spinal tumors analyzed by IHC.
Hexokinase and Pyruvate Kinase assay
Tumour samples were lysed in 100ul of the following buffer: 50 mM potassium phosphate, 2 mM dithiothreitol (DTT), 2 mM EDTA, and 20 mM sodium fluoride. Tumour homogenate was incubated on ice for 30 min, followed by centrifugation at 1,000 g at 4°C for 10 min. 20 µg of fresh lysate was used to measure hexokinase activity using the BioVision Hexokinase Colorimetric Assay Kit (Catalog # K789-100). 20ug of fresh lysate was also used to measure pyruvate kinase activity (Catalog #K709-100).
Lactate Measurements
Lactate measurements of frozen tumour samples were performed according to manufacturer’s protocol and normalized ug lysate (Eton Bioscience).
Statistics relating to western blots and functional assays
Western blot analysis, chemi-luminescent quantification of protein, lactate measurements, hexokinase and pyruvate kinase assays were performed in triplicate with mean and standard error of the mean (SEM) reported. Analysis of variance (ANOVA), was performed for multiple comparisons with post-tukey analysis for pairwise comparisons. Student’s T-test was used for direct pairwise comparisons. Significance was established as P<0.05.
Microarray data is deposited on Gene Expression Omnibus (GEO) under the identification number: GSE66787.
RESULTS
Grade II and myxopapillary spinal ependymoma are molecularly distinct
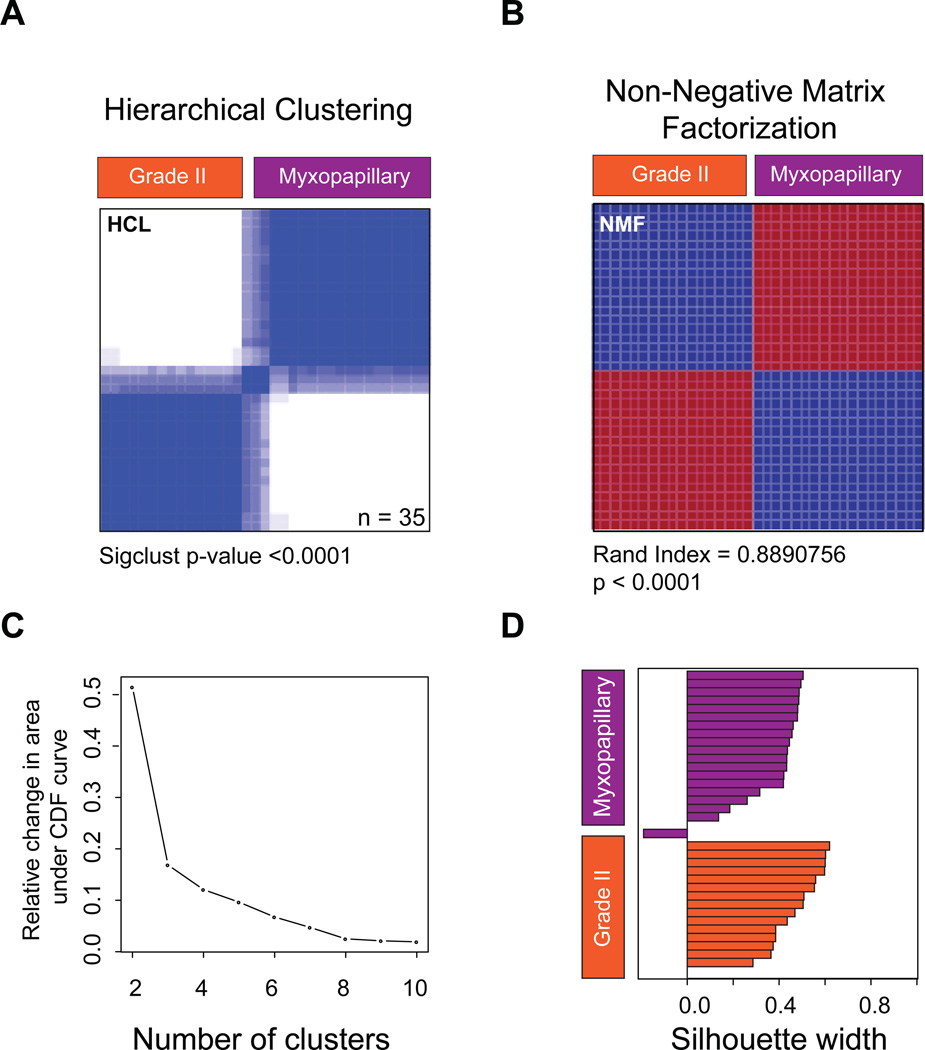
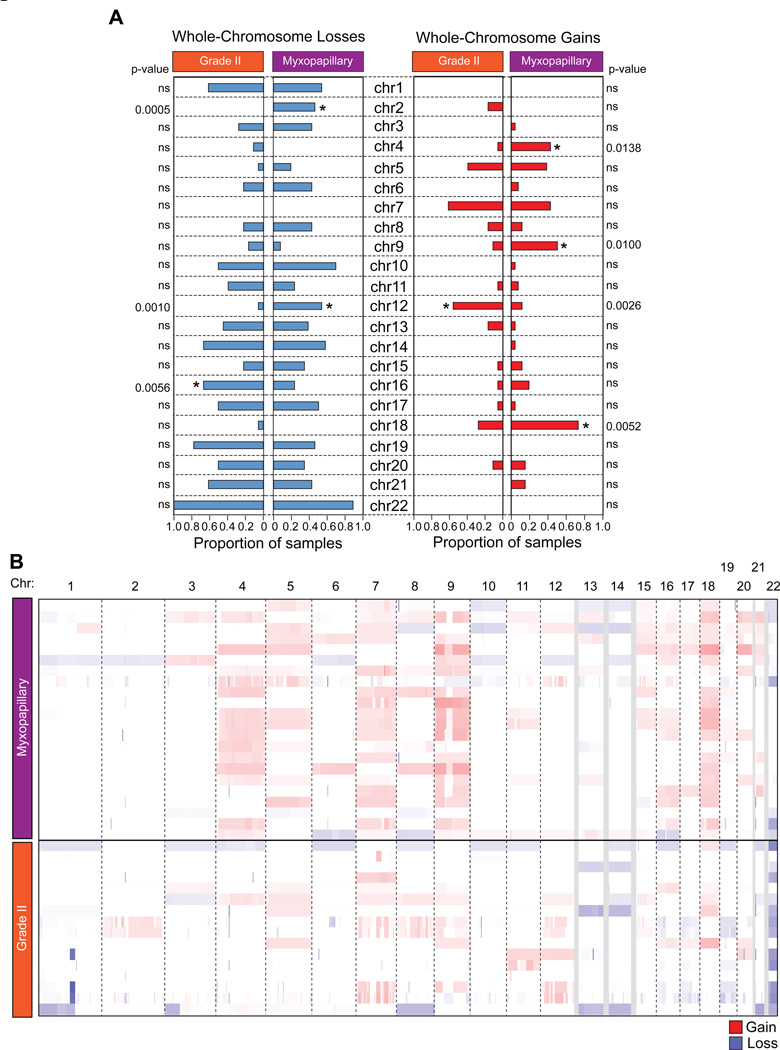
Our cohort of 52 spinal ependymomas consisted of 24 tumours, which were histologically classified as myxopapillary ependymoma (MPE), 20 tumours as Grade II ependymomas, 1 tumour as Grade III ependymoma, and 7 tumours for which a histological diagnosis was unavailable. To delineate the transcriptional heterogeneity between patients with spinal ependymoma, we performed gene expression profiling on 35 primary tumours (Supplementary Table S1,3). Using two distinct unsupervised consensus clustering approaches, hierarchical clustering and non-negative matrix factorization, we demonstrate that Grade II ependymoma and MPE of the spine are transcriptionally distinct (Figure 1A–D, Supplementary Figure S1). We next characterized the somatic copy number landscape of Grade II and MPE by profiling 46 primary spinal tumours using the Affymetrix SNP 6.0 DNA microarrays. In both Grade II and MPE we determined that majority of chromosomal aberrations involved whole chromosome gains and losses, suggesting aneuploidy, while chromosomal arm and focal aberrations were less common (Figure 2A–B, Supplementary Figure S2). Despite convergent chromosomal gains and losses, Grade II and MPE spinal ependymoma were characterized by distinct somatic copy number alterations (SCNAs), with Grade II ependymomas harboring specific loss of chr16 and gain of chr12, and with MPE harboring specific losses of chr2 and chr12 and gains of chr4, chr9, and chr18 (Figure 2A–B). Additionally, we found that the majority of spinal ependymomas were characterized by loss of chromosome 22, with an increase towards homozygous loss in spinal Grade II versus MPE (Figure 2A–B). In a pattern similar to pediatric ependymoma, focal copy number alterations were highly infrequent. (Supplementary Figure 2A and Supplementary Table S4–5). The only focal and recurrent amplification was observed specifically in MPE (2/22 cases) encompassing the entire uncharacterized transcript C15ORF54 (Supplementary Figure S2A,C). In line with previous studies, non-recurrent statistically significant gains were observed in EGFR, and non-recurrent chromosomal losses were observed in AKAP12, TGIF, and UBB (Supplementary Figure 2B). We conclude that spinal Grade II and MPE are ependymoma entities harboring molecularly distinct transcriptomic and SCNA profiles.
Figure 1. Grade II and myxopapillary spinal ependymomas are transcriptionally distinct.
(A) Unsupervised consensus hierarchical clustering of 35 primary spinal ependymoma gene expression profiles generated by Affymetrix Gene 1.0ST microarrays. Shown is a rank 2 classification. Significance of clustering was measured using SigClust.
(B) Unsupervised non-negative matrix factorization of 35 spinal ependymoma gene expression profiles. Shown is a rank 2 classification. Sample overlap between consensus HCL and NMF was measured using a Rand index.
(C) Area under the cumulative distribution function curve indicating 2 principal subgroups of spinal ependymomas.
(D) Silhouette analysis identifies ‘core’ representative samples within the 2 subgroups of spinal ependymoma
Figure 2. Grade II and myxopapillary spinal ependymomas harbor distinct copy number landscapes.
(A) Bar graphs of whole chromosomal gains and losses in Grade II versus spinal myxopapillary ependymomas. Gains are show in red and losses in blue.
(B) Genome-wide view of copy number alterations in 46 spinal ependymomas generated by Affymetrix SNP6.0 DNA microarrays sub-divided by Grade II and myxopapillary spinal ependymoma. Gains are show in red and losses in blue.
Spinal myxopapillary ependymoma are characterized by increased gene expression of metabolic networks
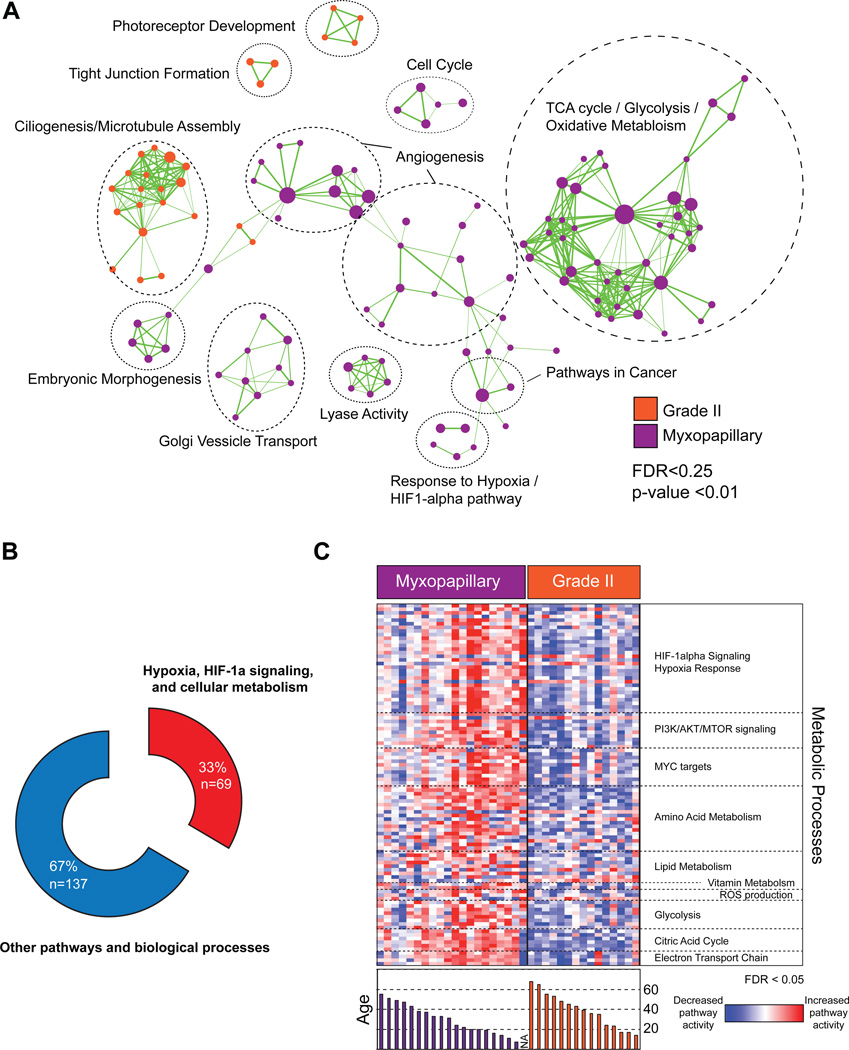
To identify the biological processes and signaling pathways distinguishing spinal Grade II and MPE we performed Gene Set Enrichment Analysis and visualized enriched pathways using Cytoscape EnrichmentMap(14, 17, 18). We found that pathways involved in photoreceptor development, tight junction formation, and ciliogenesis/microtubule assembly defined spinal Grade II ependymomas (Figure 3A, Supplementary Table S6). In spinal MPE, we discovered an unexpected link to pathways involving angiogenesis, HIF-1α/hypoxia signaling, and cellular metabolism, which represented 33% of all genesets, enriched in the subgroup (Figure 3A,B, Supplementary Table S7, Supplementary Figure 3A,B). Using single-sample GSEA we next attempted to identify patients who harbored elevated metabolic gene expression and whether there was a correlation with demographic parameters. Comparing between spinal MPE and Grade II ependymomas we demonstrated significant over-expression of numerous pathways involving HIF-1α/Hypoxia signaling, PI3K/AKT/MTOR signaling, MYC signaling, reactive oxygen species production, glycolysis, citric acid cycle, mitochondrial electron transport, and amino acid, vitamin and lipid metabolism (Figure 3C). Further, these pathways were enriched in the youngest patients, who represent the age group associated with increased incidence of relapse and metastatic dissemination (Figure 3C)(7). We conclude that spinal MPE are characterized by increased gene expression of metabolic networks occurring preferentially in the pediatric population and young adulthood.
Figure 3. Pathway analysis identifies over-representation of metabolic gene sets in myxopapillary ependymoma.
(A) Cytoscape enrichment map of significant genesets distinguishing Grade II versus myxopapillary spinal ependymomas identified by Gene Set Enrichment Analysis (GSEA) and visualized in Cytoscape. A statistical significance cutoff of p < 0.01 and FDR < 0.25 was used for the pathway analysis
(B) Donut plot demonstrating significant over-representation of pathways and biological processes in involving hypoxia signaling and cellular metabolism in myxopapillary spinal ependymoma
(C) Single sample GSEA demonstrating subgroup-specific over-representation of pathways and biological processes involving cellular metabolism and hypoxia signaling. Bar graph of the ages of patients is shown in the lower panel.
Spinal myxopapillary ependymoma are defined by a ‘Warburg’ phenotype
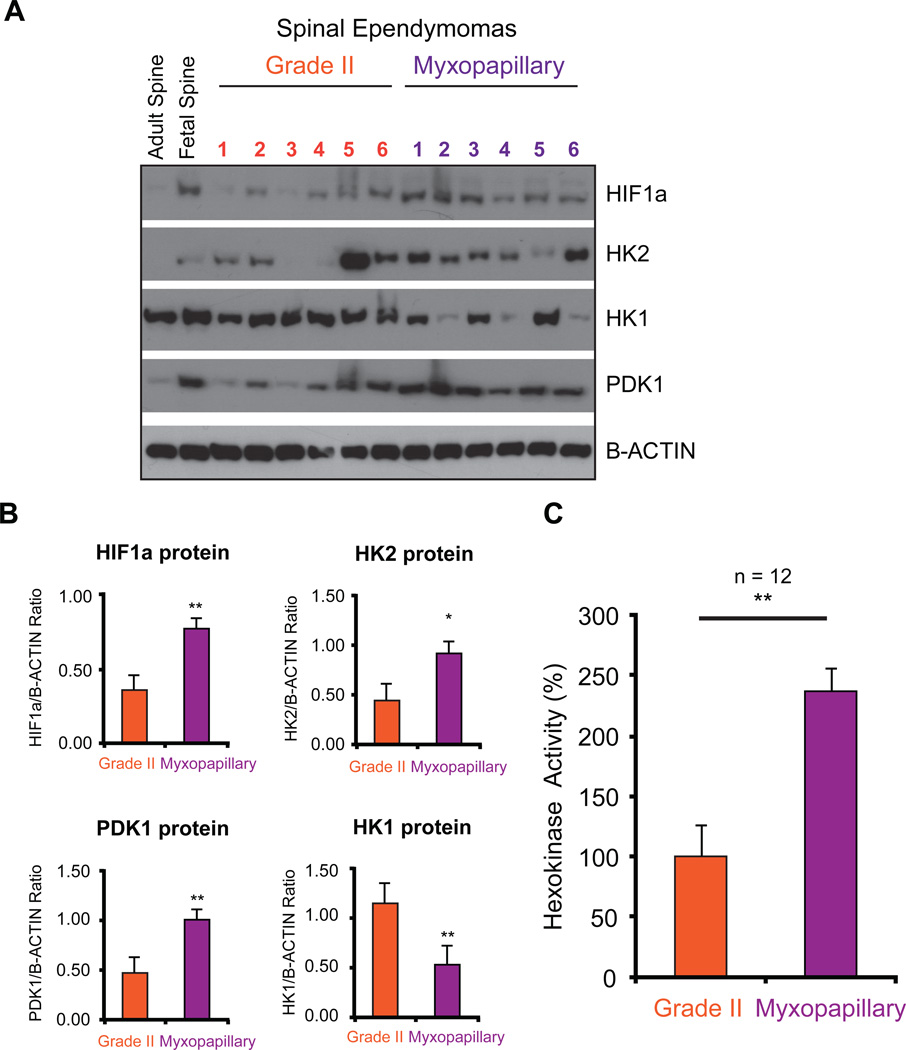
To validate the metabolic signature observed transcriptionally in spinal MPE, we performed western blot analysis coupled with linear protein quantification by chemi-luminescence. We first examined a central metabolic transcription factor, hypoxia inducible factor 1-alpha (HIF-1α), and demonstrated that spinal MPE exhibited increased HIF-1α expression compared to spinal Grade II ependymomas and adult normal spinal tissue (Figure 4A,B, Supplementary Figure 3A,B). These results were supported by increased protein expression of Pyruvate Dehydrogenase Lipoamide Kinase Isozyme 1 (PDK1), increased Hexokinase 2 (HK2) expression and decreased Hexokinase 1 (HK1) (Figure 4A,B, Supplementary Figure S4).
Figure 4. Validation of pathway analysis characterizing a metabolic signatures enriched in myxopapillary spinal ependymomas.
(A) Western blot validation of up-regulation of HIF-1α, HK2, PDK1, and decreased expression of HK1.
(B) Linear quantification of protein expression levels detected relating to proteins in Figure 4A.
(C) Increased HK2 activity in myxopapillary spinal ependymomas measured from primary tumor lysates as compared to Grade II tumours (n = 12).
Given the lack of established and available cell lines, short-term cultures, and in vivo models of myxopapillary ependymoma, we used the matched primary samples to analyze the enzymatic activity levels associated with over-expression of ‘Warburg’ signature metabolic proteins. Concordant with an increase in HK2 protein expression we observed an increase in total HK activity specifically in spinal MPE (Figure 4C). Together these findings predict a shift towards elevated glycolysis and possible lactate accumulation, described as a ‘Warburg’ phenotype(21).
Spinal myxopapillary ependymoma demonstrate a 'Warburg' phenotype through elevated PKM2 expression and lactate production
The pyruvate dehydrogenase complex catalyzes the overall conversion of pyruvate to acetyl-CoA and carbon dioxide, and thereby links the glycolytic pathway to the tri-carboxylic cycle. These enzymes are frequently phosphorylated and inhibited in cancers by PDK1 thus promoting the ‘Warburg’ effect. In spinal MPE, we observed a specific increase in phosphorylation of Pyruvate Dehydrogenase E1α subunit (PDHE1α), thus validating the metabolic networks over-represented in Figure 3 (Supplementary Figure S5).
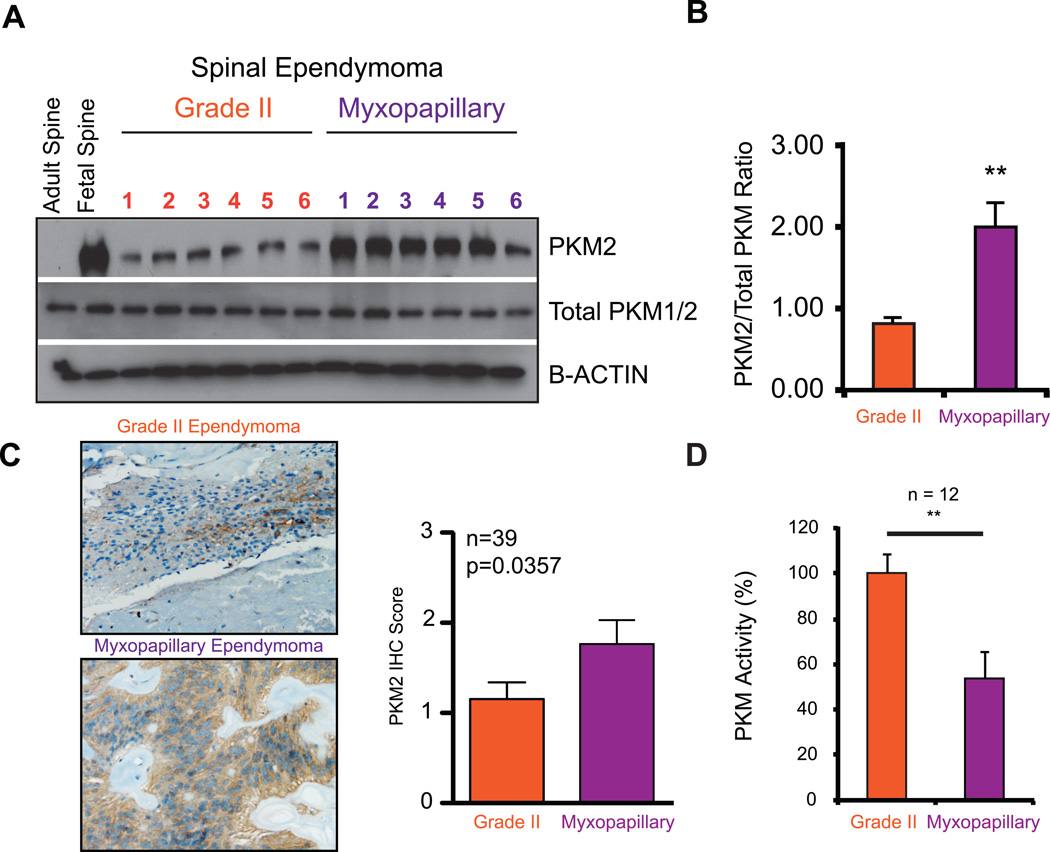
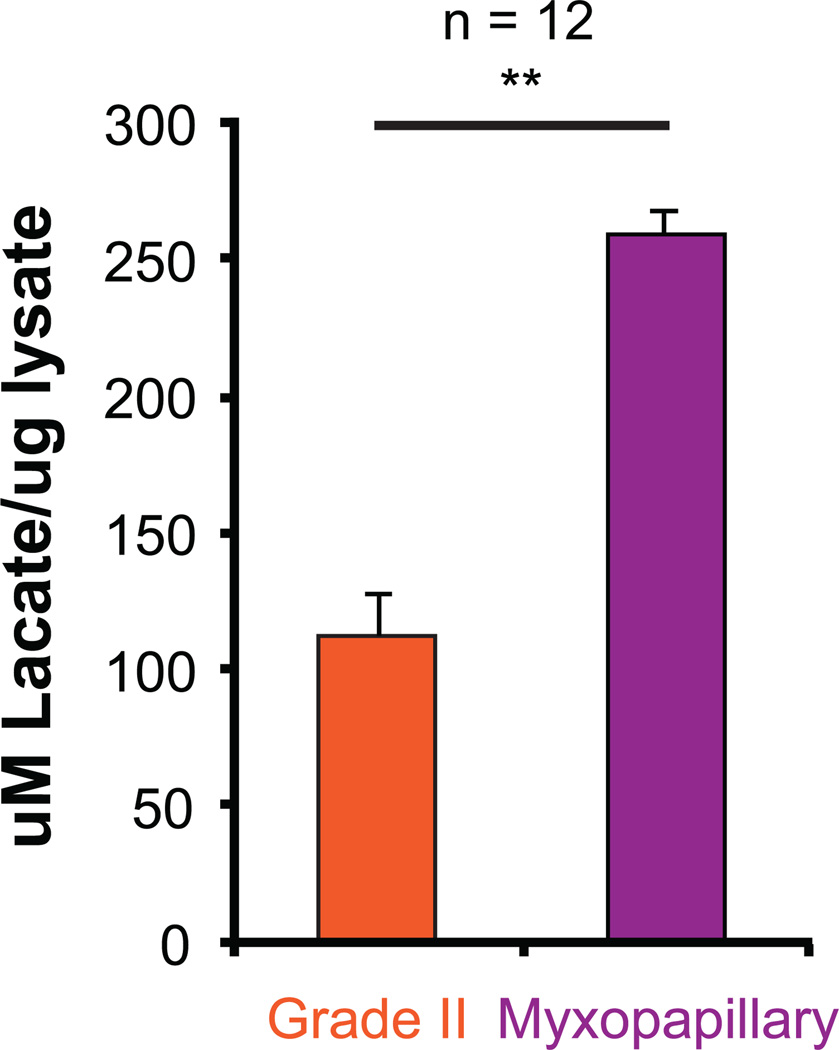
A characteristic feature of tumors exhibiting a 'Warburg' phenotype is a metabolic switch from pyruvate kinase muscle isozyme isoform M1 to M2 expression. In MPE, we observed a specific increase in pyruvate kinase muscle isozyme isoform M2 (PKM2) expression compared to total PKM protein levels, providing supportive evidence of a ‘Warburg’ phenotype(2) (Figure 5A–C). Using immunohistochemical staining of PKM2 protein, in a non-overlapping cohort of spinal ependymomas (n=39), we observed a significant enrichment of PKM2 expression in spinal MPE tumours (Figure 5C). Finally, we observed a decrease in total PKM activity in spinal MPE, which overexpress PKM2 protein (Figure 5D). This is consistent with PKM2 being a less active isoform, thereby allowing cells to accumulate metabolites for cellular growth and division(2). Finally, we demonstrate that spinal MPE exhibit increased lactate accumulation consistent with increased glycolysis and a ‘Warburg’ phenotype (Figure 6, Supplementary Figure S4).
Figure 5. Spinal MPE demonstrate increased PKM2 expression and decreased overall PKM activity consistent with a 'Warburg' phenotype.
(A) Protein validation of increased PKM2 protein expression relative to total PKM1 and PKM2 proteins as demonstrated by western blot analysis.
(B) Linear quantification of PKM2 levels relative to total PKM1/2 demonstrated in Figure 5A.
(C) Immunohistochemistry for PKM2 expression in a representative spinal Grade II and myxopapillary ependymoma (left panel). Bar graph comparing immunohistochemistry scores in a cohort of 39 non-overlapping spinal ependymomas (right panel).
(D) Decreased PKM activity in myxopapillary spinal ependymomas measured from primary tumor lysates as compared to Grade II tumours (n = 12).
Figure 6. Spinal MPE exhibit increased lactate production consistent with anaerobic glycolysis and a 'Warburg' phenotype.
Increased lactate production in myxopapillary spinal ependymomas measured from primary tumor lysates as compared to Grade II tumours (n = 12).
DISCUSSION
Spinal myxopapillary ependymomas (MPE) although having a generally favorable prognosis, are refractory to radiotherapy, and depend largely upon surgical resection to reduce the odds of tumour relapse. Furthermore, spinal MPE in the pediatric population have been shown to exhibit an increased incidence of relapse and metastatic dissemination(7). Given the difficulty in establishing in vitro and in vivo models of spinal MPE, evaluating biological mechanisms and targets for therapy have been challenging.
In this report, we have leveraged transciptomic and genomic technologies to examine a cohort of 52 spinal ependymomas in an effort to delineate the genetic basis of this disease, with an ultimate goal of identifying novel treatment modalities. We demonstrate that spinal Grade II and MPE are histologically, transcriptionally, and genetically distinct tumour entities. While both tumours demonstrate similar patterns of whole-chromosome loss, suggesting aneuploidy, they are characterized by disparate genomic alterations with Grade II tumours characterized by loss of chr16 and gain of chr12, and spinal MPE by loss of chr2 and chr12, and gain of chr4, chr9, and chr18. In line with previous genomic characterizations of ependymoma, focal and recurrent copy number alterations were rare, with the exception of C15ORF54 amplification found exclusively in spinal MPE (12, 14, 22, 23). The only other amplification encompassing an entire gene, albeit occurring in a single tumour, involved EGFR, which has been shown in previous reports to be amplified and potentially associated with poor clinical outcome in spinal MPE(24). Focal and statistically significant deletions were also observed in single tumours involving AKAP12, TGIF, and UBB.
Spinal Grade II ependymomas harbor a variety of NF2 mutations, and in our study, were found to exhibit increased homozygous or clonal loss of chromosome 22 as compared to spinal MPE (25, 26). In addition to the genomic differences, we demonstrate that spinal Grade II ependymoma and MPE are transcriptionally distinct. Specifically, spinal Grade II ependymoma are characterized largely by pathways involved in ciliogenesis and microtubule assembly consistent with our previous findings(14). Conversely, we found that spinal MPE are defined by up-regulation of metabolic networks involving HIF-1α /Hypoxia signaling, PI3K/AKT/MTOR signaling, MYC signaling, reactive oxygen species production, glycolysis, citric acid cycle, mitochondrial electron transport, and amino acid, vitamin and lipid metabolism. These MPE specific pathways were enriched in younger patients, who may be at greater risk of tumour dissemination. Our transcriptional findings were confirmed by increased protein expression of HIF-1α, HK2, PDK1, and a decrease in HK1. Further, an increase in HK2 expression was associated with elevated hexokinase activity, an indication of elevated glycolysis in spinal MPE. These proteins may represent potential avenues for drug inhibition in spinal MPE such as Lonidamine targeting hexokinase activity and Dichloroacetate targeting PDK1 (27).
HIF-1α protein is a central mediator of the hypoxic response in normal cells and its expression is regulated predominantly by oxygen dependent hydroxylation, a modification necessary for proteosomal degradation. In spinal MPE we observed consistent up-regulation of HIF-1α transcript despite varied protein stability (Supplementary Figure 3A,B). This suggests that the mechanisms regulating HIF-1α protein stability are still active in at least a subset of spinal MPEs.
We also observed a specific increase in protein expression of PKM2 compared to total PKM levels in spinal MPE, a metabolic switch observed in tumours characterized by a ‘Warburg’ phenotype(2, 21). This was supported by activity assays demonstrating a decrease in overall PKM activity, associated with potential accumulation of metabolites needed for macromolecule and nucleotide synthesis. PKM2 activators have also been identified, such as TEPP46 and DASA58, which may represent additional therapeutic leads for treatment of spinal MPE (Supplementary Figure S6)(28). Our findings demonstrate that targeting tumor metabolism represents a novel therapeutic strategy for treatment of spinal MPEs. It should also be noted that many of these agents such as Lonidamine, Dichloroacetate, DASA58, and TEPP46, despite promise in various pre-clinical cancer models, have only recently entered clinical trials and efficacy in patients is still under evaluation.
Together our findings suggest that spinal MPE may be characterized by a Warburg phenotype as demonstrated by a specific increase in tumour lactate production. In addition, the key enzymes promoting the Warburg phenotype: HK2, PKM2, and PDK are targetable by specific small molecule inhibitors/activators. This may represent a novel treatment strategy that should be evaluated in pre-clinical studies as potential therapy for spinal myxopapillary ependymoma.
Supplementary Material
TRANSLATIONAL RELEVANCE.
Myxopapillary ependymoma (MPE) is a distinct tumour entity arising predominantly in the spinal cord. Despite an overall favorable prognosis, distant metastases and late recurrences have been reported, especially in the pediatric population. Currently the only effective treatment for MPE is a complete resection. Thus, in an effort to delineate the genetic basis of MPE, and identify novel therapeutic leads, we characterized the genomic and transcriptional landscape of 52 primary spinal ependymomas. In this study, we demonstrate that MPE may be defined by a ‘Warburg’ phenotype as evidenced by increased protein expression of HIF-1α, HK2, PDK1, and PKM2, concordant with elevated activity of numerous metabolic processes. These findings were supported functionally by decreased PKM activity, increased HK activity, and elevated lactate production. Our findings suggest that MPE may be characterized by a ‘Warburg’ phenotype providing rationale for evaluation of glycolysis inhibitors in future clinical trials.
ACKNOWLEDGEMENTS
MDT holds a Canadian Institutes of Health Research Clinician-Scientist Phase II Award, was a Sontag Foundation Distinguished Scholar, and is supported by The Garron Family Chair in Childhood Cancer Research. S.M. and X.W. are supported by Vanier Scholarships from the Canadian Institutes of Health Research.
FINANCIAL SUPPORT
MDT is supported by grants from the Cure Search Foundation, The Younger Foundation, the National Institutes of Health (R01CA148699, and R01CA159859), The Pediatric Brain Tumor Foundation, The Canadian Cancer Society, The Terry Fox Research Institute, and Brainchild.
Footnotes
Conflicts of Interest:
The authors of this manuscript have no conflicts of interest to disclose.
REFERENCES
- 1.Vera-Bolanos E, Aldape K, Yuan Y, Wu J, Wani K, Necesito-Reyes MJ, et al. Clinical course and progression-free survival of adult intracranial and spinal ependymoma patients. Neuro-oncology. 2014 doi: 10.1093/neuonc/nou162. [Epub ahead of Print]. [DOI] [PMC free article] [PubMed] [Google Scholar]
- 2.Christofk HR, Vander Heiden MG, Harris MH, Ramanathan A, Gerszten RE, Wei R, et al. The M2 splice isoform of pyruvate kinase is important for cancer metabolism and tumour growth. Nature. 2008;452:230–233. doi: 10.1038/nature06734. [DOI] [PubMed] [Google Scholar]
- 3.Louis DN, Ohgaki H, Wiestler OD, Cavenee WK, Burger PC, Jouvet A, et al. The 2007 WHO classification of tumours of the central nervous system. Acta neuropathologica. 2007;114:97–109. doi: 10.1007/s00401-007-0243-4. [DOI] [PMC free article] [PubMed] [Google Scholar]
- 4.Mridha A, Sharma M, Sarkar C, Suri V, Rishi A, Garg A, et al. Myxopapillary ependymoma of lumbosacral region with metastasis to both cerebellopontine angles: report of a rare case. Child's nervous system : ChNS : official journal of the International Society for Pediatric Neurosurgery. 2007;23:1209–1213. doi: 10.1007/s00381-007-0423-5. [DOI] [PubMed] [Google Scholar]
- 5.Ilhan A, Furtner J, Birner P, Rössler K, Marosi C, Preusser M. Myxopapillary ependymoma with pleuropulmonary metastases and high plasma glial fibrillary acidic protein levels. Journal of clinical oncology : official journal of the American Society of Clinical Oncology. 2011;29:7. doi: 10.1200/JCO.2011.36.6401. [DOI] [PubMed] [Google Scholar]
- 6.Higgins G, Smith C, Summers D, Statham P, Erridge S. Myxopapillary ependymoma with intracranial metastases. British journal of neurosurgery. 2005;19:356–358. doi: 10.1080/02688690500305373. [DOI] [PubMed] [Google Scholar]
- 7.Fassett D, Pingree J, Kestle J. The high incidence of tumor dissemination in myxopapillary ependymoma in pediatric patients. Report of five cases and review of the literature. Journal of neurosurgery. 2005;102:59–64. doi: 10.3171/ped.2005.102.1.0059. [DOI] [PubMed] [Google Scholar]
- 8.Al-Hussaini M, Herron B. Metastasizing myxopapillary ependymoma. Histopathology. 2005;46:469–470. doi: 10.1111/j.1365-2559.2004.02009.x. [DOI] [PubMed] [Google Scholar]
- 9.Weber DC, Wang Y, Miller R, Villa S, Zaucha R, Pica A, et al. Long-term outcome of patients with spinal myxopapillary ependymoma: treatment results from the MD Anderson Cancer Center and institutions from the Rare Cancer Network. Neuro-oncology. 2014 doi: 10.1093/neuonc/nou293. [Epub ahead of print]. [DOI] [PMC free article] [PubMed] [Google Scholar]
- 10.Fegerl G, Marosi C. Stabilization of metastatic myxopapillary ependymoma with sorafenib. Rare Tumors. 2012;4:e42. doi: 10.4081/rt.2012.e42. [Epub 2012 Sep 6]. [DOI] [PMC free article] [PubMed] [Google Scholar]
- 11.Al-Habib A, Al-Radi O, Shannon P, Al-Ahmadi H, Petrenko Y, Fehlings M. Myxopapillary ependymoma: correlation of clinical and imaging features with surgical resectability in a series with long-term follow-up. Spinal cord. 2011;49:1073–1078. doi: 10.1038/sc.2011.67. [DOI] [PubMed] [Google Scholar]
- 12.Johnson RA, Wright KD, Poppleton H, Mohankumar KM, Finkelstein D, Pounds SB, et al. Cross-species genomics matches driver mutations and cell compartments to model ependymoma. Nature. 2010;466:632–636. doi: 10.1038/nature09173. [DOI] [PMC free article] [PubMed] [Google Scholar]
- 13.Wani K, Armstrong TS, Vera-Bolanos E, Raghunathan A, Ellison D, Gilbertson R, et al. A prognostic gene expression signature in infratentorial ependymoma. Acta neuropathologica. 2012;123:727–738. doi: 10.1007/s00401-012-0941-4. [DOI] [PMC free article] [PubMed] [Google Scholar]
- 14.Witt H, Mack SC, Ryzhova M, Bender S, Sill M, Isserlin R, et al. Delineation of two clinically and molecularly distinct subgroups of posterior fossa ependymoma. Cancer cell. 2011;20:143–157. doi: 10.1016/j.ccr.2011.07.007. [DOI] [PMC free article] [PubMed] [Google Scholar]
- 15.Mack SC, Witt H, Wang X, Milde T, Yao Y, Bertrand KC, et al. Emerging insights into the ependymoma epigenome. Brain pathology. 2013;23:206–209. doi: 10.1111/bpa.12020. [DOI] [PMC free article] [PubMed] [Google Scholar]
- 16.Mermel CH, Schumacher SE, Hill B, Meyerson ML, Beroukhim R, Getz G. GISTIC2.0 facilitates sensitive and confident localization of the targets of focal somatic copy-number alteration in human cancers. Genome biology. 2011;12:R41. doi: 10.1186/gb-2011-12-4-r41. [DOI] [PMC free article] [PubMed] [Google Scholar]
- 17.Merico D, Isserlin R, Stueker O, Emili A, Bader GD. Enrichment map: a network-based method for gene-set enrichment visualization and interpretation. PloS one. 2010;5:e13984. doi: 10.1371/journal.pone.0013984. [DOI] [PMC free article] [PubMed] [Google Scholar]
- 18.Subramanian A, Tamayo P, Mootha VK, Mukherjee S, Ebert BL, Gillette MA, et al. Gene set enrichment analysis: a knowledge-based approach for interpreting genome-wide expression profiles. Proceedings of the National Academy of Sciences of the United States of America. 2005;102:15545–15550. doi: 10.1073/pnas.0506580102. [DOI] [PMC free article] [PubMed] [Google Scholar]
- 19.Reich M, Liefeld T, Gould J, Lerner J, Tamayo P, Mesirov JP. GenePattern 2.0. Nature genetics. 2006;38:500–501. doi: 10.1038/ng0506-500. [DOI] [PubMed] [Google Scholar]
- 20.Mukherjee J, Phillips JJ, Zheng S, Wiencke J, Ronen SM, Pieper RO. Pyruvate kinase M2 expression, but not pyruvate kinase activity, is up-regulated in a grade-specific manner in human glioma. PloS one. 2013;8:e57610. doi: 10.1371/journal.pone.0057610. [DOI] [PMC free article] [PubMed] [Google Scholar]
- 21.Vander Heiden MG, Cantley LC, Thompson CB. Understanding the Warburg effect: the metabolic requirements of cell proliferation. Science (New York, NY) 2009;324:1029–1033. doi: 10.1126/science.1160809. [DOI] [PMC free article] [PubMed] [Google Scholar]
- 22.Mack SC, Taylor MD. The genetic and epigenetic basis of ependymoma. Child's nervous system : ChNS : official journal of the International Society for Pediatric Neurosurgery. 2009;25:1195–1201. doi: 10.1007/s00381-009-0928-1. [DOI] [PubMed] [Google Scholar]
- 23.Taylor MD, Poppleton H, Fuller C, Su X, Liu Y, Jensen P, et al. Radial glia cells are candidate stem cells of ependymoma. Cancer cell. 2005;8:323–335. doi: 10.1016/j.ccr.2005.09.001. [DOI] [PubMed] [Google Scholar]
- 24.Mendrzyk F, Korshunov A, Benner A, Toedt G, Pfister S, Radlwimmer B, et al. Identification of gains on 1q and epidermal growth factor receptor overexpression as independent prognostic markers in intracranial ependymoma. Clinical cancer research : an official journal of the American Association for Cancer Research. 2006;12:2070–2079. doi: 10.1158/1078-0432.CCR-05-2363. [DOI] [PubMed] [Google Scholar]
- 25.Bettegowda C, Agrawal N, Jiao Y, Wang Y, Wood LD, Rodriguez FJ, et al. Exomic sequencing of four rare central nervous system tumor types. Oncotarget. 2013;4:572–583. doi: 10.18632/oncotarget.964. [DOI] [PMC free article] [PubMed] [Google Scholar]
- 26.Ebert C, von Haken M, Meyer-Puttlitz B, Wiestler OD, Reifenberger G, Pietsch T, et al. Molecular genetic analysis of ependymal tumors. NF2 mutations and chromosome 22q loss occur preferentially in intramedullary spinal ependymomas. The American journal of pathology. 1999;155:627–632. doi: 10.1016/S0002-9440(10)65158-9. [DOI] [PMC free article] [PubMed] [Google Scholar]
- 27.Tennant DA, Duran RV, Gottlieb E. Targeting metabolic transformation for cancer therapy. Nature reviews Cancer. 2010;10:267–277. doi: 10.1038/nrc2817. [DOI] [PubMed] [Google Scholar]
- 28.Anastasiou D, Yu Y, Israelsen WJ, Jiang JK, Boxer MB, Hong BS, et al. Pyruvate kinase M2 activators promote tetramer formation and suppress tumorigenesis. Nature chemical biology. 2012;8:839–847. doi: 10.1038/nchembio.1060. [DOI] [PMC free article] [PubMed] [Google Scholar]
Associated Data
This section collects any data citations, data availability statements, or supplementary materials included in this article.


