

Abstract
Objective
Mechanisms underlying the cardiovascular risk of Lipoprotein(a), Lp(a), are poorly understood. We investigated the relationship of apo(a) size, Lp(a) and allele-specific apo(a) levels with HIV disease activity parameters in a bi-ethnic population.
Methods and Results
Lp(a) and allele-specific apo(a) levels were determined in 139 white and 168 black HIV-positive patients. Plasma HIV RNA viral load (pVL) and CD4+ T-cell count were used as surrogates for disease activity. Lp(a) and allele-specific apo(a) levels were higher in blacks than whites (for both P<0.001). Apo(a) allele size distribution was similar between the two ethnic groups with a median apo(a) size of 28 kringle 4 (K4) repeats. Allele-specific apo(a) levels were positively associated with CD4+ T-cell count (P=0.027) and negatively with pVL (P<0.001). Further, allele-specific apo(a) levels associated with smaller (<28 K4) atherogenic apo(a) sizes were higher in subjects with CD4+ T-cell counts of ≥350 (P=0.002).
Conclusions
Allele-specific apo(a) levels were higher in subjects with high CD4+ T-cell count or low pVL. The findings suggest that HIV disease activity reduced allele-specific apo(a) levels. Higher allele-specific apo(a) levels associated with atherogenic small apo(a) sizes might contribute to increased cardiovascular risk in HIV-positive subjects with improved disease status.
Keywords: Lp(a), apo(a) size, HIV, CD4+ T-cells, cardiovascular risk
Cardiovascular disease (CVD) is the number one cause of mortality worldwide and in the United States alone more than 2200 people die of CVD each day, an average of one death every 39 seconds.1 It is projected that annual global CVD mortality will increase from 16.7 million in 2002 to 23.9 million by 2030.2 The human-immunodeficiency virus (HIV) pandemic over the last decades has been identified as an important contributor to CVD mortality rates. A recent meta-analysis confirmed a significantly increased risk of CVD in HIV-infected vs. uninfected people, and virus type, treatment and disease activity (CD4+ T-cell count) were associated with elevated risk of CVD.3 Further, the Strategies for Management of Antiretroviral Therapy identified an increased cardiovascular-associated mortality rate among study subjects who interrupted antiretroviral therapy (ART).4, 5 Although a number of traditional risk factors have been shown to contribute to an excess risk of CVD in HIV patients, the exact mechanisms underlying this increased risk are not well understood. This issue warrants further investigations as CVD is likely to be one of the major conditions in the future to be confronted by people living with HIV.
A large body of genetic and epidemiological evidence now suggests a direct association between an elevated plasma Lp(a) level and an increased risk of CVD.6–8 Lp(a) levels are to a major extent regulated by genetics and thus less affected by non-genetic factors.9 The defining component of Lp(a) – apo(a) – has an extensive size polymorphism with repeated loop structures, so called kringles (K), where one motif, K4 type 2, is present in multiple copies.10, 11 Although smaller apo(a) sizes tend to associate with higher Lp(a) levels leading to a high risk of CVD,9 there is considerable variability in Lp(a) levels for any given apo(a) size. Irrespective of size differences, Lp(a) levels vary across ethnicities with the most profound differences between populations of African compared to non-African, i.e. European or Asian, descent.12–14 Beyond plasma Lp(a) levels, use of allele-specific apo(a) levels assessing the amount of Lp(a) associated with a defined apo(a) allele size provides a key characteristic of risk conveyed by Lp(a). In support of this concept, elevated Lp(a) levels for smaller apo(a) sizes were associated with coronary artery disease (CAD) in black and white men.15 The contribution of Lp(a) plasma levels and apo(a) size variation to the observed increased risk of CVD in HIV patients has not been determined. Conversely, there is a paucity of data with regard to how HIV disease activity might impact cardiovascular risk associated with Lp(a). To explore these issues, we investigated the associations between Lp(a), apo(a) size, allele-specific apo(a) levels and HIV disease activity as determined by CD4+ T-cell count and plasma HIV RNA viral load (pVL) in a bi-ethnic HIV patient cohort.
METHODS
Subjects
Subjects were recruited from a HIV-positive patient population followed at the Center for AIDS Research, Education and Services (CARES) Clinic in Sacramento, California. The samples used in this study were obtained from a repository established to examine the biological differences between gender, racial, and ethnic groups in response of HIV infection, and their complications. The demographic distribution of the enrolled subjects was predetermined to reflect the demographics of the clinic and the local HIV epidemic as a whole with an intended overrepresentation of minorities in order to strengthen the power of analysis in these groups. Subjects were recruited into the cohort irrespective of HIV disease or antiretroviral therapy status. Samples from a total of 307 patients self-identified as whites (n=139) and blacks (n=168) were analyzed for this study.
HIV-negative black and white subjects were from the Harlem and Basset cohort study. The clinical characteristics of this cohort and study design, including exclusion and inclusion criteria have been described in our previous studies15–17, and exclusion criteria included the use of lipid-lowering drugs, as well as hormone-replacement therapy. The study was approved by the Institutional Review Board at University of California Davis and informed consent was obtained from all study participants.
Determination of disease activity and plasma lipid and lipoprotein levels
Plasma HIV RNA quantification was performed using the Abbott Real-Time PCR HIV viral load assays (Abbott Laboratories, Abbott Park, IL). CD4+ T-cell counts were measured at local reference laboratories. Fasting blood samples were obtained and plasma was separated and stored at −80°C prior to analysis. Concentrations of triglycerides (Sigma Diagnostics, St. Louis, MO), total and HDL cholesterol (Roche, Sommerville, NJ) and glucose (Roche, Sommerville, NJ) were determined using standard enzymatic procedures.18, 19 HDL cholesterol levels were measured after precipitation of apoB-containing lipoproteins with dextran sulfate.20 Plasma Lp(a) levels were measured by an apo(a) size insensitive sandwich ELISA (Mercodia Inc, Uppsala, Sweden).21
Determination of isoform size and allele-specific apo(a) levels
Apo(a) isoform sizes were analyzed by SDS-agarose gel electrophoresis of plasma samples, followed by an immunoblotting.11 Allele-specific apo(a) levels were determined based on computerized scanning of apo(a) protein bands as described previously.16, 17 Briefly, protein dominance was determined by optical analysis of the apo(a) protein bands on Western blot, followed by a validation by computerized scanning. For each of the apo(a) protein bands, levels were apportioned according to the degree of intensity of the bands on Western blot. More details on determining of allele-specific apo(a) levels can be found in reference #16.
Statistics
Analysis of data was done with SPSS statistical analysis software (SPSS Inc, Chicago, IL). Results were expressed as means ± SD or median (interquartile range) for non-normally distributed variables. Triglyceride and pVL were logarithmically transformed and Lp(a) and allele-specific apo(a) levels were square root transformed before statistical analyses. Both the larger and smaller apo(a) isoforms of subjects with two distinguishable bands and one isoform of subjects with a single band were considered for statistical analyses. Group means were compared using Student’s t-test. The univariate relationship between allele-specific apo(a) levels and other variables such as disease activity parameters were described by Pearson’s correlation coefficients. All analyses were two-tailed, and P-values less than 0.05 were considered statistically significant.
RESULTS
The clinical characteristics of study participants are shown in Table 1. The mean age, body weight and body mass index were similar in whites and blacks. There were no significant differences in the levels of LDL cholesterol and glucose between the two ethnic groups. Blacks tended to have higher levels of HDL cholesterol (51 mg/dl vs. 46 mg/dl) although the difference was not statistically significant. As expected, blacks had significantly higher Lp(a) (39 mg/dl vs. 11 mg/dl, P<0.001) and lower triglyceride (118 mg/dl vs. 140 mg/dl, P=0.002) levels compared with whites. These clinical characteristics in HIV-positive subjects were comparable to those of HIV-negative subjects (Supplementary Table 1). CD4+ T-cell count and pVL did not differ between the two ethnic groups for the HIV-positive subjects (Table 1).
Table 1.
Clinical characteristics of study population
| Characteristics | Whites (n=139) | Blacks (n=168) | P-value |
|---|---|---|---|
| Men/Women* (n) | 90/48 | 105/58 | NS |
| Age (yrs) | 47.2±8.5 | 48.0±8.4 | NS |
| Weight (kg) | 82.3±16.8 | 85.2±19.3 | NS |
| BMI (kg/m2) | 27.3±5.8 | 28.4±6.3 | NS |
| CD4+ T-cell count (cells/mm3) | 505±294 | 442±268 | NS |
| Plasma viral load (copies/ml) | 50 (48–4241) | 63 (48–12736) | NS |
| Plasma viral load (log10 copies/ml) | 1.70 (1.68–3.63) | 1.80 (1.68–4.11) | NS |
| LDL cholesterol (mg/dl) | 99±34 | 91±33 | NS |
| HDL cholesterol (mg/dl) | 46±17 | 51±20 | NS |
| Lipoprotein(a) (mg/dl) | 11 (2–26) | 39 (16–77) | <0.001 |
| Triglyceride (mg/dl) | 140 (106–213) | 118 (81–167) | 0.002 |
| Glucose (mg/dl) | 92±15 | 101±48 | NS |
Values are expressed as mean ± SD and median (interquartile range) for non-normally distributed values. Values for triglycerides and plasma viral load were logarithmically transformed and values for lipoprotein(a) were square root transformed before analyses.
A total of six subjects (one white and five blacks) fell into category of “transgender”.
BMI, body mass index; NS, non significant
We next analysed the apo(a) size distribution and allele-specific apo(a) levels across ethnicity. Notably, the median apo(a) size was 28 K4 repeats in both whites and blacks. Consistent with the results of plasma Lp(a) levels, allele-specific apo(a) levels were significantly elevated in blacks vs. whites (23 mg/dl vs. 9 mg/dl, P<0.001). Next, we dichotomized apo(a) sizes by using the median apo(a) size (28 K4 repeats). As seen in Figure 1, allele-specific apo(a) levels associated with smaller apo(a) sizes (<28 K4 repeats) were significantly higher compared to allele-specific apo(a) levels associated with larger apo(a) sizes (≥28 K4 repeats) in both ethnic groups (12 mg/dl vs. 7 mg/dl in whites and 37 mg/dl vs. 15 mg/dl in blacks, respectively, P<0.001 for both groups).
Figure 1.
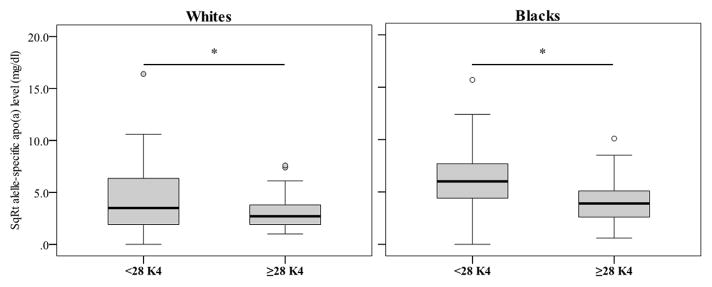
Allele-specific apo(a) levels for smaller apo(a) sizes (<28 K4 repeats) were significantly higher in both whites and blacks. *P<0.001
We examined the relationship of allele-specific apo(a) levels with HIV disease activity as determined by CD4+ T-cell count and pVL. For all subjects, allele-specific apo(a) levels were significantly and positively associated with CD4+ T-cell count (r=0.106, P=0.027) and negatively with pVL (r=−0.180, P<0.001). When the analyses were done separately for the two ethnic groups, the corresponding associations were significant in blacks (r=0.158, P=0.009 for CD4+ T-cell count and r=−0.232, P<0.001 for pVL), but not in whites.
To investigate the associations between allele-specific apo(a) levels and HIV disease activity parameters in more depth, we divided the subjects into two groups based on CD4+ T-cell counts (above and below 350 cells/mm3) (Table 2 and Figure 2). The median apo(a) size and levels of LDL and HDL cholesterol or triglycerides did not differ across the CD4+ T-cell groups for either ethnic group. Regardless of ethnicity, allele-specific apo(a) levels were elevated among patients with CD4+ T-cell count of ≥350 cells/mm3 compared to <350 cells/mm3 (10 mg/dl vs. 7 mg/dl, P=0.015 in whites and 26 mg/dl vs. 22 mg/dl, P=0.011 in blacks, respectively) (Figure 2). As seen in Figure 3, patients with CD4+ T-cell count of ≥350 cells/mm3 had significantly increased allele-specific apo(a) levels associated with smaller apo(a) sizes (<28 K4 repeats). In contrast, for larger (≥28 K4 repeats) apo(a) sizes, allele-specific apo(a) levels did not differ significantly across CD4+ T-cell count groups in either whites and blacks. Furthermore, when we dichotomized the cohort based on pVL, subjects with pVL of <1000 copies/ml, had significantly elevated allele-specific apo(a) levels compared with those in subjects with pVL of ≥1000 copies/ml (19 mg/dl vs. 13 mg/dl, respectively, P=0.001).
Table 2.
Associations between Lp(a), allele-specific apo(a) and other plasma lipid and lipoproteins with disease activity assessed by CD4+ T-cell count
| CD4+ T-cell count (cells/mm3) | <350 | ≥350 | P-value |
|---|---|---|---|
| Whites (n) | 43 | 91 | |
| Lipoprotein(a) (mg/dl) | 12 (2–25) | 12 (2–30) | NS |
| Allele-specific apo(a) (mg/dl) | 7 (3–18) | 10 (5–24) | 0.015 |
| Kringle 4 repeats (n) | 29 (23–32) | 28 (23–31) | NS |
| LDL cholesterol (mg/dl) | 98±34 | 99±34 | NS |
| HDL cholesterol (mg/dl) | 45±18 | 47±17 | NS |
| Triglyceride (mg/dl) | 125 (101–243) | 142 (112–207) | NS |
| Blacks (n) | 62 | 100 | |
| Lipoprotein(a) (mg/dl) | 34 (15–52) | 50 (17–92) | 0.030 |
| Allele-specific apo(a) (mg/dl) | 22 (11–33) | 26 (11–51) | 0.011 |
| Kringle 4 repeats (n) | 28 (26–30) | 27 (24–30) | NS |
| LDL cholesterol (mg/dl) | 99±34 | 91±33 | NS |
| HDL cholesterol (mg/dl) | 50±21 | 52±20 | NS |
| Triglyceride (mg/dl) | 99 (79–150) | 127 (88–170) | NS |
Data are expressed as mean ± SD or median (interquartile range) for non-normally distributed variables. NS, non significant
Figure 2.

Lp(a) (A) and allele-specific apo(a) (B) levels and apo(a) sizes (C) across CD4+ T-cell groups in whites and blacks. Gray boxplots represent subjects with CD4+ T-cell counts of ≥350 cells/mm3, whereas white boxplots represent subjects with CD4+ T-cell counts of <350 cell/mm3. *P<0.05
Figure 3.
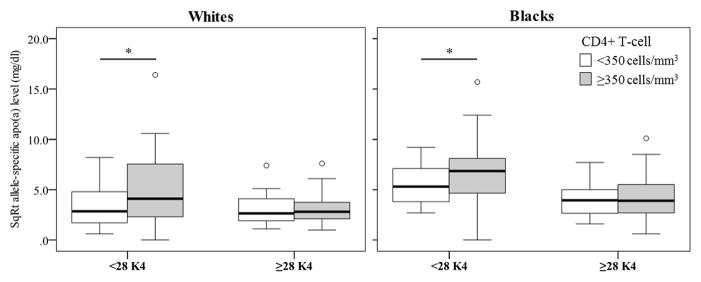
Allele-specific apo(a) levels for smaller apo(a) sizes (<28 K4 repeats) were significantly higher in subjects with CD4+ T-cell counts of ≥350 cells/mm3 vs. <350 cells/mm3, in both whites and blacks. *P<0.02
DISCUSSION
This is the first study examining Lp(a), apo(a) size heterogeneity and allele-specific apo(a) levels in relation to HIV disease activity and ethnicity. Consistent with many earlier studies in HIV-negative subjects,12, 22 Lp(a) and allele-specific apo(a) levels were significantly elevated in blacks compared to whites also in this HIV-positive cohort. In addition, allele-specific apo(a) levels were elevated among patients with an improved HIV disease status, i.e., with higher CD4+ T-cell counts and lower pVL, irrespective of ethnic background. Another important finding was that Lp(a) levels associated with smaller, more atherogenic apo(a) sizes were increased in patients with higher CD4+ T-cell counts and lower pVL. These findings suggest a modulation of Lp(a) risk factor properties [i.e. allele-specific apo(a) levels] by HIV disease activity. Our findings further suggest that although being considered as one of the most inheritable quantitative traits in human,9 Lp(a) levels can be affected by a clinically relevant non-genetic factor, i.e., HIV disease status.
Many studies have reported that HIV-infected subjects are at increased risk of CVD compared to uninfected subjects.23, 24 This was confirmed in a recent meta-analysis, where virus type, treatment and disease activity as determined by CD4+ T-cell count, were associated with elevated risk of CVD.3 Infection with HIV causes persistent immune activation associated with CD4+ T-cell loss, HIV pVL and disease progression, as well as a number of significant anthropometric and metabolic alterations, including dyslipidemia.25 HIV-positive patients in our cohort had comparatively low LDL cholesterol levels as well as triglyceride levels within the normal range, and these levels did not significantly differ between the high and low CD4+ T-cell count groups.
Furthermore, accumulating evidence now supports an association between ART and CVD in HIV-positive patients. An initial report by the large prospective observational Data Collection on Adverse Events of Anti-HIV Drugs (D:A:D) study demonstrated a positive association between highly active antiretroviral therapy (HAART) and myocardial infarction (MI).26 Subsequent reports indicated an association between protease inhibitor (PI) use and CVD.27,28 The use of nucleotide reverse transcriptase inhibitors was associated with increased rates of MI after adjustment for the predicted 10-year risk of CHD.28 Another large prospective observational study, the French Hospital Database on HIV study, showed that administration of PIs resulted in a 2.5-fold increased risk of MI compared with patients not taking the treatment.29 Although we were unable to directly assess the potential impact of ART in our cohort, all subjects with pVL of >1000 copies/ml mainly represent treatment naïve status in our clinic population. The findings of elevated allele-specific apo(a) levels in subjects with pVL of <1000 copies/ml compared with those in subjects with pVL of ≥ 1000 copies/ml suggest that elevated Lp(a) levels associated with smaller atherogenic apo(a) sizes may contribute to the increased risk of CVD in ART-treated HIV patients. Our findings of increased Lp(a) levels in patients with improved disease activity extend previous findings. Periard et al., reported an increase in Lp(a) levels among PI-treated HIV patients with pretreatment Lp(a) levels >20 mg/dl.30 In contrast, Constans et al. reported no difference in Lp(a) levels across different CD4+ T-cell count groups among HIV patients.31 However, in the latter study, Lp(a) levels were expressed as means, and importantly, allele-specific apo(a) levels were not analyzed. In a longitudinal study in 15 HIV patients, median Lp(a) levels were significantly increased in parallel with the progression of HIV disease.32 Further studies directly assessing the relationship between ART and allele/isofom-associated Lp(a) levels are therefore warranted.
The focus on apo(a) sizes and allele-specific apo(a) levels in the present study represents an expanded scope compared to previous studies, allowing a more detailed assessment of molecular properties. Lp(a) levels are largely determined by synthesis,33 and although the synthetic rate of both smaller and larger apo(a) isoforms within any given individual is subject to genetic regulation, our results suggest that an improvement of immune status and a decrease in pVL among HIV-positive individuals may preferentially impact smaller apo(a) size isoforms. This pattern resulting in higher Lp(a) levels associated with smaller apo(a) sizes was seen in both blacks and whites. Although there is a strong inverse relation between apo(a) size and Lp(a) levels,9 differences in apo(a) size distribution is unlikely to contribute to the observed findings. First, apo(a) size distribution in the present HIV-positive subjects was similar to the distribution reported for HIV-negative subjects.15 Second, as for HIV-negative subjects, the median apo(a) size was similar for whites and blacks in our HIV cohort. Finally, the apo(a) size distribution was similar between the two groups of HIV-positive subjects across CD4+ T-cell levels for both blacks and whites. Taken together, these findings indicate that the observed differences in allele-specific apo(a) levels across ethnicity and disease activity were not explained by differences in the apo(a) size distribution. Notably, some studies that have failed to detect an association between Lp(a) and CAD in blacks were based on either plasma Lp(a) levels or apo(a) isoform sizes alone,34, 35 emphasizing the importance of allele-specific apo(a) levels.
Inflammation plays a key role in the development of atherosclerotic CVD involving several types of immunocytes such as activated macrophages, T cells and mast cells. Previously, we have shown that a higher inflammatory burden increases Lp(a) levels associated with smaller apo(a) sizes in HIV-negative whites and blacks at high risk of CVD.17, 22 Notably, increased levels of inflammatory markers have also been found in patients appropriately treated HIV disease. In a combined analysis from the Women’s Interagency HIV Study (WIHS) and the Multicenter AIDS Cohort Study (MACS), the initiation of effective ART was associated with an apparent increase in CRP levels.36 Although it is tempting to suggest that HIV and/or ART -induced inflammation that remains even after an adequate control of disease activity might contribute to the observed high allele-specific apo(a) levels, further studies are needed to address this possibility. Plasma markers of thrombosis and endothelial damage have been shown to better predict CVD risk in HIV-positive populations.37 Ford at al. reported an independent association between CVD risk and D-dimer, a soluble product of fibrinogen breakdown and a marker of thrombosis, in addition to conventional risk factors such as smoking and family history.38 This association persisted even after taking confounders into account. Interestingly, pVL was not associated with increased CVD risk; instead HIV patients were more likely to have lower pVL prior to a CVD event in this cohort. Due to its structural similarity to plasminogen, Lp(a) can potentially interfere with fibrinolysis exerting a pro-thrombotic effect, and our findings of increased allele-specific apo(a) levels associated with more atherogenic smaller apo(a) sizes at low pVL may therefore contribute to the observed increased risk in HIV patients.
Our study has some limitations. First, results were based on cross-sectional measurements of Lp(a) and disease activity parameters. Second, although we included both blacks and whites, further studies are needed to extend our findings to other racial and ethnic populations. Third, we were unable to address the potential impact of ART directly though all subjects with pVL below 1000 copies/ml mainly represent treatment naïve status in our clinic population. Strengths of our study include enrollment of two populations with differing characteristics of CVD risk factors including Lp(a) levels. Secondly, it is the first study to report on the associations between HIV disease activity and Lp(a) with an emphasis on apo(a) size. Thirdly, we assessed HIV disease activity with both CD4+ T-cell count and pVL. The findings of the current study contributes to our overall understanding of increased cardiovascular risk in HIV-positive population and emphasize the need for further studies focusing on emerging comprehensive risk factor assessment. In addition, the findings suggest that studies under HIV conditions may provide opportunities to better understand the regulation of Lp(a) levels and apo(a) molecular properties.
In conclusion, allele-specific apo(a) levels were higher in subjects with high CD4+ T-cell count or low pVL. The findings suggest that HIV disease activity reduced allele-specific apo(a) levels.. Higher allele-specific apo(a) levels associated with atherogenic small apo(a) sizes might contribute to an increased cardiovascular risk in subjects with improved HIV disease status.
Supplementary Material
Acknowledgments
The authors thank the staff at the Center for AIDS Research, Education and Services (CARES) Clinic in Sacramento, California, and participants of the current study for their important contributions. The view expressed in this article are those of authors and do not necessarily represent the views of the Department of Veterans Affairs.
SOURCES OF FUNDING
The current study was supported by grants from the National Heart, Lung and Blood Institute (HL62705) and the National Center for Advancing Translational Sciences (TR000002). Dr. Anuurad is supported by a K12 grant from the National Center for Advancing Translational Sciences (TR000134). The grant supporting the establishment of the repository samples was funded by the California HIV Research Program (RBP, DMA, XDL).
Footnotes
DISCLOSURES
None
References
- 1.Roger VL, Go AS, Lloyd-Jones DM, Benjamin EJ, Berry JD, Borden WB, Bravata DM, Dai S, Ford ES, Fox CS, Fullerton HJ, Gillespie C, Hailpern SM, Heit JA, Howard VJ, Kissela BM, Kittner SJ, Lackland DT, Lichtman JH, Lisabeth LD, Makuc DM, Marcus GM, Marelli A, Matchar DB, Moy CS, Mozaffarian D, Mussolino ME, Nichol G, Paynter NP, Soliman EZ, Sorlie PD, Sotoodehnia N, Turan TN, Virani SS, Wong ND, Woo D, Turner MB. Heart disease and stroke statistics--2012 update: A report from the american heart association. Circulation. 2012;125:e2–e220. doi: 10.1161/CIR.0b013e31823ac046. [DOI] [PMC free article] [PubMed] [Google Scholar]
- 2.Mathers CD, Loncar D. Projections of global mortality and burden of disease from 2002 to 2030. PLoS medicine. 2006;3:e442. doi: 10.1371/journal.pmed.0030442. [DOI] [PMC free article] [PubMed] [Google Scholar]
- 3.Islam F, Wu J, Jansson J, Wilson D. Relative risk of cardiovascular disease among people living with hiv: A systematic review and meta-analysis. HIV medicine. 2012 doi: 10.1111/j.1468-1293.2012.00996.x. [DOI] [PubMed] [Google Scholar]
- 4.Tebas P, Henry WK, Matining R, Weng-Cherng D, Schmitz J, Valdez H, Jahed N, Myers L, Powderly WG, Katzenstein D. Metabolic and immune activation effects of treatment interruption in chronic hiv-1 infection: Implications for cardiovascular risk. PLoS ONE. 2008;3:e2021. doi: 10.1371/journal.pone.0002021. [DOI] [PMC free article] [PubMed] [Google Scholar]
- 5.El-Sadr WM, Lundgren JD, Neaton JD, Gordin F, Abrams D, Arduino RC, Babiker A, Burman W, Clumeck N, Cohen CJ, Cohn D, Cooper D, Darbyshire J, Emery S, Fatkenheuer G, Gazzard B, Grund B, Hoy J, Klingman K, Losso M, Markowitz N, Neuhaus J, Phillips A, Rappoport C. Cd4+ count-guided interruption of antiretroviral treatment. N Engl J Med. 2006;355:2283–2296. doi: 10.1056/NEJMoa062360. [DOI] [PubMed] [Google Scholar]
- 6.Erqou S, Kaptoge S, Perry PL, Di Angelantonio E, Thompson A, White IR, Marcovina SM, Collins R, Thompson SG, Danesh J. Lipoprotein(a) concentration and the risk of coronary heart disease, stroke, and nonvascular mortality. JAMA. 2009;302:412–423. doi: 10.1001/jama.2009.1063. [DOI] [PMC free article] [PubMed] [Google Scholar]
- 7.Kamstrup PR, Tybjaerg-Hansen A, Steffensen R, Nordestgaard BG. Genetically elevated lipoprotein(a) and increased risk of myocardial infarction. JAMA. 2009;301:2331–2339. doi: 10.1001/jama.2009.801. [DOI] [PubMed] [Google Scholar]
- 8.Nordestgaard BG, Chapman MJ, Ray K, Boren J, Andreotti F, Watts GF, Ginsberg H, Amarenco P, Catapano A, Descamps OS, Fisher E, Kovanen PT, Kuivenhoven JA, Lesnik P, Masana L, Reiner Z, Taskinen MR, Tokgozoglu L, Tybjaerg-Hansen A. Lipoprotein(a) as a cardiovascular risk factor: Current status. Eur Heart J. 2010;31:2844–2853. doi: 10.1093/eurheartj/ehq386. [DOI] [PMC free article] [PubMed] [Google Scholar]
- 9.Boerwinkle E, Leffert CC, Lin J, Lackner C, Chiesa G, Hobbs HH. Apolipoprotein(a) gene accounts for greater than 90% of the variation in plasma lipoprotein(a) concentrations. J Clin Invest. 1992;90:52–60. doi: 10.1172/JCI115855. [DOI] [PMC free article] [PubMed] [Google Scholar]
- 10.Koschinsky ML, Beisiegel U, Henne-Bruns D, Eaton DL, Lawn RM. Apolipoprotein(a) size heterogeneity is related to variable number of repeat sequences in its mrna. Biochemistry. 1990;29:640–644. doi: 10.1021/bi00455a007. [DOI] [PubMed] [Google Scholar]
- 11.Lackner C, Boerwinkle E, Leffert CC, Rahmig T, Hobbs HH. Molecular basis of apolipoprotein (a) isoform size heterogeneity as revealed by pulsed-field gel electrophoresis. J Clin Invest. 1991;87:2153–2161. doi: 10.1172/JCI115248. [DOI] [PMC free article] [PubMed] [Google Scholar]
- 12.Marcovina SM, Albers JJ, Wijsman E, Zhang Z, Chapman NH, Kennedy H. Differences in lp[a] concentrations and apo[a] polymorphs between black and white americans. J Lipid Res. 1996;37:2569–2585. [PubMed] [Google Scholar]
- 13.Parra HJ, Luyeye I, Bouramoue C, Demarquilly C, Fruchart JC. Black-white differences in serum lp(a) lipoprotein levels. Clin Chim Acta. 1987;168:27–31. doi: 10.1016/0009-8981(87)90263-4. [DOI] [PubMed] [Google Scholar]
- 14.Sandholzer C, Hallman DM, Saha N, Sigurdsson G, Lackner C, Csaszar A, Boerwinkle E, Utermann G. Effects of the apolipoprotein(a) size polymorphism on the lipoprotein(a) concentration in 7 ethnic groups. Hum Genet. 1991;86:607–614. doi: 10.1007/BF00201550. [DOI] [PubMed] [Google Scholar]
- 15.Paultre F, Pearson TA, Weil HF, Tuck CH, Myerson M, Rubin J, Francis CK, Marx HF, Philbin EF, Reed RG, Berglund L. High levels of lp(a) with a small apo(a) isoform are associated with coronary artery disease in african american and white men. Arterioscler Thromb Vasc Biol. 2000;20:2619–2624. doi: 10.1161/01.atv.20.12.2619. [DOI] [PubMed] [Google Scholar]
- 16.Rubin J, Paultre F, Tuck CH, Holleran S, Reed RG, Pearson TA, Thomas CM, Ramakrishnan R, Berglund L. Apolipoprotein [a] genotype influences isoform dominance pattern differently in african americans and caucasians. J Lipid Res. 2002;43:234–244. [PubMed] [Google Scholar]
- 17.Anuurad E, Rubin J, Chiem A, Tracy RP, Pearson TA, Berglund L. High levels of inflammatory biomarkers are associated with increased allele-specific apolipoprotein(a) levels in african-americans. J Clin Endocrinol Metab. 2008;93:1482–1488. doi: 10.1210/jc.2007-2416. [DOI] [PMC free article] [PubMed] [Google Scholar]
- 18.McGowan MW, Artiss JD, Strandbergh DR, Zak B. A peroxidase-coupled method for the colorimetric determination of serum triglycerides. Clin Chem. 1983;29:538–542. [PubMed] [Google Scholar]
- 19.Allain CC, Poon LS, Chan CS, Richmond W, Fu PC. Enzymatic determination of total serum cholesterol. Clin Chem. 1974;20:470–475. [PubMed] [Google Scholar]
- 20.Warnick GR, Benderson J, Albers JJ. Dextran sulfate-mg2+ precipitation procedure for quantitation of high-density-lipoprotein cholesterol. Clin Chem. 1982;28:1379–1388. [PubMed] [Google Scholar]
- 21.Dembinski T, Nixon P, Shen G, Mymin D, Choy PC. Evaluation of a new apolipoprotein(a) isoform-independent assay for serum lipoprotein(a) Mol Cell Biochem. 2000;207:149–155. doi: 10.1023/a:1007079223546. [DOI] [PubMed] [Google Scholar]
- 22.Enkhmaa B, Anuurad E, Zhang W, Pearson TA, Berglund L. Association of lp-pla(2) activity with allele-specific lp(a) levels in a bi-ethnic population. Atherosclerosis. 2010;211:526–530. doi: 10.1016/j.atherosclerosis.2010.03.021. [DOI] [PMC free article] [PubMed] [Google Scholar]
- 23.Triant VA, Lee H, Hadigan C, Grinspoon SK. Increased acute myocardial infarction rates and cardiovascular risk factors among patients with human immunodeficiency virus disease. J Clin Endocrinol Metab. 2007;92:2506–2512. doi: 10.1210/jc.2006-2190. [DOI] [PMC free article] [PubMed] [Google Scholar]
- 24.Lang S, Mary-Krause M, Cotte L, Gilquin J, Partisani M, Simon A, Boccara F, Bingham A, Costagliola D. Increased risk of myocardial infarction in hiv-infected patients in france, relative to the general population. AIDS. 2010;24:1228–1230. doi: 10.1097/QAD.0b013e328339192f. [DOI] [PubMed] [Google Scholar]
- 25.Anuurad E, Semrad A, Berglund L. Human immunodeficiency virus and highly active antiretroviral therapy-associated metabolic disorders and risk factors for cardiovascular disease. Metab Syndr Relat Disord. 2009;7:401–410. doi: 10.1089/met.2008.0096. [DOI] [PMC free article] [PubMed] [Google Scholar]
- 26.Friis-Moller N, Sabin CA, Weber R, d’Arminio Monforte A, El-Sadr WM, Reiss P, Thiebaut R, Morfeldt L, De Wit S, Pradier C, Calvo G, Law MG, Kirk O, Phillips AN, Lundgren JD. Combination antiretroviral therapy and the risk of myocardial infarction. N Engl J Med. 2003;349:1993–2003. doi: 10.1056/NEJMoa030218. [DOI] [PubMed] [Google Scholar]
- 27.Friis-Moller N, Reiss P, Sabin CA, Weber R, Monforte A, El-Sadr W, Thiebaut R, De Wit S, Kirk O, Fontas E, Law MG, Phillips A, Lundgren JD. Class of antiretroviral drugs and the risk of myocardial infarction. N Engl J Med. 2007;356:1723–1735. doi: 10.1056/NEJMoa062744. [DOI] [PubMed] [Google Scholar]
- 28.Sabin CA, Worm SW, Weber R, Reiss P, El-Sadr W, Dabis F, De Wit S, Law M, D’Arminio Monforte A, Friis-Moller N, Kirk O, Pradier C, Weller I, Phillips AN, Lundgren JD. Use of nucleoside reverse transcriptase inhibitors and risk of myocardial infarction in hiv-infected patients enrolled in the d:A:D study: A multi-cohort collaboration. Lancet. 2008;371:1417–1426. doi: 10.1016/S0140-6736(08)60423-7. [DOI] [PMC free article] [PubMed] [Google Scholar]
- 29.Mary-Krause M, Cotte L, Simon A, Partisani M, Costagliola D. Increased risk of myocardial infarction with duration of protease inhibitor therapy in hiv-infected men. AIDS. 2003;17:2479–2486. doi: 10.1097/00002030-200311210-00010. [DOI] [PubMed] [Google Scholar]
- 30.Periard D, Telenti A, Sudre P, Cheseaux JJ, Halfon P, Reymond MJ, Marcovina SM, Glauser MP, Nicod P, Darioli R, Mooser V. Atherogenic dyslipidemia in hiv-infected individuals treated with protease inhibitors. The swiss hiv cohort study. Circulation. 1999;100:700–705. doi: 10.1161/01.cir.100.7.700. [DOI] [PubMed] [Google Scholar]
- 31.Constans J, Pellegrin JL, Peuchant E, Dumon MF, Simonoff M, Clerc M, Leng B, Conri C. High plasma lipoprotein (a) in hiv-positive patients. Lancet. 1993;341:1099–1100. doi: 10.1016/0140-6736(93)92464-5. [DOI] [PubMed] [Google Scholar]
- 32.Kritz H, Efthimiou Y, Stamatopoulos J, Najemnik C, Sinzinger H. Association of lipoprotein(a), prostaglandin i(2)--synthesis stimulating plasma factor, biological half-life of prostaglandin i(2)and high-density lipoproteins in hiv-1 infection of different stages. Prostaglandins, leukotrienes, and essential fatty acids. 2000;63:309–314. doi: 10.1054/plef.2000.0219. [DOI] [PubMed] [Google Scholar]
- 33.Rader DJ, Cain W, Zech LA, Usher D, Brewer HB., Jr Variation in lipoprotein(a) concentrations among individuals with the same apolipoprotein (a) isoform is determined by the rate of lipoprotein(a) production. J Clin Invest. 1993;91:443–447. doi: 10.1172/JCI116221. [DOI] [PMC free article] [PubMed] [Google Scholar]
- 34.Moliterno DJ, Jokinen EV, Miserez AR, Lange RA, Willard JE, Boerwinkle E, Hillis LD, Hobbs HH. No association between plasma lipoprotein(a) concentrations and the presence or absence of coronary atherosclerosis in african-americans. Arterioscler Thromb Vasc Biol. 1995;15:850–855. doi: 10.1161/01.atv.15.7.850. [DOI] [PubMed] [Google Scholar]
- 35.Sorrentino MJ, Vielhauer C, Eisenbart JD, Fless GM, Scanu AM, Feldman T. Plasma lipoprotein (a) protein concentration and coronary artery disease in black patients compared with white patients. Am J Med. 1992;93:658–662. doi: 10.1016/0002-9343(92)90199-l. [DOI] [PubMed] [Google Scholar]
- 36.Palella FJ, Jr, Gange SJ, Benning L, Jacobson L, Kaplan RC, Landay AL, Tracy RP, Elion R. Inflammatory biomarkers and abacavir use in the women’s interagency hiv study and the multicenter aids cohort study. AIDS. 2010;24:1657–1665. doi: 10.1097/QAD.0b013e3283389dfa. [DOI] [PMC free article] [PubMed] [Google Scholar]
- 37.Musselwhite LW, Sheikh V, Norton TD, Rupert A, Porter BO, Penzak SR, Skinner J, Mican JM, Hadigan C, Sereti I. Markers of endothelial dysfunction, coagulation and tissue fibrosis independently predict venous thromboembolism in hiv. AIDS. 2011;25:787–795. doi: 10.1097/QAD.0b013e3283453fcb. [DOI] [PMC free article] [PubMed] [Google Scholar]
- 38.Ford ES, Greenwald JH, Richterman AG, Rupert A, Dutcher L, Badralmaa Y, Natarajan V, Rehm C, Hadigan C, Sereti I. Traditional risk factors and d-dimer predict incident cardiovascular disease events in chronic hiv infection. AIDS. 2010;24:1509–1517. doi: 10.1097/QAD.0b013e32833ad914. [DOI] [PMC free article] [PubMed] [Google Scholar]
Associated Data
This section collects any data citations, data availability statements, or supplementary materials included in this article.