

Abstract
There is a need to identify novel targets in Acute Lymphoblastic Leukemia (ALL), a hematopoietic cancer affecting children, to improve our understanding of disease biology and that can be used for developing new therapeutics. Hence, the aim of our study was to find new genes as targets using in silico studies; for this we retrieved the top 10% overexpressed genes from Oncomine public domain microarray expression database; 530 overexpressed genes were short-listed from Oncomine database. Then, using prioritization tools such as ENDEAVOUR, DIR and TOPPGene online tools, we found fifty-four genes common to the three prioritization tools which formed our candidate leukemogenic genes for this study. As per the protocol we selected thirty training genes from PubMed. The prioritized and training genes were then used to construct STRING functional association network, which was further analyzed using cytoHubba hub analysis tool to investigate new genes which could form drug targets in leukemia. Analysis of the STRING protein network built from these prioritized and training genes led to identification of two hub genes, SMAD2 and CDK9, which were not implicated in leukemogenesis earlier. Filtering out from several hundred genes in the network we also found MEN1, HDAC1 and LCK genes, which re-emphasized the important role of these genes in leukemogenesis. This is the first report on these five additional signature genes in leukemogenesis. We propose these as new targets for developing novel therapeutics and also as biomarkers in leukemogenesis, which could be important for prognosis and diagnosis.
Keywords: Acute Lymphoblastic Leukemia (ALL), Microarray analysis, Gene prioritization, Protein interaction network, Therapeutic targets
1. Introduction
A key focus of cancer research is the identification of driver genes in the tumorigenesis pathway as tumor specific signature genes, for use as drug targets or biomarkers, which could be possible from microarray databases (Ma et al., 2013). The recent advancement in bioinformatics techniques has made it possible to search for therapeutic targets for specific diseases in a systematic and comprehensive manner (Desany and Zhang, 2004). Acute Lymphoblastic Leukemia (ALL) is a blood cancer that targets B and T-lymphocyte cells, affecting their differentiation and leading to the loss of regulation of cell division (Khalid et al., 2010). Even with numerous advances in therapeutic efficacy, 20–40% of patients still relapse, especially children and young adults (Smith et al., 2010). Research studies have implicated alterations in several pathways that mediate crucial biological processes to play a role in disease progression and particularly in relapse (Bhojwani et al., 2006; Pui et al., 2011). These studies suggest that an interconnected network of many genes and their products are altered in carcinogenesis and may contribute to leukemia pathogenesis (Bhojwani et al., 2006; Pui et al., 2011).
A study by Kang et al. (2012) reported a correlation between event free survival and expression levels of NEGR1, IRX2, EPS8 and TPD52. Lin et al. (2012) reported that point mutations in NOTCH1 led to increased expression of this gene which might contribute to pathogenesis in T-ALL. In recent years, meta-analysis studies have led to the identification of novel genetic markers that might play crucial roles in the neoplastic process and in other diseases, as demonstrated through our previous studies (Khan and Jamil, 2008; Shaik et al., 2009; Jamil and Sabeena, 2011). Understanding the evolutionary relationship of these genes could also help to investigate the mechanisms of neoplastic transformation observed in leukemic cells (Jayaraman et al., 2011; Jayaraman and Jamil, 2012). Further, our previous studies using bioinformatics approaches have helped in highlighting the significance of protein networks in ALL (Jayaraman and Jamil, 2013) and identified important amino acid residues that may be useful in therapeutic targeting of cell cycle proteins (Jayaraman and Jamil, 2014). In recent years, several research studies have applied a systems biology approach to understand ALL leukemogenesis. Maiorov et al. (2013) identified a set of non-differential putative biomarkers in T-ALL based on network analysis of expression data. Gao et al. (2014) analyzed differentially expressed genes, screened for prognostic genes and identified latent pathway genes. Their analysis identified HK3 and PTGS2, two key metabolic pathway genes as possible prognostic genes in pediatric ALL. Chaiboonchoe et al. (2014) used an integrated bioinformatics approach to identify glucocorticoid regulated genes in Childhood ALL. Many studies have shown that various bioinformatics and computational biology approaches, such as PseKNC (Chen et al., 2014) or Chou’s PseAAC (Chou, 2001), can be successfully used to identify modifications in the genome such as recombination spots of DNA (Chen et al., 2013), various PTM (posttranslational modification) sites (Xu et al., 2014), anticancer peptides (Hajisharifi et al., 2014), interactions between drugs and target proteins in cellular networking (Xiao et al., 2014), providing very useful information and insights for both basic research and drug development, and hence are widely welcomed by the scientific community, both experimental and theoretical. Here, we have used computational approaches to identify new targets in leukemogenesis in the hope to provide useful information for stimulating the development of new and effective drugs to treat leukemia.
Understanding the interactions of disease genes is essential as dynamic networking of genes could be correlated with clinical informatics, including therapeutic and imaging profile and other parameters and this correlation could help in a better understanding of the disease in relation to each patient (Wang, 2011). To meet such challenges our objective was to retrieve overexpressed genes from Oncomine expression database (Rhodes et al., 2007), to perform gene prioritization analysis using bioinformatics software. Further, we have also analyzed protein interactions of the prioritized proteins as studies investigating Protein–Protein interactions have provided key insights on the biological functioning of many proteins and have also been effective in identifying novel genes that play a role in pathogenesis of various diseases such as cancer (Huang et al., 2011; Li et al., 2012). Our hypothesis is based on our belief that a large amount of data generated through expression studies in previous reports which contribute to leukemogenesis may have been missed due to the varied detection methods. Hence, our research combines the use of expression data, gene prioritization analysis and a network based approach to identify genes of significance in ALL and the use of well validated datasets, prioritization based approach, using rigorous network analysis suggests that the results from our study may be replicable in vivo as well. The use of these combined bioinformatics approaches enhances the validity of our results and has led to the identification of few novel genes in this study.
2. Materials and methods
An overview of the analysis workflow for the study is represented in Fig. 1.
Figure 1.
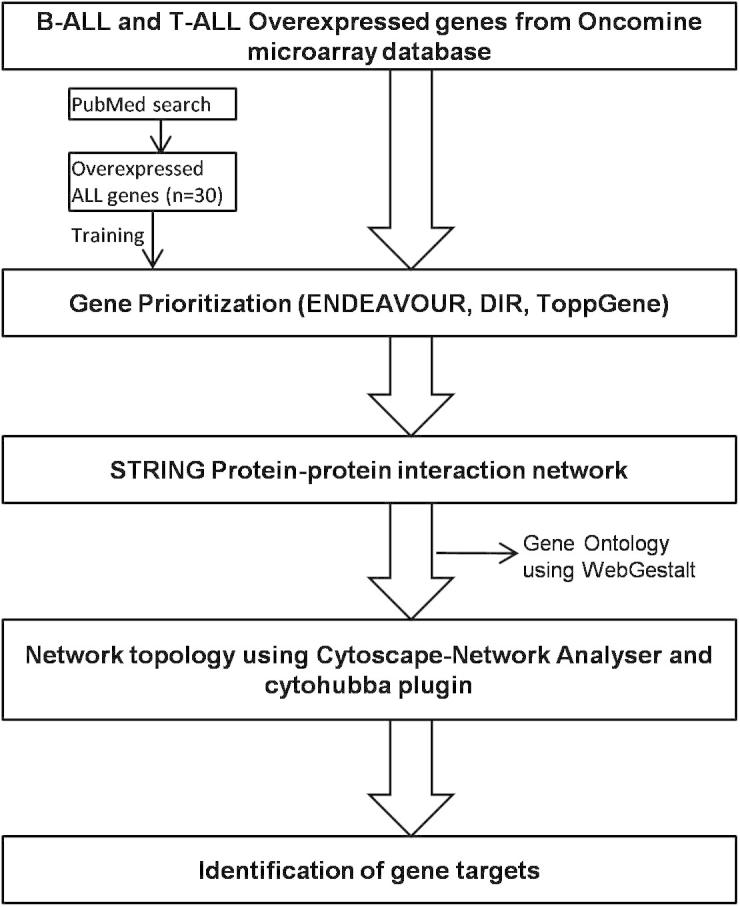
Scheme showing overview of the methodology followed in the study.
2.1. Microarray expression data analysis using Oncomine database
In the current study we queried the Oncomine database to obtain only those datasets which have reported differentially expressed genes between normal and leukemic tissues. Oncomine database 3.0 (Rhodes et al., 2007) is a comprehensive cancer microarray expression database with expression data from experimental studies. We found three studies – Maia et al. (2005) (one dataset; B-ALL; 20 patients), Andersson et al. (2007) (one dataset; Childhood B- (87 patients) and T-ALL (11 patients)) and Haferlach et al. (2010) (two datasets; Childhood and Adult B- (933 patients) and T-ALL (253 patients)), in Oncomine database which reported differential expression in ALL and we selected only the top 10% overexpressed genes from all these studies. Further, we compared these studies using the default database threshold values of odds ratio above 2.0, P-value of 1E-4. The genes short-listed from this analysis, designated as candidates, were used as input for gene prioritization.
2.2. Gene prioritization using ENDEAVOUR, DIR and TOPPGene tools
Three software tools – ENDEAVOUR (Tranchevent et al., 2008), TOPPGene (Chen et al., 2009) and DIR (Chen et al., 2011) – were utilized to evaluate whether the genes obtained through Oncomine dataset analysis could play a role in the disease process. The three tools perform prioritization based on sources such as disease information, pathway information, phenotype, regulatory modules, etc. and produce a ranked list of genes which could be further validated statistically by each of the software to output a final ranked list of genes.
2.2.1. Training genes
The gene prioritization tools additionally require a set of training genes to train the software, which were obtained from the published literature, reporting their alteration in the disease process. PubMed was queried using the keywords “overexpression” and “acute lymphoblastic leukemia” for all studies pertaining to humans (study period from 1992–March 2012). Analysis of the retrieved literature revealed 30 genes (Table 1), which were reported through experimental studies to be significantly overexpressed in ALL and contribute to leukemogenesis.
Table 1.
List of ALL specific genes used as training genes for prioritization.
Further, to ensure that the results obtained through the use of the ALL specific training genes were not random, we also performed a separate gene prioritization analysis using a set of housekeeping genes as training genes (Table 2). Thirty housekeeping genes, having the highest expression in bone marrow tissues, were retrieved from the study by Chang et al. (2011) (Table 2). Of the ranked list of genes obtained from each analysis, the top 100 were considered to be significant and were compared to short-list the prioritized genes common to at least two tools. These common prioritized genes along with the training genes were used to construct protein interaction network.
Table 2.
List of training housekeeping genes with higher expression in bone marrow tissue (Chang et al., 2011).
| S.No. | Gene name | S.No. | Gene name |
|---|---|---|---|
| 1. | ACTB | 16. | RPS10 |
| 2. | B2 M | 17. | RPS11 |
| 3. | EEF1A1 | 18. | RPS12 |
| 4. | HBB | 19. | RPS14 |
| 5. | RPL13A | 20. | RPS15 |
| 6. | RPL23A | 21. | RPS17 |
| 7. | RPL27A | 22. | RPS18 |
| 8. | RPL3 | 23. | RPS23 |
| 9. | RPL30 | 24. | RPS27 |
| 10. | RPL41 | 25. | RPS29 |
| 11. | RPL7A | 26. | RPS3A |
| 12. | RPL9 | 27. | RPS6 |
| 13. | RPL32 | 28. | TPT1 |
| 14. | RPLP0 | 29. | UBB |
| 15. | RPLP1 | 30. | UBC |
2.3. Construction of Protein–Protein Interaction (PPI) network
We have used STRING database v9 (Search Tool for the Retrieval of Interacting Genes, available at: http://string-db.org/ (Szklarczyk et al., 2011)) with protein names of the prioritized and training genes as seeds for construction of the protein interaction (PPI) network. We selected the interactions pertaining to Homo sapiens and grew the interaction network to obtain an additional 230 protein interactors, using the “add more interactors” option in STRING database, and further refined it to include only those interactions with a confidence score greater than 0.9.
Further, to simplify the complicated dense network and to obtain a better understanding of the interaction network, we clustered the interactors using STRING k-Means clustering algorithm (MacQueen, 1967). We specified the number of clusters to be 12, based on the rule of thumb k = √(n/2) (Mardia et al., 1979), where n is number of nodes (protein interactors) in the cluster. The resulting clusters were separated manually for better visual representation and comprehension of the interaction network. Further, to study the functional significance of these genes, we used WebGestalt server.
2.4. Gene Ontology (GO) WebGestalt server for functional enrichment
We used WebGestalt, WEB-based GEne SeT AnaLysis Toolkit (available at http://bioinfo.vanderbilt.edu/webgestalt/) (Zhang et al., 2005) for GO enrichment analysis of the common prioritized genes and the interactors in the protein network. The statistical significance of the enrichment analysis was checked by choosing Hypergeometric test and Benjamini–Hochberg false discovery rate (FDR) correction model for multiple test adjustment, which were available in the software. We also set the threshold to the default settings to include a minimum of two genes per category and a P-value cut-off of 0.05 to obtain significant enrichment. Further, we have used KOBAS (KEGG Orthology Based Annotation System, available at http://kobas.cbi.pku.edu.cn/home.do) (Xie et al., 2011) to perform KEGG database based enrichment analysis of the prioritized genes obtained using housekeeping and ALL specific training genes. The default parameter of Hypergeometric test/Fisher’s exact test was selected as the statistical method and Benjamini–Hochberg was used as the FDR correction method.
2.5. Analysis of the topology of network interaction data and Hub proteins
The PPI network was downloaded in Protein Standards Initiative (PSI) format and imported into the network visualization software, Cytoscape (Smoot et al., 2011). The topological parameters of the network, i.e. node degree distribution and clustering coefficient, were analyzed using the Network Analyzer plugin (Assenov et al., 2008). These parameters are a measure of the importance of the nodes in the network and their ability to form clusters (Barabási and Oltvai, 2004). Information about hub genes was obtained through the cytoHubba plugin (Lin et al., 2008) with the option “confidence value” set as the edge attribute and degree and betweenness as the node ranking methods.
We set each of the ranking methods to output the top 50 hub forming genes/proteins as a measure of significance. The genes obtained from both the ranking methods were compared and those common to both methods were considered to be significant.
3. Results
3.1. Candidate gene selection and data analysis
We could identify and shortlist candidate genes which were overexpressed in the Oncomine microarray database. We found about 23 datasets of Acute Lymphoblastic Leukemia (ALL) in the database, of which only 3 studies reported differential analysis between cancer and normal tissues. All the datasets present in Oncomine represented statistically validated information via analysis performed by Oncomine using t-tests and validated by the database using false discovery rate test, prior to incorporation into the database. Dataset of Maia et al. (2005) comprised of about 12,624 measured genes with 627 genes among the top 10% overexpressed genes. The dataset of Andersson et al. (2007) comprised of about 10,735 measured genes with 1072 genes in B-ALL and 1071 genes in T-ALL among the top 10% overexpressed genes. Haferlach et al. (2010) dataset-1 comprised of 19,574 measured genes, and dataset-2 of about 910 genes and 1957 genes each in B-ALL and T-ALL samples were among the top 10% overexpressed genes.
On comparing all the overexpressed signature genes across these datasets, we found 237 genes in B-ALL and 422 genes in T-ALL common to two out of three studies in B-ALL and present in both the studies used for T-ALL analysis. Since our aim was to determine the alterations in ALL genes as a whole, we combined both the B- and T-ALL genes and after removal of duplicates we obtained 573 genes. Of these, 530 genes, designated as candidates, mapped to ENSEMBL ids, were short-listed for prioritization.
3.2. Gene prioritization and Gene Ontology (GO) functional enrichment of overexpressed candidates using training genes
The selected and shortlisted genes from Oncomine were prioritized, using the software ENDEAVOUR, ToppGene and DIR. Each of the gene prioritization algorithms used in this study ranked the candidate genes according to their significance and the results were presented as a tabulated list. On comparison of the top 100 ranked results from the three tools, we found that 54 genes (referred to as ALL prioritized genes, Table 3) were common to the prediction methods and hence may play an important role in ALL. Of these 54 genes, 30 were found to be overexpressed in T-ALL, 13 in B-ALL and 11 in both subtypes.
Table 3.
Prioritized candidate genes common to ENDEAVOUR, DIR, TOPPGENE tools.
| T-ALL only | B-ALL only | Both B-ALL,T-ALL | |
|---|---|---|---|
| ABI2 | KHDRBS1 | BCR | CDK6 |
| ADA | LCK | BLNK | CSNK1E |
| AOF2 | MAP4K1 | CDK9 | DVL2 |
| BMI1 | MEN1 | CHD4 | GNPTAB |
| CD3D | MLL | ETS2 | MYB |
| CD3E | NPM1 | INSR | NONO |
| CD81 | PTMA | MEF2C | SET |
| CTCF | SMAD2 | NR3C1 | TCF3 |
| DNTT | SMO | NRIP1 | SPTBN1 |
| FGFR1 | TCEA2 | PARP1 | TP53BP1 |
| FUBP1 | TCF7 | PHB | YY1 |
| GATA3 | TFDP2 | PMAIP1 | Number of genes = 11 |
| HDAC1 | TRRAP | SOX4 | |
| HNRNPR | WHSC1 | Number of genes = 13 | |
| ILF3 | ZAP70 | ||
| Number of genes = 30 | |||
Cross verification analysis using housekeeping training genes (Chang et al., 2011) (Table 2) resulted in short-listing of 77 genes that were common to the three tools used (referred as housekeeping prioritized genes). Comparison with ALL prioritized genes showed that, although some of the prioritized genes obtained through ALL specific training genes also occur in the results from housekeeping training genes, their priority ranking was vastly different in both.
Functional enrichment of the prioritized genes was analyzed through WebGestalt software which showed that the 54 ALL prioritized genes were highly enriched in a diverse array of pathways such as Hemopoiesis (adjP = 1.91e−08), regulation of cell proliferation (adjP = 7.63e−08), chromatin modification (adjP = 6.72e−08), regulation of transcription (adjP = 1.17e−08) and regulation of biosynthetic processes (adjP = 3.17e−08) (Fig. 2). AdjP values signify P values obtained after multiple test adjustment using Bonferroni–Hochberg false discovery rate correction.
Figure 2.

Directed acyclic graph showing Gene Ontology of biological processes of the 54 prioritized genes (graph obtained from WebGestalt server).
KEGG Pathway enrichment of the 54 ALL prioritized genes, using KOBAS server, showed significant enrichment in normal and disease pathways such as primary immunodeficiency (corrected P-value = 0.000672), Transcriptional misregulation in cancer (corrected P-value = 0.000672), Adherens junction (corrected P-value = 0.044118), Pathways in cancer (corrected P-value = 0.044118), NF-kappa B signaling pathway (corrected P-value = 0.066325), and T cell receptor signaling pathway (corrected P-value = 0.085695). Further, we observed that the 77 housekeeping prioritized genes were enriched in the KEGG pathways: Ribosome (corrected P-value = 0.002727), Spliceosome (corrected P-value = 0.010555), Glycolysis/Gluconeogenesis (corrected P-value = 0.197154), Biosynthesis of amino acids (corrected P-value = 0.220077).
The differences in functional enrichment between ALL prioritized and housekeeping prioritized genes suggest that the genes prioritized from the ALL specific training genes may be significant in leukemogenesis as their enrichment analysis is populated by pathways that are known to be deregulated in ALL.
3.3. Protein–Protein Interaction (PPI) network
After identification of prioritized genes, we investigated protein associations using the STRING database. The PPI network using the 54 prioritized and 30 ALL specific training genes as query (seed), formed a dense network with 313 interacting proteins and 2405 interactions (Fig. 3), after removal of disconnected nodes. On grouping the network, the members within and between each cluster were observed to be highly interconnected, reflecting a high degree of functional association and suggesting interplay between the myriad pathways that comprise the protein network (Fig. 4).
Figure 3.

STRING database generated protein interaction network generated using prioritized and training protein names as query.
Figure 4.

STRING Protein–Protein Interaction network, separated into 12 k-Means clusters with clusters containing LCK, MEN1, SMAD2, HDAC1, CDK9 specifically highlighted.
3.4. Functional enrichment analysis of PPI network
Functional enrichment of the network interactors through WebGestalt server, using KEGG Pathway analysis filter, revealed that they participate in a wide variety of processes and pathways such as Cell cycle (adjP = 1.13e−45), apoptosis regulation (adjP = 1.12e−42), p53 signaling pathway (adjP = 8.22e−41), T-cell (adjP = 2.57e−34) and B-cell (adjP = 3.01e−20) receptor signaling pathways, MAPK signaling pathway (adjP = 8.47e−32), Wnt (adjP = 4.03e−27), Notch (adjP = 5.61e−26), TGF β (adjP = 2.38e−16) signaling pathways, and Hematopoietic cell lineage (adjP = 1.23e−14). Comparison of the pathways enriched in ALL specific training genes and the 54 prioritized genes showed that both sets of genes share many common cellular pathways. Our analysis of the PPI Network topology, using Network Analyser plugin in Cytoscape, revealed that it is a small world scale free network which follows power law (P(k) ∼ k−γ) of node degree distribution with a degree exponent of 0.923 and R2 of 0.684, where R2 signifies the fitness of data points to the curve. The clustering coefficient, which indicates cluster forming ability of a particular node, was 0.434.
3.5. Identification of hub genes
The network protein interactors were analyzed to determine hubs i.e. proteins that have the highest connectivity within a network and hence tend to be biologically significant. Through comparison of fifty hub genes, using degree and betweenness centrality algorithms, that were output by cytoHubba, we have identified five prioritized hubs as potential biomarker genes and therapeutic targets – SMAD2, CDK9, HDAC1, LCK and MEN1. These hubs were observed to function in the regulation of cell cycle, cell differentiation and hematopoiesis processes. Their prioritization and hubness suggest that they may be likely to play a crucial role in neoplastic transformation. These five genes were also found to be part of the clusters in the PPI network containing proteins involved in leukemogenesis.
Thus, our results highlight the functioning of the short-listed genes and their probable role in leukemogenesis and their use as novel therapeutic target genes.
4. Discussion
In our study, we have profiled overexpressed genes of biological and statistical significance in B- and T-ALL. Further, analysis of the 54 prioritized genes revealed 30 T-ALL upregulated and 13 B-ALL overexpressed genes (Table 3), which could be explored further as subtype specific drug targets and also for understanding leukemic transformation specific to T- and B-ALL. Also, the eleven genes common to both subtypes may regulate pathways common, to a certain extent, in both the subtypes and hence these could emerge as important targets of the disease.
The altered genes were found to function in cell growth and development processes that mediate the balance between actively dividing and quiescent hematopoietic stem cells (Arai and Suda, 2007). This suggests their possible role in the disruption of this balance, leading to increased leukemogenic transformation. Furthermore, the common pathways shared by the ALL training and 54 prioritized genes suggest that the prioritized genes may also contribute to pathogenesis, via molecular mechanisms that function in actively transforming normal hematopoietic stem cells into leukemic stem cells.
Our study in ALL is based on the need to further understand leukemogenesis as the exact mechanisms through which altered genes and pathways co-operate and lead to neoplastic transformation are still under investigation (Pui et al., 2011). Differential expression profiling of genes in leukemic samples is essential for identification of genes and pathways that are deregulated and thus involved in leukemogenesis. Gene set enrichment analysis studies by Andersson et al. (2010) have suggested unique expression profiles specific to leukemic cells that are different from those of other tissues and cancers, thus emphasizing the need for in depth analysis of expression datasets to discover new therapeutic targets and biomarkers for the disease.
In heterogeneous diseases, especially cancers, understanding functional associations could help provide better insights with respect to disease. The STRING protein interaction network generated in our study, was functionally enriched in many crucial pathways especially Notch, Wnt and T- and B-cell receptor signaling pathways which are among the most deregulated processes in ALL. This functional diversity was helpful in our study to highlight the multiple aberrant pathway modules that may act synergistically in leukemia initiation and subsequent disease process and hence may serve as drug targets. We also investigated the hub proteins in the network as they tend to play a significant role in regulation of cell processes and disease etiology and hence are prime targets for designing therapeutic ligands (Zotenko et al., 2008). Through hub analysis we have short-listed five important therapeutic targets – SMAD2, CDK9, MEN1, HDAC1, and LCK that could serve as potential biomarkers which were observed to be significantly upregulated in leukemic cells. These genes have crucial roles in regulating cell cycle proliferation and gene expression processes, therefore could serve as potential therapeutic targets and also as biomarkers for prognosis or diagnosis of leukemia. Of these, SMAD2 and CDK9 are novel findings and have not been reported earlier in leukemogenesis of ALL.
Alterations in HDAC1 have been reported in association with many cancers and its overexpression in T-ALL has been suggested to play a role in lymphocyte differentiation (Moreno et al., 2010). The components of HDAC1 cluster could play a role in disease progression via deregulated expression of their target genes, leading to an increase in the levels of cell survival genes and inhibition of apoptotic genes, resulting in loss of proliferation control and thus increase in neoplastic cell number.
Therapeutic strategies targeting LCK gene have been found effective against ALL malignant cells (Harr et al., 2010; De Keersmaecker et al., 2014). The close association of LCK cluster interactors suggests that alterations in one gene/protein may lead to a cascade event disrupting the signaling mechanisms, altering the cell fate determination process. Also, the members of LCK interaction cluster such as Zap70 and SYK (Fig. 4) have been previously observed to have altered expression in ALL and suggested to be possible prognostic markers for the disease (Ebeid et al., 2008).
MEN1 has been reported to be crucial in MLL leukemogenesis (Ichikawa et al., 2003; Caslini et al., 2007; Grembecka et al., 2010). Many of the interactors of MEN1 cluster, especially NOTCH1 (Lin et al., 2012), CCND1 (Aref et al., 2006) and LEF1 (Gutierrez et al., 2010) (Fig. 4), have been reported to be altered in leukemic cells, especially T-leukemia cells. The proteins in the MEN1 cluster may thus be important for T-lymphocyte mediated leukemogenesis and may therefore constitute important targets for T-ALL specific therapy.
The role of SMAD2 gene has been reported in other cancers such as Pancreatic cancer (Kleeff et al., 1999), and Colorectal cancer (Matsuzaki et al., 2009) wherein its alteration has been associated with malignant TGF-β signaling, poor prognosis and in metastasis (Oft et al., 2002), but no mutations in SMAD2 in ALL samples were observed (Wieser et al., 1998). However, in our study we report for the first time that its expression levels in the T-ALL datasets used for analysis were significantly high. It has also been identified as a prioritized hub gene in our study indicating that it could play an important role in the T-cell leukemogenesis, through altered TGFβ pathway, similar to other cancers. Alterations in the expression levels of the proteins in this cluster may contribute to loss of regulation of proliferation signals and apoptosis and thus lead to neoplastic transformation. As reviewed by Connolly et al. (2012), several studies have reported a remarked decrease in cancer cells on administration of antagonists of TGFβ/signaling pathway and hence a similar approach may also be useful in patients with increased expression of SMAD2 in ALL.
The cyclin dependent kinases (CDKs) help in proper initiation and elongation steps in the transcription process and studies have reported that their inhibition helps promote apoptosis in malignant cells and may prevent cytotoxicity due to deregulated pathways in altered cells (Shapiro, 2006). The overexpression of CDK9 in B-ALL indicates that it may contribute to neoplastic transformation of B-cells. Overexpression of CDK9 in other cancers such as certain lymphomas (Bellan et al., 2004) and Neuroblastoma (De Falco et al., 2005) has been associated with differentiation and proliferation status. Thus, CDK9 overexpression in B-ALL may deregulate cell cycle in B-lymphocytes and lead to leukemogenesis through promotion of increased cell division and targeting this gene may be useful in controlling aberrant proliferation in B-ALL. The diversity in the functional pathways of the interactors in this cluster suggests a possible role of their interconnectivity in the transmission of oncogenic signals.
The markers cited before i.e., NEGR1, IRX2, EPS8, TDP52 (Kang et al., 2012) and NOTCH1 (Lin et al., 2012), were reported to play a crucial role in disease progression. Since the genes short-listed in our study also function in related pathways, there may be a possibility of these genes influencing each other and contributing to leukemogenesis.
Although LCK, HDAC1 and MEN1 have previously been reported in association with ALL, our study emphasizes the importance of these genes, their proteins and their interactions in leukemogenesis. Our study has also identified two new genes, SMAD2 and CDK9 whose role in the neoplastic transformation of lymphocyte cells in ALL has not been emphasized earlier. Therefore, this study assigns new putative roles to these genes taking part in leukemogenesis as important hubs. Further, these two genes may serve as prognostic markers, since they play a critical role in regulation of cell growth. Since these five genes were generally among the top 2–5% overexpressed genes in the ALL data sets used in our analysis, they could be used to differentiate between ALL and healthy samples. Further, analysis of expression ranking of these genes in their respective datasets showed that, in case of HDAC1 there is a significant difference in its expression ranking between T-ALL (top 5%) and B-ALL (∼top 10–26%) and hence expression levels of this gene may also be used to differentiate between B- and T-ALL subtypes and between healthy and leukemic cells. Also, we observed that the RNA and protein expression levels of SMAD2 and CDK9 were high in MOLT4 and REH leukemic cell lines in the Human Protein Atlas database (Uhlen et al., 2010), which further supports the investigation of these genes as potential biomarkers in ALL and further exploration as targets for therapy. Though further validation via in vitro and in vivo methods may be needed we believe, that these genes are involved in leukemogenesis as they have also been reported to contribute to carcinogenesis of other neoplasms. Further, the statistical validation performed by each of the gene prioritization and network analysis tools used in our study support that the results we obtained are significant. Also, since our analysis includes expression studies from Childhood ALL, our results can especially be useful to understand which pathways function in disease progression and also in disease relapse in affected children, which is one of the utmost concerns in treatment failure.
Further, as reviewed by Chou and Shen (2009) and established by numerous research studies (such as Chen et al., 2013, 2014; Xiao et al., 2014; Xu et al., 2014), user-friendly and publicly accessible web-servers represent the future direction for developing more useful models and prediction methods and for demonstrating new and novel findings; hence, we shall endeavor in our future work to provide a web-server for the approach and findings presented in this paper.
5. Conclusions
In this study, we have aimed to decipher the significance of the complex molecular networks of proteins encoded by overexpressed genes, retrieved from Oncomine database. Our computational analysis has short-listed five genes, MEN1, SMAD2, CDK9, LCK and HDAC1, whose biological and functional relevance suggests their use as therapeutic targets and also as potential biomarkers and predictors of leukemogenesis in ALL. The use of interaction networks in our study led to identification of biological pathway modules, mediated by these genes that may aid in leukemogenesis. Further, the differential expression of the five short-listed genes suggests that they may be useful in segregation of ALL samples from controls. Due to their functional enrichment we believe that these genes could serve as potential biomarkers of prognosis and diagnosis and also the new genes identified in our study, SMAD2 and CDK9, could serve as novel targets for therapy. This information would be helpful in accurately diagnosing ALL and will be beneficial in improvement of clinical studies. Finally, we also point to some useful data mining and bioinformatics software packages that can be used for identifying novel biomarkers in cancer research.
Author contributions
K.J. – Conceived the idea, and helped in manuscript preparation, A.J. – worked on the project to get the results, and drafted the manuscript, H.A.K. – Reviewed the manuscript, and made suitable suggestions.
Competing financial interests
The authors declare no competing financial interests.
Acknowledgements
We are grateful to JNIAS for the facilities provided. Dr. H.A.K extends his appreciation to the Deanship of Scientific Research at King Saud University, Riyadh, Saudi Arabia for partial support of this work through the research group project No. RGP-VPP-009.
Footnotes
Peer review under responsibility of King Saud University.
References
- Andersson A., Ritz C., Lindgren D., Edén P., Lassen C., Heldrup J., Olofsson T., Råde J., Fontes M., Porwit-Macdonald A., Behrendtz M., Höglund M., Johansson B., Fioretos T. Microarray-based classification of a consecutive series of 121 childhood acute leukemias: prediction of leukemic and genetic subtype as well as of minimal residual disease status. Leukemia. 2007;21:1198–1203. doi: 10.1038/sj.leu.2404688. [DOI] [PubMed] [Google Scholar]
- Andersson A., Edén P., Olofsson T., Fioretos T. Gene expression signatures in childhood acute leukemias are largely unique and distinct from those of normal tissues and other malignancies. BMC Med. Genomics. 2010;3:6–13. doi: 10.1186/1755-8794-3-6. [DOI] [PMC free article] [PubMed] [Google Scholar]
- Arai F., Suda T. Maintenance of quiescent hematopoietic stem cells in the osteoblastic niche. Ann. N. Y. Acad. Sci. 2007;1106:41–53. doi: 10.1196/annals.1392.005. [DOI] [PubMed] [Google Scholar]
- Aref S., Mabed M., El-Sherbiny M., Selim T., Metwaly A. Cyclin D1 expression in acute leukemia. Hematology. 2006;11:31–34. doi: 10.1080/10245330500322321. [DOI] [PubMed] [Google Scholar]
- Assenov Y., Ramírez F., Schelhorn S.E., Lengauer T., Albrecht M. Computing topological parameters of biological networks. Bioinformatics. 2008;24:282–284. doi: 10.1093/bioinformatics/btm554. [DOI] [PubMed] [Google Scholar]
- Barabási A.L., Oltvai Z.N. Network biology: understanding the cell’s functional organization. Nat. Rev. Genet. 2004;5:101–113. doi: 10.1038/nrg1272. [DOI] [PubMed] [Google Scholar]
- Baudis M., Prima V., Tung Y.H., Hunger S.P. ABCB1 over-expression and drug-efflux in acute lymphoblastic leukemia cell lines with t(17;19) and E2A-HLF expression. Pediatr. Blood Cancer. 2006;47:757–764. doi: 10.1002/pbc.20635. [DOI] [PubMed] [Google Scholar]
- Bellan C., De Falco G., Lazzi S., Micheli P., Vicidomini S., Schürfeld K., Amato T., Palumbo A., Bagella L., Sabattini E., Bartolommei S., Hummel M., Pileri S., Tosi P., Leoncini L., Giordano A. CDK9/CYCLIN T1 expression during normal lymphoid differentiation and malignant transformation. J. Pathol. 2004;203:946–952. doi: 10.1002/path.1588. [DOI] [PubMed] [Google Scholar]
- Bhojwani D., Kang H., Moskowitz N.P., Min D.J., Lee H., Potter J.W., Davidson G., Willman C.L., Borowitz M.J., Belitskaya-Levy I., Hunger S.P., Raetz E.A., Carroll W.L. Biologic pathways associated with relapse in childhood acute lymphoblastic leukemia: a Children’s Oncology Group study. Blood. 2006;108:711–717. doi: 10.1182/blood-2006-02-002824. [DOI] [PMC free article] [PubMed] [Google Scholar]
- Cabreiro F., Picot C.R., Perichon M., Castel J., Friguet B., Petropoulos I. Overexpression of mitochondrial methionine sulfoxide reductase B2 protects leukemia cells from oxidative stress-induced cell death and protein damage. J. Biol. Chem. 2008;283:16673–16681. doi: 10.1074/jbc.M708580200. [DOI] [PubMed] [Google Scholar]
- Cardone M., Kandilci A., Carella C., Nilsson J.A., Brennan J.A., Sirma S., Ozbek U., Boyd K., Cleveland J.L., Grosveld G.C. The novel ETS factor TEL2 cooperates with Myc in B lymphomagenesis. Mol. Cell Biol. 2005;25:2395–2405. doi: 10.1128/MCB.25.6.2395-2405.2005. [DOI] [PMC free article] [PubMed] [Google Scholar]
- Caslini C., Yang Z., El-Osta M., Milne T.A., Slany R.K., Hess J.L. Interaction of MLL amino terminal sequences with menin is required for transformation. Cancer Res. 2007;67:7275–7283. doi: 10.1158/0008-5472.CAN-06-2369. [DOI] [PMC free article] [PubMed] [Google Scholar]
- Chaiboonchoe A., Samarasinghe S., Kulasiri D., Salehi-Ashtiani K. Integrated analysis of gene network in childhood leukemia from microarray and pathway databases. Biomed. Res. Int. 2014;2014:278748. doi: 10.1155/2014/278748. [DOI] [PMC free article] [PubMed] [Google Scholar]
- Chang C.W., Cheng W.C., Chen C.R., Shu W.Y., Tsai M.L., Huang C.L., Hsu I.C. Identification of human housekeeping genes and tissue-selective genes by microarray meta-analysis. PLoS One. 2011;6:e22859. doi: 10.1371/journal.pone.0022859. [DOI] [PMC free article] [PubMed] [Google Scholar]
- Chen J., Bardes E.E., Aronow B.J., Jegga A.G. ToppGene suite for gene list enrichment analysis and candidate gene prioritization. Nucleic Acids Res. 2009;37(Web Server issue):W305–W311. doi: 10.1093/nar/gkp427. [DOI] [PMC free article] [PubMed] [Google Scholar]
- Chen W., Feng P.M., Lin H. IRSpot-PseDNC: identify recombination spots with pseudo dinucleotide composition. Nucleic Acids Res. 2013;41:e68. doi: 10.1093/nar/gks1450. [DOI] [PMC free article] [PubMed] [Google Scholar]
- Chen W., Lei T.Y., Jin D.C., Lin H. PseKNC: a flexible web-server for generating pseudo K-tuple nucleotide composition. Anal. Biochem. 2014;456:53–60. doi: 10.1016/j.ab.2014.04.001. [DOI] [PubMed] [Google Scholar]
- Chen Y., Wang W., Zhou Y., Shields R., Chanda S.K., Elston R.C., Li J. In silico gene prioritization by integrating multiple data sources. PLoS One. 2011;6:e21137. doi: 10.1371/journal.pone.0021137. [DOI] [PMC free article] [PubMed] [Google Scholar]
- Chiaretti S., Tavolaro S., Ghia E.M., Ariola C., Matteucci C., Elia L., Maggio R., Messina M., Ricciardi M.R., Vitale A., Ritz J., Mecucci C., Guarini A., Foà R. Characterization of ABL1 expression in adult T-cell acute lymphoblastic leukemia by oligonucleotide array analysis. Haematologica. 2007;92:619–626. doi: 10.3324/haematol.10865. [DOI] [PubMed] [Google Scholar]
- Choi J., Hwang Y.K., Sung K.W., Kim D.H., Yoo K.H., Jung H.L., Koo H.H. Aven overexpression: association with poor prognosis in childhood acute lymphoblastic leukemia. Leuk. Res. 2006;30:1019–1025. doi: 10.1016/j.leukres.2005.11.001. [DOI] [PubMed] [Google Scholar]
- Choi J., Hwang Y.K., Sung K.W., Lee S.H., Yoo K.H., Jung H.L., Koo H.H., Kim H.J., Kang H.J., Shin H.Y., Ahn H.S. Expression of Livin, an antiapoptotic protein, is an independent favorable prognostic factor in childhood acute lymphoblastic leukemia. Blood. 2007;109:471–477. doi: 10.1182/blood-2006-07-032557. [DOI] [PubMed] [Google Scholar]
- Chou K.C. Prediction of protein cellular attributes using pseudo amino acid composition. Proteins. 2001;43:246–255. doi: 10.1002/prot.1035. (Erratum: 44, 60) [DOI] [PubMed] [Google Scholar]
- Chou K.C., Shen H.B. Review: recent advances in developing web-servers for predicting protein attributes. Nat. Sci. 2009;1:63–92. [Google Scholar]
- Connolly E.C., Freimuth J., Akhurst R.J. Complexities of TGF-β targeted cancer therapy. Int. J. Biol. Sci. 2012;8:964–978. doi: 10.7150/ijbs.4564. [DOI] [PMC free article] [PubMed] [Google Scholar]
- Coustan-Smith E., Kitanaka A., Pui C.H., McNinch L., Evans W.E., Raimondi S.C., Behm F.G., Aricò M., Campana D. Clinical relevance of BCL-2 overexpression in childhood acute lymphoblastic leukemia. Blood. 1996;87:1140–1146. [PubMed] [Google Scholar]
- De Falco G., Bellan C., D’Amuri A., Angeloni G., Leucci E., Giordano A., Leoncini L. Cdk9 regulates neural differentiation and its expression correlates with the differentiation grade of neuroblastoma and PNET tumors. Cancer Biol. Ther. 2005;4:277–281. doi: 10.4161/cbt.4.3.1497. [DOI] [PubMed] [Google Scholar]
- De Keersmaecker K., Porcu M., Cox L., Girardi T., Vandepoel R., de Beeck J.O., Gielen O., Mentens N., Bennett K.L., Hantschel O. NUP214-ABL1-mediated cell proliferation in T-cell acute lymphoblastic leukemia is dependent on the LCK kinase and various interacting proteins. Haematologica. 2014;99:85–93. doi: 10.3324/haematol.2013.088674. [DOI] [PMC free article] [PubMed] [Google Scholar]
- Desany B., Zhang Z. Bioinformatics and cancer target discovery. Drug Discov. Today. 2004;9:795–802. doi: 10.1016/S1359-6446(04)03224-6. [DOI] [PubMed] [Google Scholar]
- DiGiuseppe J.A., Fuller S.G., Borowitz M.J. Overexpression of CD49f in precursor B-cell acute lymphoblastic leukemia: potential usefulness in minimal residual disease detection. Cytometry B Clin. Cytom. 2009;76:150–155. doi: 10.1002/cyto.b.20440. [DOI] [PubMed] [Google Scholar]
- Ebeid E., Kamel M., Moussa H., Galal U. ZAP-70 as a possible prognostic factor in childhood acute lymphoblastic leukemia. J. Egypt. Natl. Canc. Inst. 2008;20:121–126. [PubMed] [Google Scholar]
- Esh A.M., Atfy M., Azizi N.A., El Naggar M.M., Khalil E.E., Sherief L. Prognostic significance of survivin in pediatric acute lymphoblastic leukemia. Indian J. Hematol. Blood Transfus. 2011;27:18–25. doi: 10.1007/s12288-010-0053-z. [DOI] [PMC free article] [PubMed] [Google Scholar]
- Ferrando A.A., Look A.T. Gene expression profiling in T-cell acute lymphoblastic leukemia. Semin. Hematol. 2003;40:274–280. doi: 10.1016/s0037-1963(03)00195-1. [DOI] [PubMed] [Google Scholar]
- Gao H.Y., Luo X.G., Chen X., Wang J.H. Identification of key genes affecting disease free survival time of pediatric acute lymphoblastic leukemia based on bioinformatic analysis. Blood Cells Mol. Dis. 2014 doi: 10.1016/j.bcmd.2014.08.002. pii: S1079-9796(14)00103-X. [DOI] [PubMed] [Google Scholar]
- Grembecka J., Belcher A.M., Hartley T., Cierpicki T. Molecular basis of the mixed lineage leukemia–menin interaction: implications for targeting mixed lineage leukemias. J. Biol. Chem. 2010;285:40690–40698. doi: 10.1074/jbc.M110.172783. [DOI] [PMC free article] [PubMed] [Google Scholar]
- Gutierrez A., Sanda T., Ma W., Zhang J., Grebliunaite R., Dahlberg S., Neuberg D., Protopopov A., Winter S.S., Larson R.S., Borowitz M.J., Silverman L.B., Chin L., Hunger S.P., Jamieson C., Sallan S.E., Look A.T. Inactivation of LEF1 in T-cell acute lymphoblastic leukemia. Blood. 2010;115:2845–2851. doi: 10.1182/blood-2009-07-234377. [DOI] [PMC free article] [PubMed] [Google Scholar]
- Haferlach T., Kohlmann A., Wieczorek L., Basso G., Kronnie G.T., Béné M.C., De Vos J., Hernández J.M., Hofmann W.K., Mills K.I., Gilkes A., Chiaretti S., Shurtleff S.A., Kipps T.J., Rassenti L.Z., Yeoh A.E., Papenhausen P.R., Liu W.M., Williams P.M., Foà R. Clinical utility of microarray-based gene expression profiling in the diagnosis and subclassification of leukemia: report from the International Microarray Innovations in Leukemia Study Group. J. Clin. Oncol. 2010;28:2529–2537. doi: 10.1200/JCO.2009.23.4732. [DOI] [PMC free article] [PubMed] [Google Scholar]
- Hajisharifi Z., Piryaiee M., Mohammad Beigi M., Behbahani M., Mohabatkar H. Predicting anticancer peptides with Chou’s pseudo amino acid composition and investigating their mutagenicity via Ames test. J. Theor. Biol. 2014;341:34–40. doi: 10.1016/j.jtbi.2013.08.037. [DOI] [PubMed] [Google Scholar]
- Harr M.W., Caimi P.F., McColl K.S., Zhong F., Patel S.N., Barr P.M., Distelhorst C.W. Inhibition of Lck enhances glucocorticoid sensitivity and apoptosis in lymphoid cell lines and in chronic lymphocytic leukemia. Cell Death Differ. 2010;17:1381–1391. doi: 10.1038/cdd.2010.25. [DOI] [PMC free article] [PubMed] [Google Scholar]
- Hendy O.M., Elghannam D.M., El-Sharnouby J.A., Goda E.F., El-Ashry R., Al-Tonbary Y. Frequency and prognostic significance of murine double minute protein-2 overexpression and p53 gene mutations in childhood acute lymphoblastic leukemia. Hematology. 2009;14:335–340. doi: 10.1179/102453309X12473408860389. [DOI] [PubMed] [Google Scholar]
- Hidaka H., Yagasaki H., Takahashi Y., Hama A., Nishio N., Tanaka M., Yoshida N., Villalobos I.B., Wang Y., Xu Y., Horibe K., Chen S., Kadomatsu K., Kojima S. Increased midkine gene expression in childhood B-precursor acute lymphoblastic leukemia. Leuk. Res. 2007;31:1045–1051. doi: 10.1016/j.leukres.2006.12.008. [DOI] [PubMed] [Google Scholar]
- Holleman A., den Boer M.L., de Menezes R.X., Cheok M.H., Cheng C., Kazemier K.M., Janka-Schaub G.E., Göbel U., Graubner U.B., Evans W.E., Pieters R. The expression of 70 apoptosis genes in relation to lineage, genetic subtype, cellular drug resistance, and outcome in childhood acute lymphoblastic leukemia. Blood. 2006;107:769–776. doi: 10.1182/blood-2005-07-2930. [DOI] [PMC free article] [PubMed] [Google Scholar]
- Huang T., Chen L., Cai Y.D. Classification and analysis of regulatory pathways using graph property, biochemical and physicochemical property, and functional property. PLoS One. 2011;6:e25297. doi: 10.1371/journal.pone.0025297. [DOI] [PMC free article] [PubMed] [Google Scholar]
- Hundsdoerfer P., Dietrich I., Schmelz K., Eckert C., Henze G. XIAP expression is post-transcriptionally upregulated in childhood ALL and is associated with glucocorticoid response in T-cell ALL. Pediatr. Blood Cancer. 2010;55:260–266. doi: 10.1002/pbc.22541. [DOI] [PubMed] [Google Scholar]
- Ichikawa N., Kobayashi H., Saito H. Ph1-positive acute lymphoblastic leukemia in a patient with a germline MEN1 gene mutation. Int. J. Hematol. 2003;78:171–172. doi: 10.1007/BF02983389. [DOI] [PubMed] [Google Scholar]
- Inthal A., Krapf G., Beck D., Joas R., Kauer M.O., Orel L., Fuka G., Mann G., Panzer-Grümayer E.R. Role of the erythropoietin receptor in ETV6/RUNX1-positive acute lymphoblastic leukemia. Clin. Cancer Res. 2008;14:7196–7204. doi: 10.1158/1078-0432.CCR-07-5051. [DOI] [PMC free article] [PubMed] [Google Scholar]
- Jamil K., Sabeena M. Identification of functional diversity in the enolase superfamily proteins. In: Lopes H.S., Cruz L.M., editors. Computational Biology and Applied Bioinformatics. InTech; 2011. pp. 311–328. [Google Scholar]
- Jayaraman A., Jamil K. Clusters of CDK2, CCND1, and CMYC genes involved in cancers, acute lymphocytic leukemia, ALL as a model. Biol. Med. 2012;4:37–50. [Google Scholar]
- Jayaraman A., Jamil K. Mapping the p53 gene using STRING software to study the alterations modulating the functioning of associated genes in leukemia. Indian J. Biotechnol. 2013;12:451–461. [Google Scholar]
- Jayaraman A., Jamil K. Drug targets for cell cycle dysregulators in leukemogenesis: in silico docking studies. PLoS One. 2014;9:e86310. doi: 10.1371/journal.pone.0086310. [DOI] [PMC free article] [PubMed] [Google Scholar]
- Jayaraman A., Jamil K., Raju S. The interaction of p53 and MDM2 genes in cancers, in silico studies and phylogenetic analysis. Biol. Med. 2011;3:01–12. [Google Scholar]
- Kang H., Wilson C.S., Harvey R.C., Chen I.M., Murphy M.H., Atlas S.R., Bedrick E.J., Devidas M., Carroll A.J., Robinson B.W., Stam R.W., Valsecchi M.G., Pieters R., Heerema N.A., Hilden J.M., Felix C.A., Reaman G.H., Camitta B., Winick N., Carroll W.L., Dreyer Z.E., Hunger S.P., Willman C.L. Gene expression profiles predictive of outcome and age in infant acute lymphoblastic leukemia: a Children’s Oncology Group study. Blood. 2012;119:1872–1881. doi: 10.1182/blood-2011-10-382861. [DOI] [PMC free article] [PubMed] [Google Scholar]
- Khalid S., Moiz B., Adil S.N., Khurshid M. Retrospective review of pediatric patients with acute lymphoblastic leukemia: a single center experience. Indian J. Pathol. Microbiol. 2010;53:704–710. doi: 10.4103/0377-4929.72044. [DOI] [PubMed] [Google Scholar]
- Khan M., Jamil K. Clustering cancer metasignature genes, identification of cellular profiles of neoplastic and undifferentiated stages of cancer. Res. J. BioTech. 2008;3:11–17. [Google Scholar]
- Kleeff J., Friess H., Simon P., Susmallian S., Büchler P., Zimmermann A., Büchler M.W., Korc M. Overexpression of Smad2 and colocalization with TGF-beta1 in human pancreatic cancer. Dig. Dis. Sci. 1999;44:1793–1802. doi: 10.1023/a:1018882320500. [DOI] [PubMed] [Google Scholar]
- Kühnl A., Gökbuget N., Kaiser M., Schlee C., Stroux A., Burmeister T., Mochmann L.H., Hoelzer D., Hofmann W.K., Thiel E., Baldus C.D. Overexpression of LEF1 predicts unfavorable outcome in adult patients with B-precursor acute lymphoblastic leukemia. Blood. 2011;118:6362–6367. doi: 10.1182/blood-2011-04-350850. [DOI] [PubMed] [Google Scholar]
- Li B.Q., Huang T., Liu L., Cai Y.D. Identification of colorectal cancer related genes with mRMR and shortest path in protein–protein interaction network. PLoS ONE. 2012;7:e33393. doi: 10.1371/journal.pone.0033393. [DOI] [PMC free article] [PubMed] [Google Scholar]
- Lin C., Zheng H., Wang C., Yang L., Chen S., Li B., Zhou Y., Tan H., Li Y. Mutations increased overexpression of Notch1 in T-cell acute lymphoblastic leukemia. Cancer Cell Int. 2012;12:13–18. doi: 10.1186/1475-2867-12-13. [DOI] [PMC free article] [PubMed] [Google Scholar]
- Lin C.Y., Chin C.H., Wu H.H., Chen S.H., Ho C.W., Ko M.T. Hubba: hub objects analyzer – a framework of interactome hubs identification for network biology. Nucleic Acids Res. 2008;36(Web Server issue):W438–W443. doi: 10.1093/nar/gkn257. [DOI] [PMC free article] [PubMed] [Google Scholar]
- Ma C., Chen H.I., Flores M., Huang Y., Chen Y. BRCA-Monet: a breast cancer specific drug treatment mode-of-action network for treatment effective prediction using large scale microarray database. BMC Syst. Biol. 2013;7(Suppl. 5):S5. doi: 10.1186/1752-0509-7-S5-S5. [DOI] [PMC free article] [PubMed] [Google Scholar]
- MacQueen J. Some Methods for classification and Analysis of Multivariate Observations. Vol. 1. University of California Press; Berkeley: 1967. pp. 281–297. (Proceedings of 5th Berkeley Symposium on Mathematical Statistics and Probability). [Google Scholar]
- Maia S., Haining W.N., Ansén S., Xia Z., Armstrong S.A., Seth N.P., Ghia P., den Boer M.L., Pieters R., Sallan S.E., Nadler L.M., Cardoso A.A. Gene expression profiling identifies BAX-delta as a novel tumor antigen in acute lymphoblastic leukemia. Cancer Res. 2005;65:10050–10058. doi: 10.1158/0008-5472.CAN-05-1574. [DOI] [PubMed] [Google Scholar]
- Maiorov E.G., Keskin O., Ng O.H., Ozbek U., Gursoy A. Identification of interconnected markers for T-cell acute lymphoblastic leukemia. Biomed. Res. Int. 2013;2013:210253. doi: 10.1155/2013/210253. [DOI] [PMC free article] [PubMed] [Google Scholar]
- Mardia K.V., Kent J.T., Bibby J.M. Academic Press; 1979. Multivariate Analysis. [Google Scholar]
- Matsuzaki K., Kitano C., Murata M., Sekimoto G., Yoshida K., Uemura Y., Seki T., Taketani S., Fujisawa J., Okazaki K. Smad2 and Smad3 phosphorylated at both linker and COOH-terminal regions transmit malignant TGF-beta signal in later stages of human colorectal cancer. Cancer Res. 2009;69:5321–5330. doi: 10.1158/0008-5472.CAN-08-4203. [DOI] [PubMed] [Google Scholar]
- Mikhail F.M., Serry K.A., Hatem N., Mourad Z.I., Farawela H.M., El Kaffash D.M., Coignet L., Nucifora G. AML1 gene over-expression in childhood acute lymphoblastic leukemia. Leukemia. 2002;16:658–668. doi: 10.1038/sj.leu.2402399. [DOI] [PubMed] [Google Scholar]
- Moreno D.A., Scrideli C.A., Cortez M.A., de Paula Queiroz R., Valera E.T., da Silva Silveira V., Yunes J.A., Brandalise S.R., Tone L.G. Differential expression of HDAC3, HDAC7 and HDAC9 is associated with prognosis and survival in childhood acute lymphoblastic leukaemia. Br. J. Haematol. 2010;150:665–673. doi: 10.1111/j.1365-2141.2010.08301.x. [DOI] [PubMed] [Google Scholar]
- Oft M., Akhurst R.J., Balmain A. Metastasis is driven by sequential elevation of H-ras and Smad2 levels. Nat. Cell Biol. 2002;4:487–494. doi: 10.1038/ncb807. [DOI] [PubMed] [Google Scholar]
- Palermo R., Checquolo S., Giovenco A., Grazioli P., Kumar V., Campese A.F., Giorgi A., Napolitano M., Canettieri G., Ferrara G., Schininà M.E., Maroder M., Frati L., Gulino A., Vacca A., Screpanti I. Acetylation controls Notch3 stability and function in T-cell leukemia. Oncogene. 2012;31:3807–3817. doi: 10.1038/onc.2011.533. [DOI] [PubMed] [Google Scholar]
- Pui C.H., Carroll W.L., Meshinchi S., Arceci R.J. Biology, risk stratification, and therapy of pediatric acute leukemias: an update. J. Clin. Oncol. 2011;29:551–565. doi: 10.1200/JCO.2010.30.7405. [DOI] [PMC free article] [PubMed] [Google Scholar]
- Rhodes D.R., Kalyana-Sundaram S., Mahavisno V., Varambally R., Yu J., Briggs B.B., Barrette T.R., Anstet M.J., Kincead-Beal C., Kulkarni P., Varambally S., Ghosh D., Chinnaiyan A.M. Oncomine 3.0: genes, pathways, and networks in a collection of 18,000 cancer gene expression profiles. Neoplasia. 2007;9:166–180. doi: 10.1593/neo.07112. [DOI] [PMC free article] [PubMed] [Google Scholar]
- Ruiz A., Jiang J., Kempski H., Brady H.J. Overexpression of the Ikaros 6 isoform is restricted to t(4;11) acute lymphoblastic leukaemia in children and infants and has a role in B-cell survival. Br. J. Haematol. 2004;125:31–37. doi: 10.1111/j.1365-2141.2004.04854.x. [DOI] [PubMed] [Google Scholar]
- Shabani M., Asgarian-Omran H., Vossough P., Sharifian R.A., Faranoush M., Ghragozlou S., Khoshnoodi J., Roohi A., Jeddi-Tehrani M., Mellstedt H., Rabbani H., Shokri F. Expression profile of orphan receptor tyrosine kinase (ROR1) and Wilms’ tumor gene 1 (WT1) in different subsets of B-cell acute lymphoblastic leukemia. Leuk. Lymphoma. 2008;49:1360–1367. doi: 10.1080/10428190802124000. [DOI] [PubMed] [Google Scholar]
- Shaheen I., Ibrahim N. Detection of orphan receptor tyrosine kinase (ROR-1) expression in Egyptian pediatric acute lymphoblastic leukemia. Fetal Pediatr. Pathol. 2012;31:113–119. doi: 10.3109/15513815.2012.656825. [DOI] [PubMed] [Google Scholar]
- Shaik A.P., Jamil K., Das P. CYP1A1 polymorphisms and risk of prostate cancer: a meta-analysis. Urol. J. 2009;6:78–86. [PubMed] [Google Scholar]
- Shapiro G.I. Cyclin-dependent kinase pathways as targets for cancer treatment. J. Clin. Oncol. 2006;24:1770–1783. doi: 10.1200/JCO.2005.03.7689. [DOI] [PubMed] [Google Scholar]
- Smith M.A., Seibel N.L., Altekruse S.F., Ries L.A., Melbert D.L., O’Leary M., Smith F.O., Reaman G.H. Outcomes for children and adolescents with cancer: challenges for the twenty-first century. J. Clin. Oncol. 2010;28:2625–2634. doi: 10.1200/JCO.2009.27.0421. [DOI] [PMC free article] [PubMed] [Google Scholar]
- Smoot M.E., Ono K., Ruscheinski J., Wang P.L., Ideker T. Cytoscape 2.8: new features for data integration and network visualization. Bioinformatics. 2011;27:431–432. doi: 10.1093/bioinformatics/btq675. [DOI] [PMC free article] [PubMed] [Google Scholar]
- Szklarczyk D., Franceschini A., Kuhn M., Simonovic M., Roth A., Minguez P., Doerks T., Stark M., Muller J., Bork P., Jensen L.J., von Mering C. The STRING database in 2011: functional interaction networks of proteins, globally integrated and scored. Nucleic Acids Res. 2011;39:D561–D568. doi: 10.1093/nar/gkq973. [Database issue] [DOI] [PMC free article] [PubMed] [Google Scholar]
- Tasian S.K., Loh M.L. Understanding the biology of CRLF2-overexpressing acute lymphoblastic leukemia. Crit. Rev. Oncog. 2011;16:13–24. doi: 10.1615/critrevoncog.v16.i1-2.30. [DOI] [PMC free article] [PubMed] [Google Scholar]
- Thoene S., Rawat V.P., Heilmeier B., Hoster E., Metzeler K.H., Herold T., Hiddemann W., Gökbuget N., Hoelzer D., Bohlander S.K., Feuring-Buske M., Buske C. The homeobox gene CDX2 is aberrantly expressed and associated with an inferior prognosis in patients with acute lymphoblastic leukemia. Leukemia. 2009;23:649–655. doi: 10.1038/leu.2008.355. [DOI] [PubMed] [Google Scholar]
- Tranchevent L., Barriot R., Yu S., Van Vooren S., Van Loo P., Coessens B., De Moor B., Aerts S., Moreau Y. ENDEAVOUR update: a web resource for gene prioritization in multiple species. Nucleic Acids Res. 2008;36(Web Server issue):W377–W384. doi: 10.1093/nar/gkn325. [DOI] [PMC free article] [PubMed] [Google Scholar]
- Uhlen M., Oksvold P., Fagerberg L., Lundberg E., Jonasson K., Forsberg M., Zwahlen M., Kampf C., Wester K., Hober S., Wernerus H., Björling L., Ponten F. Towards a knowledge-based human protein atlas. Nat. Biotechnol. 2010;28:1248–1250. doi: 10.1038/nbt1210-1248. [DOI] [PubMed] [Google Scholar]
- Wang X. Role of clinical bioinformatics in the development of network-based biomarkers. J. Clin. Bioinform. 2011;11:28. doi: 10.1186/2043-9113-1-28. [DOI] [PMC free article] [PubMed] [Google Scholar]
- Wang Y., Chang N., Zhang T., Liu H., Ma W., Chu Q., Lai Q., Liu L., Wang W. Overexpression of human CAP10-like protein 46 KD in T-acute lymphoblastic leukemia and acute myelogenous leukemia. Genet. Test Mol. Biomarkers. 2010;14:127–133. doi: 10.1089/gtmb.2009.0145. [DOI] [PubMed] [Google Scholar]
- Wieser R., Gruber B., Rieder H., Fonatsch C. Mutational analysis of the tumor suppressor Smad2 in acute lymphoid and myeloid leukemia. Leukemia. 1998;12:1114–1118. doi: 10.1038/sj.leu.2401073. [DOI] [PubMed] [Google Scholar]
- Xiao X., Min J.L., Lin W.Z., Liu Z. IDrug-Target: predicting the interactions between drug compounds and target proteins in cellular networking via the benchmark dataset optimization approach. J. Biomol. Struct. Dyn. 2014;1–27 doi: 10.1080/07391102.2014.998710. [DOI] [PubMed] [Google Scholar]
- Xie C., Mao X., Huang J., Ding Y., Wu J., Dong S., Kong L., Gao G., Li C., Wei L. KOBAS 2.0: a web server for annotation and identification of enriched pathways and diseases. Nucleic Acids Res. 2011;39:W316–W322. doi: 10.1093/nar/gkr483. [DOI] [PMC free article] [PubMed] [Google Scholar]
- Xu Y., Wen X., Shao X.J., Deng N.Y. IHyd-PseAAC: predicting hydroxyproline and hydroxylysine in proteins by incorporating dipeptide position-specific propensity into pseudo amino acid composition. Int. J. Mol. Sci. 2014;15:7594–7610. doi: 10.3390/ijms15057594. [DOI] [PMC free article] [PubMed] [Google Scholar]
- Zhang B., Kirov S.A., Snoddy J.R. WebGestalt: an integrated system for exploring gene sets in various biological contexts. Nucleic Acids Res. 2005;(Web Server issue):W741–W748. doi: 10.1093/nar/gki475. [DOI] [PMC free article] [PubMed] [Google Scholar]
- Zhang Y., van Deursen J., Galardy P.J. Overexpression of ubiquitin specific protease 44 (USP44) induces chromosomal instability and is frequently observed in human T-cell leukemia. PLoS One. 2011;6:e23389. doi: 10.1371/journal.pone.0023389. [DOI] [PMC free article] [PubMed] [Google Scholar]
- Zotenko E., Mestre J., O’Leary D.P., Przytycka T.M. Why do hubs in the yeast protein interaction network tend to be essential: reexamining the connection between the network topology and essentiality. PLoS Comput. Biol. 2008;4:e1000140. doi: 10.1371/journal.pcbi.1000140. [DOI] [PMC free article] [PubMed] [Google Scholar]