

Abstract
The ability to increase fatty acid oxidation (FAO) in response to dietary lipid is impaired in the skeletal muscle of obese individuals, which is associated with a failure to coordinately upregulate genes involved with FAO. While the molecular mechanisms contributing to this metabolic inflexibility are not evident, a possible candidate is carnitine palmitoyltransferase-1B (CPT1B), which is a rate-limiting step in FAO. The present study was undertaken to determine if the differential response of skeletal muscle CPT1B gene transcription to lipid between lean and severely obese subjects is linked to epigenetic modifications (DNA methylation and histone acetylation) that impact transcriptional activation. In primary human skeletal muscle cultures the expression of CPT1B was blunted in severely obese women compared with their lean counterparts in response to lipid, which was accompanied by changes in CpG methylation, H3/H4 histone acetylation, and peroxisome proliferator-activated receptor-δ and hepatocyte nuclear factor 4α transcription factor occupancy at the CPT1B promoter. Methylation of specific CpG sites in the CPT1B promoter that correlated with CPT1B transcript level blocked the binding of the transcription factor upstream stimulatory factor, suggesting a potential causal mechanism. These findings indicate that epigenetic modifications may play important roles in the regulation of CPT1B in response to a physiologically relevant lipid mixture in human skeletal muscle, a major site of fatty acid catabolism, and that differential DNA methylation may underlie the depressed expression of CPT1B in response to lipid, contributing to the metabolic inflexibility associated with severe obesity.
Keywords: obesity, DNA methylation, skeletal muscle, lipid metabolism, gene regulation
mounting evidence indicates that metabolic diseases such as obesity, type 2 diabetes, and insulin resistance are associated with an inability to oxidize lipids (12) and adjust substrate oxidation according to nutrient availability, termed “metabolic flexibility” (24). These impairments are particularly evident in the severely obese (Class III; BMI >40 kg/m2), where there is an impaired ability to oxidize lipid (fatty acid oxidation, FAO) in skeletal muscle and an inability to increase skeletal muscle FAO in response to a high-fat diet (3, 25). These decrements likely contribute to ectopic lipid accumulation, which in turn is associated with insulin resistance, weight gain (13), and weight regain after weight loss (46).
The molecular mechanisms contributing to this inability to oxidize lipid with severe obesity are, however, not evident. A possible candidate is the expression level of carnitine palmitoyltransferase (CPT1), which mediates the transfer of long-chain fatty acids across the outer mitochondrial membrane and is a rate-limiting step in FAO (28). The activity of muscle-specific CPT1 (encoded by the CPT1B gene) is reduced in skeletal muscle with obesity, contributing to a decrease in FAO (25). Conversely, overexpression of CPT1 in skeletal muscle produces an increase in FAO, which in turn negates the detrimental effects of a high-fat diet, such as intracellular lipid accumulation and insulin resistance (9). In relation to metabolic flexibility, in the skeletal muscle of lean subjects, a high-fat diet increased the expression of CTP1B and the peroxisome proliferator-activated receptors (PPARs), which are upstream regulators of CPT1B expression (6). However, a high-fat diet resulted in little to no change in the expression of these genes in the skeletal muscle of severely obese subjects (6). These data indicate a differential response to lipid with obesity that could contribute to positive lipid balance.
Acute epigenetic modifications of the genome, such as DNA methylation and histone acetylation, may provide a connection between nutritional factors, gene expression, and metabolic health. For example, DNA methylation can affect promoter activity by impeding the binding of transcription factors to their target sites and by mediating the establishment of repressive chromatin structure through the recruitment of methyl-binding domain protein (MBD)-containing complexes, thereby reducing gene expression. Histone acetylation is associated with a decondensed chromatin structure that facilitates the accessibility of transcriptional machinery to DNA binding sites in chromatin, in turn increasing gene transcription. Conversely, histone deacetylation is associated with a more condensed chromatin structure and may induce other epigenetic modifications, such as DNA methylation, leading to a decrease in gene expression (41). There is a large body of evidence on the functional significance of both histone acetylation and DNA methylation levels and their correlation with gene expression as well as their importance in integrating environmental stimuli, such as diet, in the control of gene expression (30, 41). Obesity-associated changes in histone acetylation or DNA methylation levels on the order of 10–20% are sufficient to correlate with altered expression levels of genes involved in the regulation of lipid metabolism, suggesting that the regulation of transcription in metabolic pathways is highly sensitive to epigenetic effects (2, 5, 23, 29, 35).
While CPT1B plays an important role in human skeletal muscle lipid metabolism and has been shown to be differentially regulated with obesity (6), the transcriptional regulation of this gene in response to lipid exposure has not been extensively examined. The purpose of the present study was to determine whether the blunted response to lipid of the CPT1B gene in skeletal muscle observed with severe obesity is linked to epigenetic modifications (DNA methylation and histone acetylation) that impact transcriptional activation. To our knowledge this is the first study to examine the transcriptional regulation of CPT1B in response to a physiologically relevant lipid load, in terms of concentration and ratios of saturated to unsaturated fatty acids, in primary human skeletal muscle cell (HSkMC) cultures. Utilizing HSkMC, we were able to study the molecular adaptations to a lipid stimulus in an environment devoid of in vivo hormonal and neural stimuli and thus intrinsic to skeletal muscle itself.
MATERIALS AND METHODS
Study design.
Briefly, the design of the study was to compare the mRNA response of the rate-limiting enzyme CPT1B to lipid exposure in lean vs. severely obese subjects. Skeletal muscle was obtained from the vastus lateralis and used to derive primary HSkMC cultures. After differentiation into myotubes, HSkMC were incubated in a physiologically relevant lipid mixture (250 μM oleate-palmitate) for 48 h, and mRNA content, DNA methylation, histone acetylation, and transcription factor binding to the CPT1B promoter region were determined.
Materials.
All chemical reagents and substrates were purchased from Sigma (St. Louis, MO) unless otherwise stated. Dulbecco's phosphate-buffered saline (DPBS), fetal bovine serum, heat-inactivated horse serum, gentamicin, 0.05% trypsin-EDTA, and Hanks's balanced salt solution were obtained from Invitrogen. Growth media and differentiation media consisted of low glucose (5 mM) Dulbecco's modified Eagles medium from Invitrogen. Type I collagen-coated tissue culture plates were obtained from Becton-Dickinson (Franklin Lakes, NJ). PCR reagents were purchased from Applied Biosystems (Foster City, CA).
Human subjects.
Muscle biopsies were obtained using the percutaneous needle biopsy technique (17) under local anesthesia (0.01% Lidocaine) from the vastus lateralis of 9 lean (BMI 22.8 ± 0.7 kg/m2; age 23.4 ± 1.5 yr) and 9 severely obese (BMI 41.3 ± 1.5 kg/m2; age 29.9 ± 2.9 yr) Caucasian women. The inclusion of exclusively female subjects in this study was due to the fact that >80% of the participant pool (severely obese patients presenting for gastric bypass surgery) were female. Characteristics are presented in Table 1. Participants were relatively young, free from disease, nonsmoking, and not taking medications known to alter metabolism. All procedures were approved by the East Carolina University Institutional Review Board.
Table 1.
Participant characteristics
| Lean (n = 9) | Obese (n = 9) | |
|---|---|---|
| Age, yr | 23.4 ± 1.5 | 29.9 ± 2.9 |
| Stature, cm | 164.7 ± 1.8 | 165.5 ± 2.2 |
| Mass, kg | 62.6 ± 1.3 | 113.7 ± 6.3* |
| BMI, kg/m2 | 22.8 ± 0.7 | 41.3 ± 1.5* |
| Plasma cholesterol, mg/dl | 179 ± 8.2 | 169 ± 11.0 |
| Plasma triglycerides, mg/dl | 102 ± 7.4 | 105 ± 15.6 |
| HDL, mg/dl | 56 ± 4.0 | 40 ± 3.8* |
| Fasting glucose, mmol/l | 4.6 ± 0.1 | 4.9 ± 0.4 |
| Fasting insulin, μU/l | 4.3 ± 1.2 | 18.3 ± 5.8* |
| HOMA-IR | 0.9 ± 0.2 | 3.2 ± 1.0* |
Data are means ± SE
Significant difference (P < 0.05) between lean and obese groups.
Primary HSkMC.
Satellite cells were isolated from ∼50–100 mg of fresh muscle tissue and cultured into myoblasts as previously described (4). For experiments, cells were subcultured into T-150 flasks and 10-cm dishes. Upon reaching ∼80–90% confluence, differentiation was induced by switching the growth medium to low-serum differentiation medium containing 2% heat-inactivated horse serum, 0.05 mg/ml fetuin, and 5 μg/ml gentamicin. On day 5 of differentiation, myotubes were given fresh differentiation medium supplemented with 0.1% bovine serum albumin (BSA) + 1 mM carnitine (CONTROL) or 250 μM oleate-palmitate (1:1 ratio) bound to 0.1% BSA + 1 mM carnitine (LIPID) for a total incubation period of 48 h. Myotubes were harvested on day 7 similarly to previous work (33).
RNA isolation and mRNA quantification.
Total RNA was isolated using the RNeasy Mini Kit (Qiagen, Valencia, CA) with on-column DNase digestion using the RNase-Free DNase Set (Qiagen) to remove residual DNA. RNA was quantified using the NanoDrop 1000 Spectrophotometer version 3.7.1 from Thermoscientific (Wilmington, DE) and concentration was determined by measuring the absorbance at 260 nm. RNA (2 μg) was reverse-transcribed into cDNA using the High Capacity cDNA Reverse Transcription Kit from Applied Biosystems (Foster City, CA). PCR was performed in triplicate using the Applied Biosystems ABI 7900HT sequence detection instrument and software with Taqman Universal PCR Master Mix and TaqMan human CPT1B gene expression assay (cat. no. 4331182; Life Technologies, Grand Island, NY) in accordance with the manufacturer's instructions. This assay detects CPT1B mRNA transcript variants 1 and 3. Using standard techniques, reactions were run with the following thermal cycling conditions: 50°C for 2 min, 95°C for 10 min, and 40 cycles of 95°C for 15 s, followed by 60°C for 1 min. mRNA content was measured using the comparative CT method with a multiplexed endogenous control (18S RNA) and converted to a linear function by using a base 2 antilog transformation.
DNA isolation.
Cells were washed with DPBS and trypsinized with trypsin-EDTA (0.05% trypsin and 0.25% EDTA). Total DNA (mitochondrial and nuclear) was extracted from cells using a QIAamp DNA minikit (Qiagen), and total DNA was quantified using the NanoDrop 1000 Spectrophotometer v. 3.7.1 from Thermoscientific (Wilmington, DE).
Bisulfite conversion and DNA methylation profiling.
The methylation levels at CpG sites within and near the CPT1B gene was derived from a previously published whole genome methylation analysis (26). Briefly, 500 ng of DNA was used to perform bisulfite conversion using the EZ DNA Methylation Kit (Zymo Research, Orange, CA), following the manufacturer's protocol, with the alternative incubation conditions recommended when using the Illumina Infunium Methylation Assay. Genome-wide DNA methylation analysis was conducted on bisulfite-treated DNA samples using the Illumina Infinium HumanMethylation 450K BeadChip, which allows the quantitative monitoring of 485,764 cytosine positions (36). Twelve micriliters of each bisulfite-converted sample was amplified and fragmented, following the manufacturer's protocol, hybridized to arrays in a balanced design, and scanned on an Illumina iScan System. Data were analyzed using Illumina's Genome Studio software.
Chromatin immunoprecipitation assay.
Cellular chromatin was cross-linked by adding 1% formaldehyde. The cross-linking reaction was stopped by adding 0.125 M glycine, and cells were then scraped from the cell culture dishes, washed with PBS, centrifuged, and resuspended in lysis buffer [5 mM PIPES, pH 8.0, 85 mM KCl, 0.4% NP40, Complete Mini EDTA-free protease inhibitor cocktail tablet (Roche, Branchburg, NJ)]. Pelleted nuclei were resuspended in a sonication solution [50 mM Tris·HCl, pH 8.1, 1% SDS, 10 mM EDTA, Complete Mini protease inhibitor cocktail tablet (Roche)] and sheared by sonication to an average size of 1 kb. The sonicated chromatin was centrifuged and resuspended in IP buffer (16.7 mM Tris·HCl pH 7.9, 167 mM NaCl, 0.01% SDS, 1.1% Triton X, 1.2 mM EDTA, and Roche's Complete Mini protease inhibitor cocktail tablet. An aliquot of each sample was removed as an input control and used in PCR analysis. The soluble chromatin was incubated overnight at 4°C in a rotating shaker with the following antibodies: 1) anti-PPARα monoclonal (ab2779; Abcam, Cambridge, MA), 2) anti-PPARδ polyclonal (ab125290, Abcam), 3) anti-HNF4α monoclonal (ab41898, Abcam), 4) anti-acetyl-histone H3 polyclonal (no. 06-599; Millipore, Billerica, MA), and anti-acetyl-histone H4 polyclonal (no. 06-866, Millipore), or 5) anti-USF-1 (upstream stimulating factor 1) polyclonal and anti-USF-2 (nos. sc-229 and sc-862; Santa Cruz Biotechnology, Santa Cruz, CA). Normal Rabbit IgG polyclonal antibody (no. 2729, Cell Signaling) was used as control for the chromatin immunoprecipitation (ChIP) assays. Immune complexes were isolated by incubation with 60 μl of ChIP-grade protein G agarose beads (Cell Signaling) for 1 h at 4°C. The complexes were serially washed in 1 ml of low-salt buffer (0.1% SDS, 1% Triton X-100, 0.2 M EDTA, 20 mM Tris·HCl, pH 8.1, 20% glycerol, 0.5 mM DTT, 100 mM NaCl; twice), 1 ml of the same buffer with high salt (500 mM NaCl; twice), 1 ml of LiCl buffer (250 mM LiCl, 1% NP-40, 100 mM NaCl, 1 mM EDTA, 10 mM Tris·HCl, pH 8.0; twice), and four times with TE (10 mM Tris·HCl, pH 7.5, and 1 mM EDTA). The complexes were eluted with two 250-μl aliquots of elution buffer (1% SDS and 0.1 M NaHCO3) at room temperature for 15 min. The cross-linking was reversed by adding 200 mM NaCl, incubating at 56°C overnight, and subsequently being digested with 4 μl of RNase A (100 mg/ml; Qiagen, Germantown, MD) and 2 μl of proteinase K (10 mg/ml) at 45°C for 1 h. After reversal of the cross-linking, DNA was isolated using the QIAquick PCR Purification Kit (Qiagen) according to the manufacturer's instructions. The input and bound DNA fractions were subjected to PCR with specified primer pairs. The following primer set was used to assess HNF4α binding and H3/H4 lysine acetylation in the CPT1B promoter region: sense 5′-GGAACCTGACACCTACTCCC-3′ and antisense 5′-ACATCGGTGACCTTTTCCCT-3′. PPARα and PPARδ binding to the CPT1B promoter region was assessed using the EpiTect ChIP qPCR primer assay GPH1022780(−)01A (Qiagen). The primers used to detect USF-1/2 binding to the CPT1B promoter were: sense 5′-ccccgtgctgtgtatgtaac-3′ and antisense 5′-gtgtgtactgctcggtttgg-3′. Negative control primers from a functionally inert intergenic region of the growth hormone locus (∼7 kb upstream of the hGH-N gene) were sense 5′-TAAGACCCTGAACCGAAGGA-3′ and antisense 5′-TCCCCCTTCAAAACACAAAC-3′.
Sequence analysis.
The human CPT1B gene 1,000-bp 5′-flanking region was screened for consensus transcription factor binding sites using MATCH public version 1.0, a weight matrix-based program for predicting transcription factor binding sites based on TRANSFAC (44).
Electrophoretic mobility shift assay.
Electrophoretic mobility shift assays (EMSA), including duplex radiolabeled oligonucleotide probe and C2C12 cell nuclear extract preparation, were performed as previously described in detail (22, 39, 40). Sequences of synthetic duplex oligonucleotide probes used in EMSA experiments were as follows (sense strand shown): USF positive control 5′-CACCCGGTCACGTGGCCTACACC-3′, USF negative control, 5′-CACCCGGTCAATTGGCCTACACC-3′; hCPT1B −539 5′-GGCCAGAGCCCCGTGCTGTGTATG-3′, hCPT1B −174, 5′-CACCATCCTCACGAGACTCTGGGG-3′. Positive and negative control USF binding site sequences have been published previously (21), and corresponding oligonucleotides are commercially available (Santa Cruz Biotechnology, Dallas, TX; nos. sc-2557 and sc-2557). In vitro CpG methylation of EMSA probes was performed using CpG methyltransferase (M.SssI; New England BioLabs, Ipswich, MA, no. M0226S) according to the manufacturer's instructions. The methytransferase was omitted for mock-methylated probes. Antibodies for USF-1 and USF-2 used in supershift reactions were purchased from Santa Cruz Biotechnology (nos. sc-229 and sc-862). These antibodies were also used for the Western blots for USF-1 and USF-2, which were performed according to the manufacturer's recommended protocol.
Statistical analysis.
Statistical analyses were performed using PASW Statistics 19 Software (SPSS, Chicago, IL) on raw or log-transformed data. Comparisons between HSkMC from lean and obese donors were performed using independent samples t-tests. Repeated-measures analysis of variance was used to compare the data, with an emphasis on exposing body mass (lean vs. obese) × lipid exposure interactions, indicating that HSkMC from lean and obese responded differently to the lipid treatment. Post hoc analyses were performed with contrast-contrast comparisons. All data met assumptions of sphericity and homogeneity of variance. Data are presented as means ± SE.
RESULTS
Participant characteristics.
Participant characteristics are presented in Table 1. By design, the obese subjects were heavier and approximated a BMI classified as Class III (severe) obesity (≥40 kg/m2; P < 0.05). Fasting blood glucose, cholesterol, and triglyceride values did not differ between groups. However, fasting HDL values were significantly lower, and insulin and homeostatic model assessment values were significantly higher in the obese subjects (P < 0.05). Both groups consisted of relatively young individuals, and were age and race matched.
Lipid exposure differentially affects CPT1B gene expression and DNA methylation in HSkMC from lean and obese subjects.
Previous studies in human skeletal muscle biopsies had shown that the increase in CPT1B expression in response to a high-fat diet was significantly blunted in obese individuals (6). To first test whether the current approach with HSkMC could recapitulate this effect, cultures prepared from lean and obese subjects were exposed to a physiological lipid mixture and concentration and CPT1B mRNA levels determined. Under the control condition (pre-lipid exposure), there were no differences in CPT1B mRNA between the lean and obese groups (P = 0.232). In response to the 48-h 1:1 oleate-palmitate lipid treatment, there was a significant increase in CPT1B mRNA content in HSkMC from both lean and obese subjects (P < 0.05). However, the CPT1B mRNA content in HSkMC from obese subjects in the lipid-treated condition was significantly lower compared with lean (37% of lean, P < 0.05), indicating that the blunted CPT1B response to lipid exposure observed in skeletal muscle biopsies was recapitulated in the HSkMC model (Fig. 1).
Fig. 1.
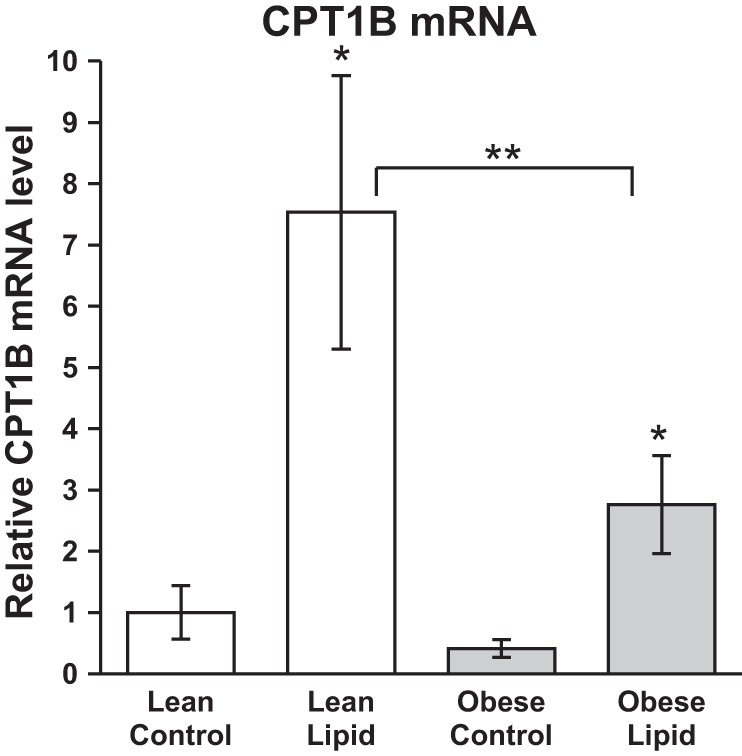
Effect of lipid exposure on carnitine palmitoyltransferase 1B (CPT1B) mRNA content in cultured myotubes (HSkMC) from lean (white bars) and severely obese (gray bars) donors. Data are expressed as means ± SE, normalized to the lean control samples. *Significant difference (P < 0.05) between the control and lipid-treated condition, **significant difference (P < 0.05) between lean and obese.
To determine if the reduced CPT1B activation by lipid in obese subjects could be due to epigenetic effects, DNA methylation was determined at 18 cytosines within the CPT1B gene and 5′-flanking region (Fig. 2A), 16 of which are located within 1,000 bp of the transcription start site (TSS). In general, in all cases the pattern of methylation showed low levels of methylation (5–20%) in the 5′-flanking region of CPT1B (Fig. 2, CpG sites 2–10), moderate levels (20–40%) through the 5′ end of the body of the gene (CpG sites 11–16), and high levels (70–100%) at the boundaries of this ∼5-kb domain (CpG sites 1 and 17–18). There were only a few significant differences in methylation between the lean and obese individuals in the basal and lipid-treated condition, but overall the patterns were similar (Fig. 2, B and C). However, distinctions emerged when the relative levels of methylation in the lean and obese cells in the control and lipid-treated condition were compared (Fig. 3A). Overall, this trend shows that in the immediate 5′ flank (CpG sites 7–10) and 5′ body of the CPT1B gene (CpG sites 11–16), methylation was higher in the obese cells, particularly in the lipid-treated condition (Fig. 3A). This is consistent with the reduced expression of CPT1B in obese cells relative to lean being apparent only in the lipid-treated condition (Fig. 1). However, two notable exceptions are CpG sites 2 and 6, where the methylation frequency ratio trend was the opposite, being significantly greater in the obese cells in the control condition but greater in the lean cells in the lipid-treated condition (Fig. 2A).
Fig. 2.

CPT1B gene methylation. A: visualization of the 18 measured CpG sites within the CPT1B gene. Absolute CPT1B CpG site methylation frequencies in lean and obese human skeletal muscle cell cultures (HSkMC) in control (B) and lipid-treated (C) conditions. TSS, transcription start site, indicated by arrow. *P < 0.05, lean vs. obese; #P < 0.10, lean vs. obese.
Fig. 3.
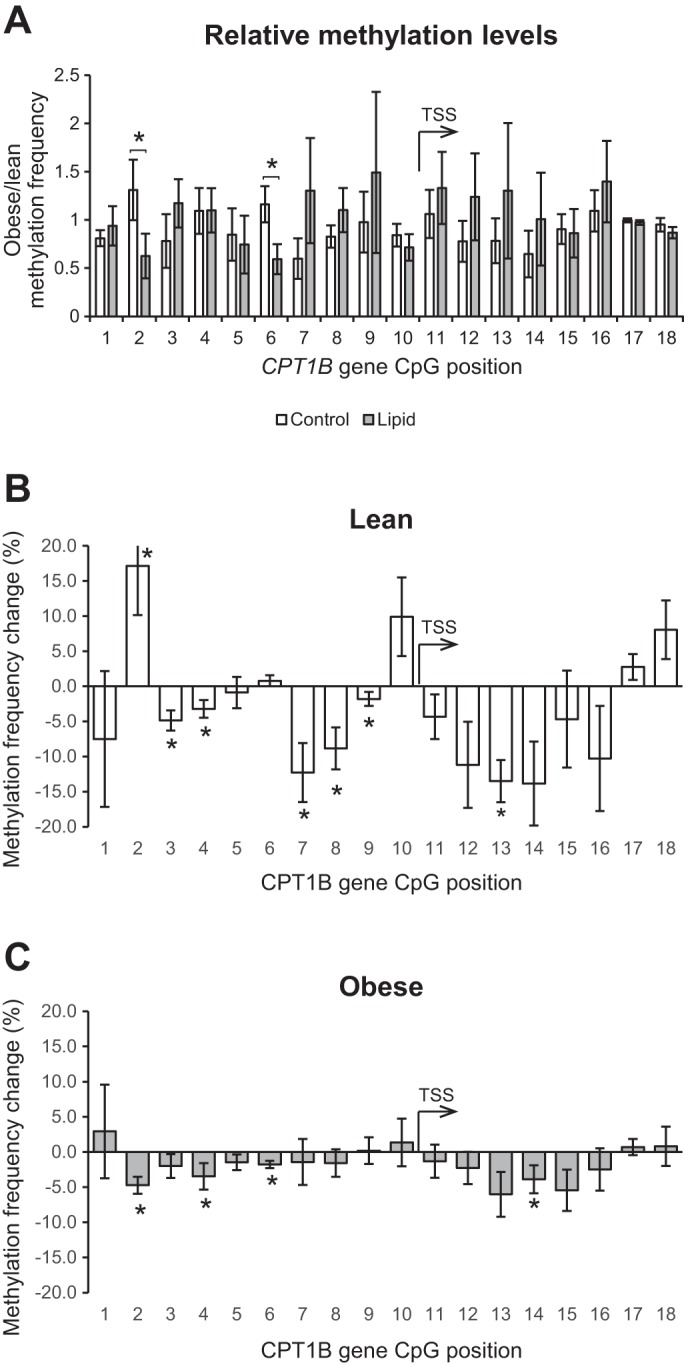
Lipid-mediated changes in methylation. A: comparison of relative methylation levels (obese/lean) in control and lipid-treated conditions. DNA methylation changes in response to lipid exposure (methylation value in the lipid-treated condition minus the baseline methylation value) at each of the 18 measured cytosines among the lean (B) and severely obese (C) individuals. *Significant difference (P < 0.05) between control and lipid-treated conditions.
When viewed as the magnitude of lipid-induced change in methylation, the results showed differential changes in methylation levels at individual CpG sites in both the lean and obese cells; however, further distinctions between the lean and obese cells are apparent (Fig. 3, B and C). In response to the lipid exposure, there were significant (P < 0.05) lipid treatment effects for cytosines at positions 3, 4, 7, 8, 12, 13, and 14 (−273, −269, −126, −108, +246, +248, and +254 bp relative to the TSS) where methylation was lower in the lipid-treated state relative to control. In the lean individuals (Fig. 3B), lipid exposure resulted in a decrease in the methylation of six cytosines at positions 3, 4, 7, 8, 9, and 13 (−273, −269, −126, −108, −57, and +248 bp relative to the TSS) and a decrease in methylation of the cytosine at position 14 (+254 bp relative to the TSS) that approached significance (P = 0.10). In addition, there was a significant increase in methylation at position 2 (−539 bp from the TSS) and a trend for an increase in methylation at cytosines 17 and 18 (+1,521 and +4,346 bp from the TSS, P = 0.10 and P = 0.06) in response to lipid in the lean women. In the obese women (Fig. 3C), lipid exposure resulted in a significant decrease in the methylation of cytosines at positions 2, 4, 6, and 14 (−539, −269, −174, and +254 bp relative to the TSS) and a trend for a decrease in the cytosine at position 13 (+248 bp relative to the TSS, P = 0.06). There were no significant increases in methylation at any of the cytosines measured among the obese subjects in response to lipid.
In addition to these differences between the lean and obese HSkMC cells, visual examination of the methylation signatures (Fig. 3, B and C) indicates that the disparity in the lipid response is largely due to a reduced magnitude of the change in methylation pattern in response to lipid with obesity. More specifically, the change in methylation of the cytosine at position 7 was significantly (P ≤ 0.05) different between groups (lean, −12.3 ± 4.6%; obese, −1.5 ± 1.9%), while the change in methylation of the cytosine at position 8 approached significance (lean, −8.8 ± 3.5%, obese, −1.6 ± 1.0%, P = 0.07). Additionally, there were significant interactions for cytosines at CpG positions 2 and 6 (−539 and −174 bp relative to the TSS). Notably, the lipid-induced change in methylation of the cytosine at position 6 was positively related to the lipid-induced relative change in CPT1B gene expression (r = 0.71, P = 0.001; Fig. 4). Similarly, the methylation level of cytosine 2 in the lipid-treated condition was positively related with the mRNA content of CPT1B in the lipid-treated condition (r = 0.52, P = 0.03). As noted above, CpG sites 2 and 6 displayed a unique and significant pattern of differential methylation in the lean and obese cells in the control and lipid-treated states (Fig. 3A).
Fig. 4.
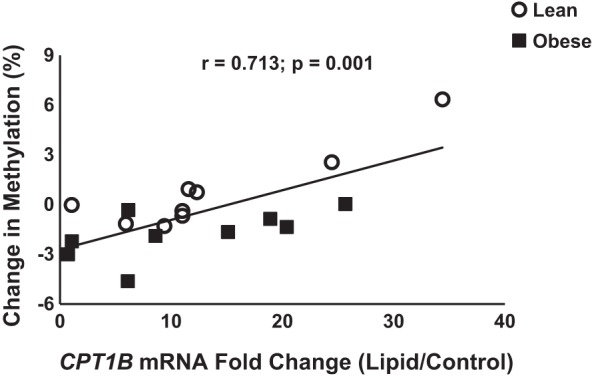
Association of CPT1B methylation and CPT1B mRNA content. Change in methylation in response to lipid exposure (methylation value in the lipid-treated condition minus the control methylation value) of the cytosine at position 6 was positively related to the relative change in CPT1B mRNA content (lipid-treated divided by baseline).
Lipid exposure increases histone acetylation and transcription factor binding.
In searching for transcriptional regulators of CPT1B gene expression in response to lipid exposure, we focused on promoter-associated histone acetylation and transcription factor binding. Overall, in response to lipid there were significant (P < 0.05) increases in H3/H4 lysine acetylation (Fig. 5A) as well as increased HNF4α (Fig. 5B) and PPARδ (Fig. 5D) binding to the 5′-flanking region of CPT1B as assessed by ChIP assay. There was a significant correlation between the relative changes in histone acetylation and the relative changes in PPARδ (Fig. 6C) and HNF4α (Fig. 6A) binding to the CPT1B promoter region. Lipid exposure failed to significantly increase PPARα transcription factor binding to the CPT1B promoter region (Fig. 5C) and there was no relationship between the relative change in histone acetylation and PPARα (Fig. 6B) binding to the CPT1B promoter region. There were no significant differences between lean and obese in terms of CPT1B promoter associated histone acetylation and transcription factor binding at baseline or in response to lipid.
Fig. 5.

Effect of lipid exposure (48-h 250 μM oleate-palmitate treatment) on CPT1B promoter-associated changes in H3/H4 histone acetylation (A) and hepatic nuclear factor 4α (HNF4α; B), peroxisome proliferator-activated receptor-α (PPARα; C), and PPARδ (D) transcription factor binding in cultured myotubes (HSkMC) from lean (white bars) and severely obese (gray bars) donors. Data are expressed as means ± SE. **Significant difference (P < 0.05) between control and lipid-treated cells.
Fig. 6.
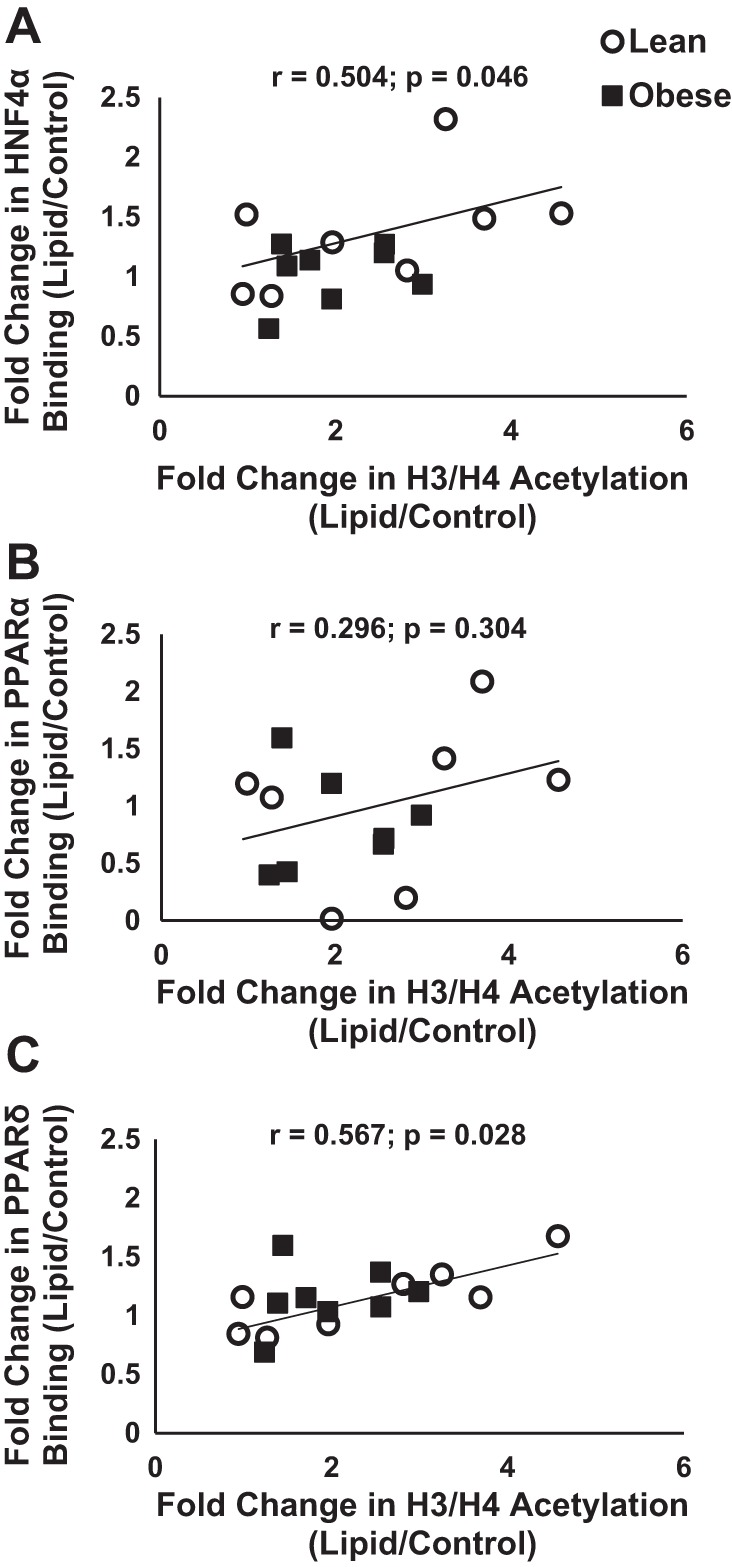
Association of CPT1B promoter region H3/H4 acetylation and transcription factor binding to the CPT1B promoter region. The relative change (lipid-treated divided by control) in HNF4α (A), PPARα (B), and PPARδ (C) transcription factor binding to the CPT1B promoter region in response to lipid exposure was related to the relative change (lipid-treated divided by control) in H3/H4 histone acetylation of the CPT1B promoter region.
Differentially methylated CpGs in the CPT1B 5′-flanking region that correlated with CPT1B expression are within two USF binding sites.
The analysis of H3/H4 acetylation, HNF4α occupancy, and PPARγ occupancy in the CPT1B promoter by ChIP showed a correlation between increased histone acetylation and HNF4α/PPARγ occupancy in response to lipid, but no difference in this response between the lean and obese subjects, suggesting that a regional difference in chromatin structure influenced by differential methylation was not likely involved. Indeed, the overall methylation patterns were similar between lean and obese subjects (Fig. 2). However, a more localized, site-specific effect of methylation was an alternative possibility. The levels of methylation at CpG positions 2 and 6 (−539 bp and −174 bp relative to the TSS, respectively) within the CPT1B 5′-flanking region were positively correlated with CPT1B mRNA level. In addition, methylation levels at these sites showed a differential response to lipid in lean and obese subjects, where methylation increased (site 2) or remained unchanged (site 6) in cells from lean subjects but decreased in cells from obese subjects (Figs. 2–4). One possible mechanism consistent with these observation is that methylation of these specific cytosines was affecting the binding of transcription factors to cognate elements encompassing these cytosines either by blocking the binding of a repressor and/or promoting the binding of a methylation-dependent DNA-binding protein, thereby correlating with increased CPT1B transcription.
To begin testing this possibility, the human CPT1B 5′-flanking sequence was analyzed for potential transcription factor consensus binding sites. As shown in Fig. 7, several potential elements were identified, including the known binding sites for HNF4α and PPARα. Of potential significance, the elements identified also included potential binding sites for the ubiquitous transcription factor USF, which encompassed each of the two differentially methylated cytosines that correlated with CPT1B mRNA levels (CpG positions 2 and 6). USF exists in two isoforms (USF-1 and USF-2) that bind as homo- or heterodimers to canonical E-box elements (37). To test whether these sequences could bind USF-1 and/or USF-2, an EMSA was performed with synthetic oligonucleotide probes encompassing the putative USF elements and nuclear extract prepared from the mouse myoblast cell line C2C12. As shown in Fig. 8, a protein-DNA complex (indicated by an arrow) that could be supershifted with both USF-1 and USF-2 antibodies was readily observed with a control USF binding site probe that was not seen with a mutant binding site control probe. Additional complexes were also observed. Both the −539 USF site probe and the −174 USF site probe displayed the same complex as the positive control probe that could likewise be abrogated or supershifted with USF-1 and USF-2 antibodies, although the binding to the −174 site probe was more robust. These findings indicate that USF-1 and USF-2 can bind to these putative elements in the CPT1B 5′-flanking region in vitro and suggest that the differential methylation of these cytosines may alter CPT1B transcription by directly affecting USF binding.
Fig. 7.

Identification of putative upstream stimulating factor 1 (USF) binding sites at differentially methylated CpG sites that correlated with CPT1B mRNA levels in HSkMC from lean and obese women. Sequence of CPT1B 5′-flanking region and partial transcribed sequence are shown. Transcription factor binding site consensus sequences are underlined and identified above the sequence. Differentially methylated cytosines are indicated in boldface and numbered as indicated in the text. Probe sequences used in EMSA are boxed.
Fig. 8.
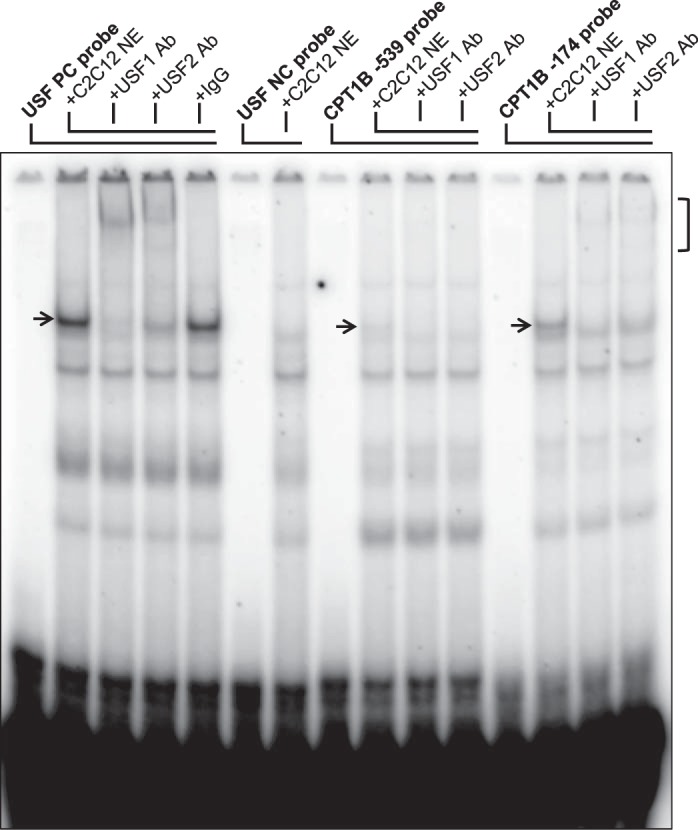
Putative USF elements in the CPT1B 5′-flanking region bind USF-1 and USF-2 in vitro. Autoradiogram of EMSA with control and CPT1B USF element probes and C2C12 nuclear extract. Reaction components are indicated at the top. Supershift reactions with USF-1 and USF-2 antibodies are also shown. USF complexes are indicated by an arrow. Ternary USF antibody-supershifted complexes are indicated by a bracket.
Methylation of USF elements in the CPT1B promoter blocks USF binding in vitro.
To address the possibility that cytosine methylation can affect USF binding, we performed an EMSA with methyl-CpG-containing probes or mock-methylated control probes. As shown in Fig. 9f, the USF complex was observed with the unmethylated −539 and −174 control probes (thick arrow) but not with the methylated probes. One of the complexes not attributed to USF also appeared to be inhibited by methylation of the −539 site probe (thin arrow). Interestingly, a unique methyl-CpG-dependent complex was also observed with the methylated −174 site probe (thin arrow). Taken together, the results of the EMSA experiments verify the ability of USF-1 and USF-2 to bind to the putative CPT1B promoter USF elements and indicate that the ability of USF to bind to these elements is directly blocked by CpG methylation.
Fig. 9.
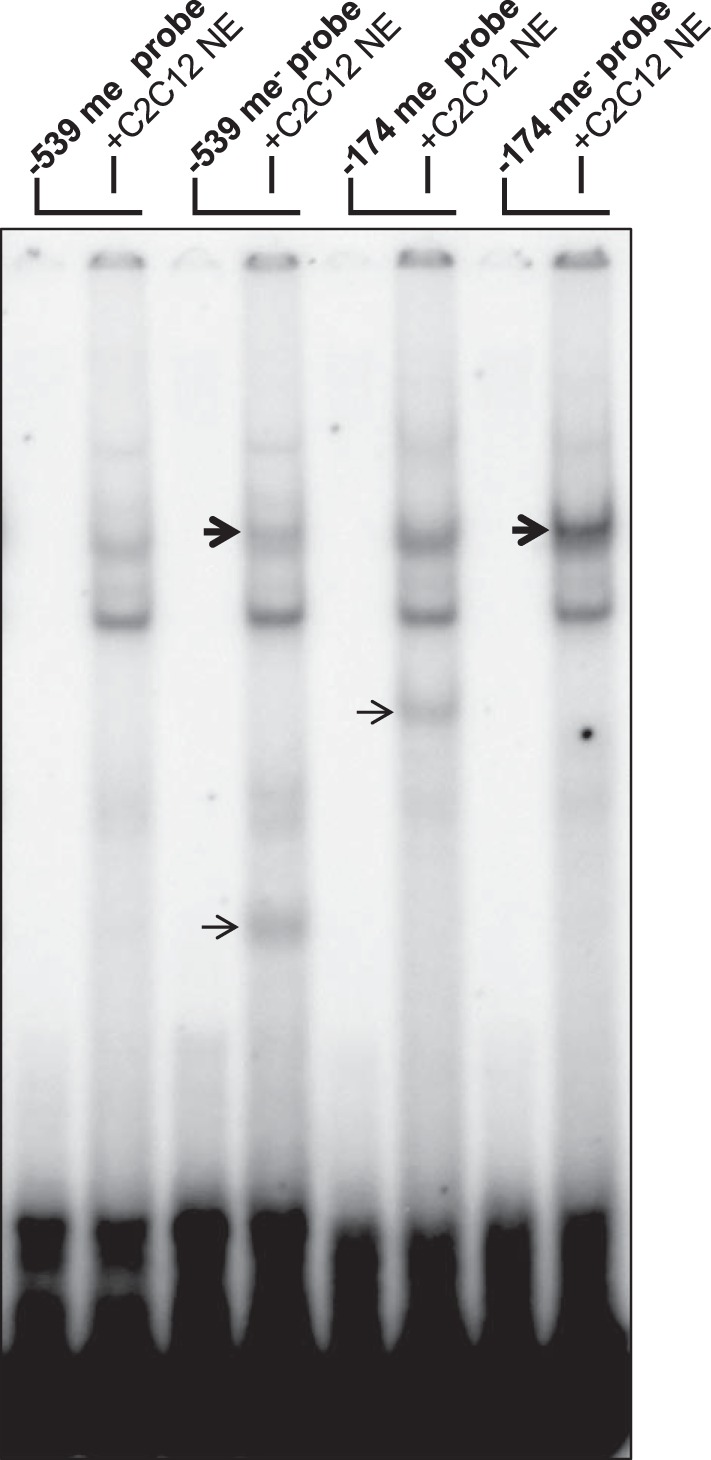
CpG methylation inhibits USF binding to two CPT1B USF elements containing differentially methylated CpGs. Autoradiogram of EMSA with in vitro methylated and mock-methylated probe sequences. USF-1/2 complexes are indicated by thick arrows. Additional methylation-sensitive complexes are indicated by thin arrows.
Distinct levels of USF-1/2 occupancy at the CPT1B promoter at baseline and in response to lipid exposure in lean and obese HSkMC.
The results so far support a model in which the differential methylation response to lipid of a CpG within a putative USF binding site in the CPT1B 5′-flanking region affects the ability of USF to bind as a transcriptional repressor, resulting in greater CPT1B expression in lean subjects. However, this model is inferred from the effect of methylation on in vitro USF binding to the CPT1B USF elements. To directly test whether USF-1/2 binds to the CPT1B 5′-flanking promoter region in skeletal muscle cells in vivo and whether lipid exposure affects USF occupancy, ChIP assays were performed with HSkMC from lean and obese subjects (Table 2) at baseline and after lipid exposure, using a mixture of USF-1 and USF-2 antibodies. Both lean and obese cells showed significant USF occupancy, confirming the results of the sequence analysis and in vitro EMSA that predicted USF binding. Before lipid treatment, the obese cells showed significantly greater USF-1 occupancy. If USF was functioning as a repressor in the CPT1B promoter, this might account for the trend toward reduced baseline CPT1B expression in the obese subjects, albeit not statistically significantly (Fig. 1). Interestingly, upon lipid treatment, there was a greater disparity in the levels of USF occupancy between the lean and obese cells. Whereas the level of USF binding decreased significantly in the lean cells in response to lipid, USF binding increased slightly in the obese cells, resulting in an eightfold greater level of USF occupancy in the obese cells in the lipid-treated condition (Fig. 10B). This augmented difference in USF binding also corresponded to the greater difference in CPT1B expression between the lean and obese cells in the lipid-treated condition, consistent with the putative role of USF as a repressor of CPT1B expression. Significantly, the disparities in USF occupancy were not due to varying levels of USF-1 or USF-2 protein, which were similar among the control and lipid-treated lean and obese HSkMC pools (Fig. 10A). Taken together, these findings are consistent with a model in which methylation of CpG sites 2 and 6 abrogates USF binding, corresponding with increased CPT1B transcription.
Table 2.
USF ChIP participant characteristics
| Lean (n = 4) | Obese (n = 4) | |
|---|---|---|
| Age, yr | 27.25 ± 2.50 | 33.25 ± 4.03 |
| BMI, kg/m2 | 21.35 ± 1.10 | 46.05 ± 2.85* |
| Fasting glucose, mmol/l | 4.82 ± 0.30 | 4.55 ± 0.25 |
| Fasting insulin, μU/l | 6.20 ± 1.34 | 14.13 ± 2.27* |
| HOMA-IR | 1.34 ± 0.30 | 2.92 ± 0.56* |
Data are means ± SE USF, upstream stimulating factor
Significant difference between lean and obese groups (P < 0.05).
Fig. 10.
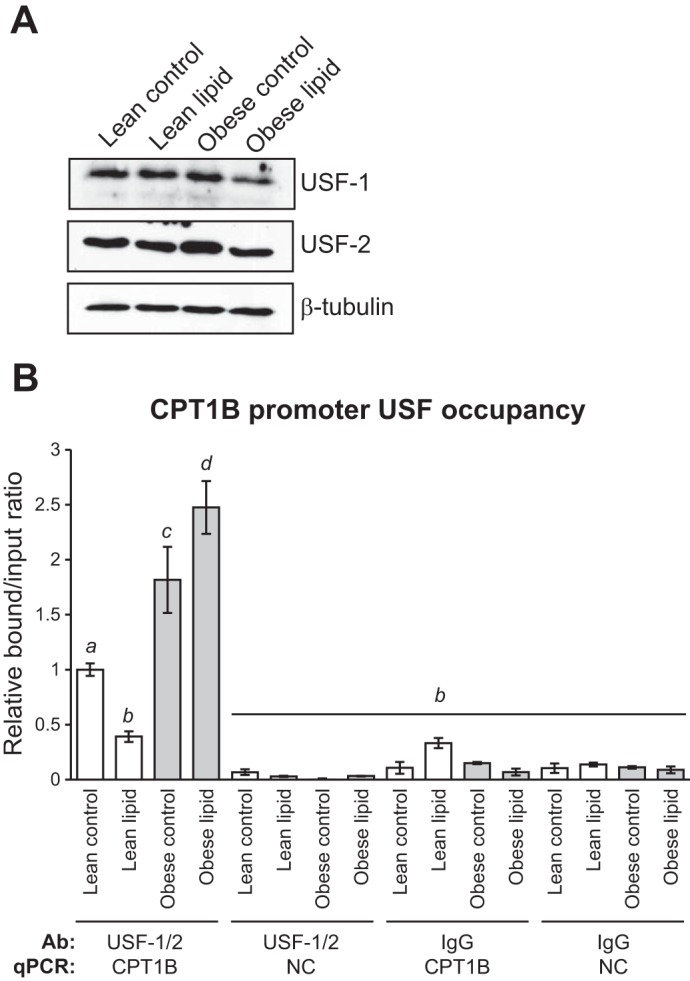
Differential USF occupancy in the CPT1B promoter in HSkMC from lean and obese women. A: Western blot for USF-1, USF-2, and β-tubulin (loading control) of lysates from HSkMC pools. B: ChIP assay for USF-1/2 occupancy in the CPT1B promoter. Open bars, lean subjects; gray bars, obese subjects. Data are expressed as means ± SE obtained from triplicate cultures of HSkMC prepared from cells pooled from four lean and four obese subjects (Table 2), normalized to the lean control group. IgG, negative control ChIP. NC, negative control qPCR. Means not connected by a common letter are significantly different as determined by ANOVA and post hoc Tukey HSD multiple comparison test (P < 0.05).
DISCUSSION
In lean individuals, whole body lipid oxidation increases in response to a high-fat diet (18). However, with obesity there is impairment in the ability to adjust to lipid exposure in a similar manner (3, 10). The goal of the present study was to determine whether the expression of a rate-limiting enzyme in skeletal muscle mitochondrial FAO, CPT1B, differed in a manner indicative of this lack of metabolic flexibility with obesity and whether the transcriptional regulation of CPT1B could be explained by epigenetic modifications. The main findings of the current study were 1) that the expression of CPT1B was blunted in the severely obese women compared with their lean counterparts in response to lipid and 2) that changes in CpG methylation, histone acetylation, and transcription factor binding accompanied this response suggesting that CPT1B is, at least in part, regulated by epigenetic modifications in human skeletal muscle.
CPT1 exists as three isoforms encoded by separate genes: liver type (encoded by CPT1A), muscle type (encoded by CPT1B), and brain type (encoded by CPT1C). The CPT1B gene consists of ∼11 kb and contains 19 introns and 19 exons, the first of which is noncoding and alternatively transcribed into either 1) exon 1A (also called U), which is expressed ubiquitously, or 2) exon 1B (also called M), which is abundantly expressed in heart and skeletal muscle (42, 45). Long-chain fatty acids can regulate CPT1B gene expression (7, 45) via PPARα activation and subsequent binding to the peroxisome proliferator response element (PPRE) within the CPT1B promoter region (19, 45). Data from Muoio et al. indicate that PPARα and PPARδ play redundant roles in the activation of CPT1B gene expression in skeletal muscle (32), whereas other data suggest that CPT1B is preferentially regulated by PPARδ in this tissue (16). Our findings also suggest that PPARδ may play a more important role in the transcriptional activation of CPT1B than PPARα in response to lipid exposure, as we observed a significant increase in PPARδ binding to the CPT1B promoter region but failed to see an increase in PPARα binding (Fig. 5).
HNF4α is a nuclear transcription factor that regulates the expression of several genes involved with energy metabolism and other nuclear receptors including the PPARs, and mutations in the HNF4α gene have been associated with type 2 diabetes and hyperlipidemia (15). The proposed mechanisms by which HNF4α exerts transcriptional regulation include chromatin structure modulation via histone acetyltransferase recruitment as well as interactions with other transcription factors such as HNF1, HNF6, GATA4, GATA6, p21, PGC-1α and SREBP2 (11). It has been suggested that the transcriptional regulation of some genes involved with lipid metabolism (e.g., ACOT, ACOX, CD36, CPT, and ThB) relies on interactions between the PPARs and HNF4α (11). For example, Martinez-Jimenez et al. (27) reported that fasting-mediated transcriptional activation of CPT1 required the synergism of HNF4α and PPARα. Although our findings do not definitely show that the lipid-induced transcriptional regulation of CPT1B requires a HNF4α and PPARδ interaction, our data support a recently described model of CPT1B transcriptional regulation proposed by Chamouton and Latruffe (11), where HNF4α, bound to the PPRE, recruits a ligand-activated PPAR to the promoter in response to altered substrate availability, suggesting cross-talk between these two factors. Additionally, both HNF4α binding and PPARδ binding to the CPT1B promoter were positively correlated with increased histone acetylation (Fig. 6) in response to lipid, which is consistent with the concept that histone acetylation renders chromatin more accessible to transcriptional machinery in the promoter regions of genes, thereby regulating gene activation.
DNA methylation is considered a major regulator of transcriptional activity where increased DNA methylation inhibits promoter activity by directly impeding the binding of transcriptional factors to their target sites or by mediating the establishment of repressive chromatin structure through the recruitment of methyl-binding domain protein (MBD)-containing complexes, consequently reducing gene expression (30). In response to lipid, there was an increase in CPT1B mRNA content, which was accompanied by significant decreases in methylation among 7 of the 18 cytosines measured. Among the obese women, only two of the seven cytosines exhibited a lipid-induced decrease in methylation compared with five of seven among the lean women (Fig. 3). This suggests that the overall lipid-induced decrease in methylation was driven by the lean individuals, which is in agreement with CPT1B mRNA content being significantly higher in muscle cells derived from lean compared with obese subjects. In addition, the overall extent to which methylation changed in response to lipid exposure tended to be lower in the obese subjects (Fig. 3), which is in accord with individuals at a greater risk of developing metabolic disease tending to have a lower sensitivity to environmental challenges (e.g., high-fat feeding) and acutely regulated DNA methylation (8).
While fatty acids have been shown to increase the transcription of genes that play roles in the oxidation of lipids, glucose can induce the transcriptional response of glycolytic and lipogenic enzymes (20). One transcription factor that has been implicated in the carbohydrate-mediated regulation of glycolytic and lipogeneic genes is USF (14). USFs are members of the basic helix-loop-helix leucine zipper family of transcription factors, are ubiquitously expressed, and have been implicated in metabolic disease (1, 14, 20, 34). We identified potential USF binding sites within the CPT1B 5′-flanking region based on sequence analysis, which contained the CpG cytosines at positions 2 and 6 (−539 and −174 relative to the TSS, respectively). Interestingly, of the cytosine methylation measured in this analysis, these were the only sites that showed a significant (P < 0.05) interaction effect where methylation significantly decreased in the lipid-treated state in HSkMC from the obese but not the lean subjects. In fact, methylation of the cytosine at position 2 significantly increased among the lean women in response to lipid treatment (Fig. 3), which would suggest a reduction in transcription factor binding at this site, considering the possible steric blocking of DNA binding by methylation of the cognate sequence. Additionally, the relative change in methylation of the cytosine at position 6 was positively related to the relative change in CPT1B mRNA content in response to lipid (Fig. 4). We confirmed the ability of the putative USF elements encompassing these CpG sites to bind USF-1 and USF-2 by EMSA (Fig. 8), and we further demonstrated that methylation of these cytosines blocked USF binding (Fig. 9), consistent with the hypothesis that USF may be acting as a repressor for CPT1B in skeletal muscle and that CpG methylation of these elements has the potential to counter this activity as a means to modulate CPT1B levels. In further support of this model, obese cells showed a greater level of USF occupancy in the CPT1B promoter in vivo, particularly in the lipid-treated condition, with no parallel differences in USF-1/2 protein expression levels (Fig. 10).
USF has not been previously implicated in the regulation of CPT1B in human skeletal muscle in response to lipid treatment. However, data from Putt et al. (34) uncovered a potential role for USF in the transcriptional regulation of several metabolic genes in response to nutrient challenges, including a high-fat meal. Additionally, it has been suggested that USF may play a role in maintaining the chromatin structure environment at promoter sites and, similarly to the PPARs, may switch from activator to repressor depending on which signal transduction pathways are operating (14). In support of our model that USF functions as a repressor of CPT1B in skeletal muscle, others have reported that USF-2 can repress CPT1B expression in rat cardiac muscle in a manner that suggested that USF is part of a molecular switch that fine-tunes CPT1B levels in response to certain stimuli (31, 38). In light of these observations, the significant decrease in methylation at the USF binding sites at −539 and −174 in HSkMC from obese women in response to lipid treatment, and the contrasting increase in methylation at these sites in muscle cells derived from lean women (Fig. 2), supports the notion that USF binding could be acting as a repressor and a partial brake on the lipid-induced upregulation of CPT1B in skeletal muscle. This mechanism may in part explain the significantly reduced expression of CPT1B mRNA content in response to lipid treatment with obesity.
The correlation between USF binding site CpG methylation, USF occupancy, and the effects of lipids on CPT1B expression support a generally negative role of USF on CPT1B transcription. However, USF binding alone cannot account fully for the absolute level of CPT1B expression, which likely reflects the integrated effects of multiple transcriptional regulators acting on CPT1B, some of which have been identified (e.g., PPARα and HNF4α). For example, whereas the lipid-mediated increase in CPT1B expression in the lean HSkMC (Fig. 1) corresponded to reduced USF occupancy (Fig. 10B), the blunted increase in CPT1B expression upon lipid treatment of obese HSkMC corresponded to an increase in USF occupancy relative to the control condition. A possible reason for this disparity is that an activating transcription factor(s) competes for binding with USF in the CPT1B promoter, and this competition is more effective in lean cells due to increased methylation at the USF sites in the lipid-treated state or to differential expression of this putative factor(s) in lean and obese HSkMC. The notable methylation-dependent complex observed by EMSA when USF binding was blocked may represent such a factor. Also, the non-USF complex that migrates slightly faster than the USF complex increases in intensity as the USF complex is blocked by methylation, which may represent a competitive positive factor (Fig. 9). There are also additional CpG methylation sites that respond differentially to lipid exposure beyond those at the USF binding sites that may mediate differential binding of unidentified transcription factors in those regions and affect the correlation between USF occupancy and CPT1B expression. For example, CpG sites 7 and 8 showed a significant lipid-mediated reduction in methylation upon lipid exposure in lean but not obese HSkMC (Fig. 3, B and C). These sites may colocalize with binding sites for unidentified transcription factors that have greater access in lean cells in the presence of lipid, resulting in increased CPT1B gene activation. Alternatively, the effect of lipid exposure on methylation of these sites may affect local chromatin structure that could in turn govern transcription factor and RNA polymerase accessibility, as these sites lie between the two major transcription start sites for the CPT1B gene (Fig. 7). Ongoing studies will test these possibilities to more fully resolve the regulatory mechanism of the CPT1B gene.
In summary, by utilizing primary human skeletal muscle cell cultures, we were able to study the transcriptional regulation of CPT1B in response to a lipid stimulus in the skeletal muscle of lean and severely obese humans. Our findings indicate a dampened CPT1B response to lipid, which likely contributes to the metabolic inflexibility evident in skeletal muscle with severe obesity, since CPT1B action is the rate-limiting entry point of fatty acids into the mitochondrial matrix for oxidation. A novel finding was that epigenetic modifications, including histone acetylation and DNA methylation, both of which were associated with transcription factor binding, play an important role in the transcriptional upregulation of CPT1B in response to a physiologically relevant lipid mixture (43) in humans, and it is likely that differential DNA methylation partially explains the depressed expression of CPT1B with obesity.
GRANTS
Funding for this work was provided by a grant from the National Institute of Diabetes and Digestive and Kidney Diseases (DK-056112, J. A. Houmard).
DISCLOSURES
No conflicts of interest, financial or otherwise, are declared by the author(s).
AUTHOR CONTRIBUTIONS
Author contributions: J.M.M., J.J.B., C.A.W., S.P., M.J.H., J.A.H., and B.M.S. conception and design of research; J.M.M., S.P., M.J.H., T.M.W., and B.M.S. performed experiments; J.M.M., M.J.H., T.M.W., and B.M.S. analyzed data; J.M.M., J.J.B., C.A.W., M.J.H., J.A.H., and B.M.S. interpreted results of experiments; J.M.M. and B.M.S. prepared figures; J.M.M., J.A.H., and B.M.S. drafted manuscript; J.M.M., J.A.H., and B.M.S. edited and revised manuscript; J.M.M., J.A.H., and B.M.S. approved final version of manuscript.
REFERENCES
- 1.Auer S, Hahne P, Soyal SM, Felder T, Miller K, Paulmichl M, Krempler F, Oberkofler H, Patsch W. Potential role of upstream stimulatory factor 1 gene variant in familial combined hyperlipidemia and related disorders. Arterioscler Thromb Vasc Biol 32: 1535–1544, 2012. [DOI] [PubMed] [Google Scholar]
- 2.Barres R, Kirchner H, Rasmussen M, Yan J, Kantor FR, Krook A, Naslund E, Zierath JR. Weight loss after gastric bypass surgery in human obesity remodels promoter methylation. Cell Rep 10: 00125–00123, 2013. [DOI] [PubMed] [Google Scholar]
- 3.Battaglia GM, Zheng D, Hickner RC, Houmard JA. Effect of exercise training on metabolic flexibility in response to a high-fat diet in obese individuals. Am J Physiol Endocrinol Metab 303: E1440–E1445, 2012. [DOI] [PMC free article] [PubMed] [Google Scholar]
- 4.Berggren JR, Tanner CJ, Houmard JA. Primary cell cultures in the study of human muscle metabolism. Exerc Sport Sci Rev 35: 56–61, 2007. [DOI] [PubMed] [Google Scholar]
- 5.Borengasser SJ, Zhong Y, Kang P, Lindsey F, Ronis MJ, Badger TM, Gomez-Acevedo H, Shankar K. Maternal obesity enhances white adipose tissue differentiation and alters genome-scale DNA methylation in male rat offspring. Endocrinology 154: 4113–4125, 2013. [DOI] [PMC free article] [PubMed] [Google Scholar]
- 6.Boyle KE, Canham JP, Consitt LA, Zheng D, Koves TR, Gavin TP, Holbert D, Neufer PD, Ilkayeva O, Muoio DM, Houmard JA. A high-fat diet elicits differential responses in genes coordinating oxidative metabolism in skeletal muscle of lean and obese individuals. J Clin Endocrinol Metab 96: 775–781, 2011. [DOI] [PMC free article] [PubMed] [Google Scholar]
- 7.Brandt JM, Djouadi F, Kelly DP. Fatty acids activate transcription of the muscle carnitine palmitoyltransferase I gene in cardiac myocytes via the peroxisome proliferator-activated receptor alpha. J Biol Chem 273: 23786–23792, 1998. [DOI] [PubMed] [Google Scholar]
- 8.Brons C, Jacobsen S, Nilsson E, Ronn T, Jensen CB, Storgaard H, Poulsen P, Groop L, Ling C, Astrup A, Vaag A. Deoxyribonucleic acid methylation and gene expression of PPARGC1A in human muscle is influenced by high-fat overfeeding in a birth-weight-dependent manner. J Clin Endocrinol Metab 95: 3048–3056, 2010. [DOI] [PubMed] [Google Scholar]
- 9.Bruce CR, Hoy AJ, Turner N, Watt MJ, Allen TL, Carpenter K, Cooney GJ, Febbraio MA, Kraegen EW. Overexpression of carnitine palmitoyltransferase-1 in skeletal muscle is sufficient to enhance fatty acid oxidation and improve high-fat diet-induced insulin resistance. Diabetes 58: 550–558, 2009. [DOI] [PMC free article] [PubMed] [Google Scholar]
- 10.Cameron-Smith D, Burke LM, Angus DJ, Tunstall RJ, Cox GR, Bonen A, Hawley JA, Hargreaves M. A short-term, high-fat diet up-regulates lipid metabolism and gene expression in human skeletal muscle. Am J Clin Nutr 77: 313–318, 2003. [DOI] [PubMed] [Google Scholar]
- 11.Chamouton J, Latruffe N. PPARalpha/HNF4alpha interplay on diversified responsive elements. Relevance in the regulation of liver peroxisomal fatty acid catabolism. Curr Drug Metab 13: 1436–1453, 2012. [DOI] [PubMed] [Google Scholar]
- 12.Consitt LA, Bell JA, Houmard JA. Intramuscular lipid metabolism, insulin action, and obesity. IUBMB Life 61: 47–55, 2009. [DOI] [PMC free article] [PubMed] [Google Scholar]
- 13.Consitt LA, Bell JA, Koves TR, Muoio DM, Hulver MW, Haynie KR, Dohm GL, Houmard JA. Peroxisome proliferator-activated receptor-gamma coactivator-1alpha overexpression increases lipid oxidation in myocytes from extremely obese individuals. Diabetes 59: 1407–1415, 2010. [DOI] [PMC free article] [PubMed] [Google Scholar]
- 14.Corre S, Galibert MD. Upstream stimulating factors: highly versatile stress-responsive transcription factors. Pigment Cell Res 18: 337–348, 2005. [DOI] [PubMed] [Google Scholar]
- 15.Dhe-Paganon S, Duda K, Iwamoto M, Chi YI, Shoelson SE. Crystal structure of the HNF4 alpha ligand binding domain in complex with endogenous fatty acid ligand. J Biol Chem 277: 37973–37976, 2002. [DOI] [PubMed] [Google Scholar]
- 16.Dressel U, Allen TL, Pippal JB, Rohde PR, Lau P, Muscat GE. The peroxisome proliferator-activated receptor beta/delta agonist, GW501516, regulates the expression of genes involved in lipid catabolism and energy uncoupling in skeletal muscle cells. Mol Endocrinol 17: 2477–2493, 2003. [DOI] [PubMed] [Google Scholar]
- 17.Evans WJ, Phinney SD, Young VR. Suction applied to a muscle biopsy maximizes sample size. Med Sci Sports Exerc 14: 101–102, 1982. [PubMed] [Google Scholar]
- 18.Galgani JE, Moro C, Ravussin E. Metabolic flexibility and insulin resistance. Am J Physiol Endocrinol Metab 295: E1009–E1017, 2008. [DOI] [PMC free article] [PubMed] [Google Scholar]
- 19.Gilde AJ, van der Lee KA, Willemsen PH, Chinetti G, van der Leij FR, van der Vusse GJ, Staels B, van Bilsen M. Peroxisome proliferator-activated receptor (PPAR) alpha and PPARbeta/delta, but not PPARgamma, modulate the expression of genes involved in cardiac lipid metabolism. Circ Res 92: 518–524, 2003. [DOI] [PubMed] [Google Scholar]
- 20.Girard J, Ferre P, Foufelle F. Mechanisms by which carbohydrates regulate expression of genes for glycolytic and lipogenic enzymes. Annu Rev Nutr 17: 325–352, 1997. [DOI] [PubMed] [Google Scholar]
- 21.Hoffman PW, Chernak JM. DNA binding and regulatory effects of transcription factors SP1 and USF at the rat amyloid precursor protein gene promoter. Nucleic Acids Res 23: 2229–2235, 1995. [DOI] [PMC free article] [PubMed] [Google Scholar]
- 22.Hunsaker TL, Jefferson HS, Morrison JK, Franklin AJ, Shewchuk BM. POU1F1-mediated activation of hGH-N by deoxyribonuclease I hypersensitive site II of the human growth hormone locus control region. J Mol Biol 415: 29–45, 2012. [DOI] [PubMed] [Google Scholar]
- 23.Jacobsen SC, Brons C, Bork-Jensen J, Ribel-Madsen R, Yang B, Lara E, Hall E, Calvanese V, Nilsson E, Jorgensen SW, Mandrup S, Ling C, Fernandez AF, Fraga MF, Poulsen P, Vaag A. Effects of short-term high-fat overfeeding on genome-wide DNA methylation in the skeletal muscle of healthy young men. Diabetologia 55: 3341–3349, 2012. [DOI] [PubMed] [Google Scholar]
- 24.Kelley DE, Mandarino LJ. Fuel selection in human skeletal muscle in insulin resistance: a reexamination. Diabetes 49: 677–683, 2000. [DOI] [PubMed] [Google Scholar]
- 25.Kim JY, Hickner RC, Cortright RL, Dohm GL, Houmard JA. Lipid oxidation is reduced in obese human skeletal muscle. Am J Physiol Endocrinol Metab 279: E1039–E1044, 2000. [DOI] [PubMed] [Google Scholar]
- 26.Maples JM, Brault JJ, Shewchuk BM, Witczak CA, Zou K, Rowland N, Hubal ML, Weber TM, Houmard JA. Lipid exposure elicits differential responses in gene expression and DNA methylation in primary human skeletal muscle cells from severely obese women. Physiol Genomics 47: 139–146, 2015. [DOI] [PMC free article] [PubMed] [Google Scholar]
- 27.Martinez-Jimenez CP, Kyrmizi I, Cardot P, Gonzalez FJ, Talianidis I. Hepatocyte nuclear factor 4alpha coordinates a transcription factor network regulating hepatic fatty acid metabolism. Mol Cell Biol 30: 565–577, 2010. [DOI] [PMC free article] [PubMed] [Google Scholar]
- 28.McGarry JD, Brown NF. The mitochondrial carnitine palmitoyltransferase system. From concept to molecular analysis. Eur J Biochem 244: 1–14, 1997. [DOI] [PubMed] [Google Scholar]
- 29.Milagro FI, Campion J, Cordero P, Goyenechea E, Gomez-Uriz AM, Abete I, Zulet MA, Martinez JA. A dual epigenomic approach for the search of obesity biomarkers: DNA methylation in relation to diet-induced weight loss. FASEB J 25: 1378–1389, 2011. [DOI] [PubMed] [Google Scholar]
- 30.Miranda TB, Jones PA. DNA methylation: the nuts and bolts of repression. J Cell Physiol 213: 384–390, 2007. [DOI] [PubMed] [Google Scholar]
- 31.Moore ML, Park EA, McMillin JB. Upstream stimulatory factor represses the induction of carnitine palmitoyltransferase-Ibeta expression by PGC-1. J Biol Chem 278: 17263–17268, 2003. [DOI] [PubMed] [Google Scholar]
- 32.Muoio DM, MacLean PS, Lang DB, Li S, Houmard JA, Way JM, Winegar DA, Corton JC, Dohm GL, Kraus WE. Fatty acid homeostasis and induction of lipid regulatory genes in skeletal muscles of peroxisome proliferator-activated receptor (PPAR) alpha knock-out mice. Evidence for compensatory regulation by PPAR delta. J Biol Chem 277: 26089–26097, 2002. [DOI] [PubMed] [Google Scholar]
- 33.Muoio DM, Way JM, Tanner CJ, Winegar DA, Kliewer SA, Houmard JA, Kraus WE, Dohm GL. Peroxisome proliferator-activated receptor-alpha regulates fatty acid utilization in primary human skeletal muscle cells. Diabetes 51: 901–909, 2002. [DOI] [PubMed] [Google Scholar]
- 34.Putt W, Palmen J, Nicaud V, Tregouet DA, Tahri-Daizadeh N, Flavell DM, Humphries SE, Talmud PJ. Variation in USF1 shows haplotype effects, gene:gene and gene:environment associations with glucose and lipid parameters in the European Atherosclerosis Research Study II. Hum Mol Genet 13: 1587–1597, 2004. [DOI] [PubMed] [Google Scholar]
- 35.Rastogi D, Suzuki M, Greally JM. Differential epigenome-wide DNA methylation patterns in childhood obesity-associated asthma. Scientific Reports 3: 2164, 2013. [DOI] [PMC free article] [PubMed] [Google Scholar]
- 36.Sandoval J, Heyn H, Moran S, Serra-Musach J, Pujana MA, Bibikova M, Esteller M. Validation of a DNA methylation microarray for 450,000 CpG sites in the human genome. Epigenetics 6: 692–702, 2011. [DOI] [PubMed] [Google Scholar]
- 37.Sawadogo M, Roeder RG. Interaction of a gene-specific transcription factor with the adenovirus major late promoter upstream of the TATA box region. Cell 43: 165–175, 1985. [DOI] [PubMed] [Google Scholar]
- 38.Sharma V, Dhillon P, Parsons H, Allard MF, McNeill JH. Metoprolol represses PGC1alpha-mediated carnitine palmitoyltransferase-1B expression in the diabetic heart. Eur J Pharmacol 607: 156–166, 2009. [DOI] [PubMed] [Google Scholar]
- 39.Shewchuk BM, Asa SL, Cooke NE, Liebhaber SA. Pit-1 binding sites at the somatotrope-specific DNase I hypersensitive sites I, II of the human growth hormone locus control region are essential for in vivo hGH-N gene activation. J Biol Chem 274: 35725–35733, 1999. [DOI] [PubMed] [Google Scholar]
- 40.Shewchuk BM, Liebhaber SA, Cooke NE. Specification of unique Pit-1 activity in the hGH locus control region. Proc Natl Acad Sci USA 99: 11784–11789, 2002. [DOI] [PMC free article] [PubMed] [Google Scholar]
- 41.Vaissiere T, Sawan C, Herceg Z. Epigenetic interplay between histone modifications and DNA methylation in gene silencing. Mutat Res 659: 40–48, 2008. [DOI] [PubMed] [Google Scholar]
- 42.van der Leij FR, Cox KB, Jackson VN, Huijkman NC, Bartelds B, Kuipers JR, Dijkhuizen T, Terpstra P, Wood PA, Zammit VA, Price NT. Structural and functional genomics of the CPT1B gene for muscle-type carnitine palmitoyltransferase I in mammals. J Biol Chem 277: 26994–27005, 2002. [DOI] [PubMed] [Google Scholar]
- 43.Watt MJ, Hoy AJ, Muoio DM, Coleman RA. Distinct roles of specific fatty acids in cellular processes: implications for interpreting and reporting experiments. Am J Physiol Endocrinol Metab 302: E1–E3, 2012. [DOI] [PMC free article] [PubMed] [Google Scholar]
- 44.Wingender E. The TRANSFAC project as an example of framework technology that supports the analysis of genomic regulation. Brief Bioinform 9: 326–332, 2008. [DOI] [PubMed] [Google Scholar]
- 45.Yu GS, Lu YC, Gulick T. Co-regulation of tissue-specific alternative human carnitine palmitoyltransferase Ibeta gene promoters by fatty acid enzyme substrate. J Biol Chem 273: 32901–32909, 1998. [DOI] [PubMed] [Google Scholar]
- 46.Zurlo F, Lillioja S, Esposito-Del Puente A, Nyomba BL, Raz I, Saad MF, Swinburn BA, Knowler WC, Bogardus C, Ravussin E. Low ratio of fat to carbohydrate oxidation as predictor of weight gain: study of 24-h RQ. Am J Physiol Endocrinol Metab 259: E650–E657, 1990. [DOI] [PubMed] [Google Scholar]