

Abstract
The purpose of this study was to determine how the expression of mitochondrial transcription factor A (Tfam), a protein that governs mitochondrial DNA (mtDNA) transcription and replication, is regulated during a state of reduced organelle content imposed by muscle disuse. We measured Tfam expression at 8 h, 16 h, 24 h, 3 days, or 7 days following denervation and hypothesized that decreases in Tfam expression would precede mitochondrial loss. Muscle mass was lowered by 13% and 38% at 3 and 7 days postdenervation, while cytochrome c oxidase activity fell by 33% and 39% at the same time points. Tfam promoter activation in vivo was reduced by 30–65% between 8 h and 3 days of denervation, while Tfam transcript half-life was increased following 8–24 h of denervation. Protein expression of RNA-binding proteins that promote mRNA degradation (CUG repeat-binding protein and K homology splicing regulator protein) was elevated at 3 and 7 days of denervation. Tfam localization within subsarcolemmal mitochondria was reduced after 3 and 7 days of denervation and was associated with suppression of the cytochrome c oxidase type I transcript at 3 days, indicating that denervation impairs both mitochondrial Tfam import and mtDNA transcription during an early period following denervation. These data suggest that putative signals downregulate Tfam transcription during the earliest stages following denervation but are counteracted by increases in Tfam mRNA stability. Import of Tfam into the mitochondrion seems to be the most critical point of regulation of this protein during the early onset of denervation, an impairment of which is coincident with the loss of mitochondria during muscle disuse.
Keywords: disuse, mitochondrial biogenesis, mitochondrial DNA, RNA-binding protein, RNA stability
chronic muscle disuse, such as that brought about by denervation, is a potent inducer of muscle atrophy (1, 48, 54). This phenomenon arises as a result of the shift in the balance between protein synthesis and degradation, favoring muscle catabolism (3, 18), in addition to the activation of pathways mediating macroautophagy (39, 40, 58). Concomitant with the reduction in muscle fiber size, mitochondrial content is also diminished, which likely accounts for impairments in muscle endurance performance (16, 54).
The regulation of mitochondrial content has been well documented; it is primarily stimulated by the activity of the transcriptional coactivator peroxisome proliferator-activated receptor-γ coactivator-1α (PGC-1α) (21, 46). PGC-1α is capable of controlling the expression of a variety of aspects of mitochondrial biogenesis through the coactivation of key nuclear transcription factors, such as nuclear respiratory factors-1 and -2 (56), which in turn can promote the expression of mitochondrial transcription factor A (Tfam) (51). Mitochondrial biogenesis requires the coordinated expression of genes encoded within the nuclear and mitochondrial genomes (mtDNA). To properly orchestrate mitochondrial biogenesis, factors that promote the transcription and expression of mtDNA must be transcribed from the nuclear genome and imported into mitochondria. Tfam, along with mitochondrial transcription factor B2 (Tfb2m) and mitochondrial RNA polymerase (POLRMT) (47, 57), is a required component of the mitochondrial transcription machinery. Tfam is unique, in than it has the ability to bind to mtDNA and distort it into a U-turn-like structure, facilitating access of other accessory components to promote mtDNA transcription (37, 43). Beyond this, Tfam also has essential roles in the replication and compaction of mtDNA into nucleoid structures (14, 25).
The necessity of Tfam has been highlighted by Larsson et al. (30), who demonstrated that whole body homozygous Tfam ablation results in embryonic lethality, whereas viable heterozygous Tfam knockout mice display reductions in mtDNA levels and compromised electron transport chain function. Muscle-specific knockouts of Tfam display similar mitochondrial impairments (55). Conversely, the transient overexpression of Tfam is sufficient to induce mtDNA expression and mitochondrial mRNAs (34). Furthermore, increases in the expression and mitochondrial import of Tfam in response to contractile activity have been shown to precede increases in mitochondrial content, suggesting a crucial role for this protein in the regulation of contractile activity-induced mitochondrial biogenesis (20). These reports underscore the vital role of Tfam in mtDNA expression, as well as organelle function.
However, the significance of regulating Tfam expression during denervation-induced atrophy has not been fully explored. Previous work has documented that denervation-induced disuse reduces mitochondrial content quite rapidly, depleting the mitochondrial pool by up to 40% following 1 wk of denervation (1, 48). This is associated with considerable reductions in the expression of factors regulating mitochondrial biogenesis (1, 44, 45, 53), including PGC-1α and Tfam, along with an impairment of protein import into the mitochondrial matrix (48).
Thus the purpose of this study was to investigate the relationship between the expression of Tfam and mitochondrial content during denervation-induced disuse. We examined the expression of Tfam at the transcriptional and posttranscriptional levels during the first week of denervation, as this is the time frame in which the most rapid and substantial loss of mitochondrial content occurs. We hypothesized that a decline in Tfam content would precede reductions in mitochondrial content as a result of a diminished drive for mitochondrial biogenesis.
MATERIALS AND METHODS
Animals and experimental design.
Animal care and experimental procedures were approved by the York Animal Care Committee and were in accordance with the Canadian Council of Animal Care. Male Sprague-Dawley rats (300–400 g body wt; Charles River, St. Constant, QC, Canada) were randomly assigned to one of five time-course groups: 8 h, 16 h, 24 h, 3 days, or 7 days. Prior to denervation in a subset of animals, the tibialis anterior (TA) of both hindlimbs was electrotransfected with the rTfam-pGL3 vector. At 4 days following electrotransfection, rats underwent surgery to induce unilateral hindlimb denervation while the contralateral hindlimb was sham-operated. At each of these time points, animals were euthanized and the TA muscles were excised from the denervated and contralateral, sham-operated limb. TA muscles from both limbs of these animals were used for a selection of biochemical analyses. In a separate set of experiments, a subset of male Sprague-Dawley rats was randomly assigned to one of three time-course groups: 24 h, 3 days, or 7 days. These animals were denervated as described below, and at each time point, animals were euthanized. The TA muscles from these animals were used to isolate subsarcolemmal (SS) mitochondrial and cytosolic fractions from freshly excised tissue, while the extensor digitorum longus (EDL) was fixed and frozen for cross-sectional area analyses.
Denervation surgery protocol.
Rats were anesthetized using gaseous isoflurane. The fast-twitch TA and EDL muscles were denervated by exposure of the left common peroneal nerve and transection of a 5-mm section. The contralateral hindlimb underwent the same procedure, whereby the right common peroneal nerve was exposed, but not transected. After administration of sterile ampicillin, the incision was sutured and closed with metal clips. The day of surgery represented day 0 of the time course. Animals were given amoxicillin in their drinking water [0.025% (wt/vol)] following the surgery. At the conclusion of the time course for each group, animals were anesthetized with ketamine-xylazine (0.2 ml/100 g body wt ip), and sham-operated and denervated TA muscles were excised, clamped frozen in liquid nitrogen, and stored at −80°C. Muscle samples used for biochemical analyses were then pulverized at the temperature of liquid nitrogen, while samples used for cross-sectional analyses were prepared as described below.
Cross-sectional analyses and succinate dehydrogenase staining.
EDL muscles from the sham-operated and denervated hindlimb were excised from the animal, mounted in Cryomatrix (Thermo Scientific), and frozen in isopentane at the temperature of liquid nitrogen. These muscles were then cryosectioned into 10-μm sections, transferred to glass slides, and incubated with a succinate dehydrogenase (SDH) staining solution (0.2 M sodium succinate, 0.2 M phosphate buffer, pH 7.4, and nitro blue tetrazolium) at 37°C for 20 min. Slides were then rinsed in distilled water, and a microscope cover glass was mounted on slides using DPX mountant for histology (catalog no. 44581, Fluka BioChemika). Photos of muscle sections were taken using a Nikon Eclipse 90i camera and QCapture software. Muscle cross-sectional areas were determined using ImageJ software.
Cytochrome c oxidase activity.
Pulverized frozen TA muscle was diluted in muscle extraction buffer (100 mM KH2PO4, 100 mM Na2HPO4, and 2 mM EDTA, pH 7.2) and sonicated three times for 5 s each on ice. Supernates were added to a solution containing fully reduced cytochrome c. This reaction was performed in a 96-well plate at 30°C using a Synergy-HT microplate reader. Cytochrome c oxidase (COX) activity was determined by the maximal rate of cytochrome c reduction, assessed by measuring the change in absorbance at 550 nm. Data were compiled with KC4 software.
SS mitochondrial isolation.
Animals were anesthetized, and denervated and sham-operated contralateral TA muscles were excised, minced, and briefly homogenized using an Ultra-Turrax Polytron at 40% power output. SS mitochondria were isolated using differential centrifugation as previously described (8) and resuspended in medium (100 mM KCl, 10 mM MOPS, and 0.2% BSA). Furthermore, cytosolic fractions of these same muscles were isolated via centrifugation. The concentrations of isolated mitochondria and cytosolic fractions were determined by Bradford colorimetric protein assay prior to immunoblotting.
Intramuscular DNA injection and electroporation in vivo.
Male Sprague-Dawley rats (300–400 g body wt) were anesthetized as described above. Electrotransfection experiments were performed as previously described (11, 12). The lower hindlimbs were shaved and sterilized prior to injection of a Tfam promoter-firefly luciferase reporter-containing plasmid [rTfam1-pGL3 vector (11)]. TA muscles from the distal portion of the leg were injected, with the syringe inserted so that its positioning paralleled that of fiber orientation. Approximately 30 μl of the plasmid solution (containing 50 μg of the rTfam1-pGL3 and 1 μg of pRL-CMV to normalize for electrotransfection efficiency in 0.9% sterile saline solution) were injected into the TA of both hindlimbs using a short 29-gauge insulin syringe (BD Ultra-Fine). Immediately after the DNA injection, transcutaneous electrical pulses were applied using an electroporation system (ECM 830, BTX Harvard Apparatus). The muscle was held on either side of the injection site by the Tweezertrodes (BTX Harvard Apparatus) at the level of the skin, and a total of eight pulses were delivered, with anode and cathode electrode orientation being reversed after four pulses (100 V/cm, 20 ms, 1 Hz per pulse). At 4 days after treatment, the animals were subjected to the denervation protocol as described below. At the conclusion of the denervation time course, muscles were excised, clamped frozen, and stored. All muscles were then powdered at the temperature of liquid nitrogen until further molecular analyses were performed.
pGL3 and pRL-CMV luciferase reporter assay.
Muscle powders from the denervated and sham-operated hindlimbs (30–50 mg) were diluted sevenfold (wt/vol) in 1× passive lysis buffer. Homogenates were sonicated on ice (3 times for 10 s each) and subsequently centrifuged at 16,100 g for 5 min at 4°C. After centrifugation, 20 μl of the supernate were used to assess pGL3 luciferase activity using a luminometer (Lumat LB9507). pGL3 firefly luciferase values were corrected for electrotransfection efficiency by simultaneous assessment of pRL Renilla luciferase activity.
In vitro cytosolic protein extraction.
Frozen powders (50 mg) from sham-operated and denervated TA muscles were homogenized separately in 500 μl of sterile homogenization buffer (25% glycerol, 0.42 M NaCl, 1.5 mM MgCl2, 0.2 mM EDTA, 20 mM HEPES, pH 7.9, 0.5 mM 1,4-DTT, 0.5 mM PMSF, and RNase-free water) at 30% power output three times for 10 s each. Homogenates were centrifuged at 5,000 g for 15 min at 4°C. The supernate was transferred to a sterile Eppendorf tube and further centrifuged at 15,000 g for 15 min at 4°C to produce mitochondria-free (S15) crude cytosolic fractions. Protein concentrations were determined by the Bradford colorimetric protein assay.
In vitro RNA isolation.
Total RNA was isolated using TRIzol reagent (Life Technologies), whereby muscle tissue powders were derived from TA of the sham-operated or denervated animals (∼100 mg tissue/ml TRI Reagent). RNA isolation was performed as previously described (11, 28). Briefly, RNA was precipitated overnight at −20°C with isopropanol and subsequently pelleted, washed, dried, and resuspended in sterile water. RNA concentration and purity were assessed using spectrophotometry, while RNA quality was affirmed through separation on a 1% agarose-formaldehyde gel for visualization of 28S and 18S rRNA.
In vitro mRNA decay assay.
Total RNA (35 μg) derived from TA muscle of Sprague-Dawley rats was combined with 20 μg of S15 cytosolic extracts derived from the denervated or control TA muscle of animals subjected to the time-course denervation protocol. To allow for assessment of the degradation of RNA within the incubated tubes as a percentage of the original RNA content, a tube containing 35 μg of RNA and 5 μl of sterile homogenization buffer in a 100-μl reaction volume served as a baseline measure at time 0. This sample does not contain the cytosolic proteins, and it allowed us to determine the amount of RNA in the sample without the influence of cytosolic factors. Reaction volumes were set at 100 μl, and samples were incubated at 37°C for 15 or 45 min. At the completion of each incubation time point, phenol was added to each sample, which was shaken vigorously to halt mRNA degradation. Total RNA was then reisolated using a phenol-chloroform-isoamyl alcohol extraction procedure as previously described (28). The reisolated RNA was pelleted, washed, dried, and resuspended in sterile water. RNA concentration and purity were determined via spectrophotometry.
Reverse transcription-polymerase chain reaction.
For the purpose of assessment of mRNA decay kinetics, cDNA was reverse-transcribed from 1.5 μg of total RNA, which was isolated following the in vitro decay assay, using SuperScript III reverse transcriptase in a 20-μl reaction. Subsequently, cDNA was amplified by semiquantitative polymerase chain reaction (PCR) using GoTaq Flexi DNA polymerase (Promega) with the required reagents and sequence-specific sense and antisense primers in a 50-μl reaction. Primer sequences and PCR cycle count for Tfam and ribosomal protein S12 (Rps12) are listed in Table 1. PCR products (40 μl) were visualized on ethidium bromide-stained 1.8% agarose gels under UV light and quantified using Sigma Scan Pro (v.5) software. For use in real-time PCR, oligonucleotide primers were designed using sequences from GenBank and Primer3 (v.0.4.0) software (MIT, Cambridge, MA), and primer specificity was confirmed using OligoAnalyzer 3.1 (Integrated DNA Technologies). Real-time PCR primer sequences for Tfam, COX I, Rps12, and cytoskeletal protein β-actin (Actb) transcripts are also listed in Table 1.
Table 1.
PCR primers
| Primer Sequence |
|||||
|---|---|---|---|---|---|
| Usage | Transcript | Forward | Reverse | Product Size, bp | PCR Cycle Count |
| Semiquantitative PCR | Tfam | 5′-ATGGCGCTGTTC CGGGGAATGTGG-3′ | 5′-TTAATTCTCAGA GATGTCTCCCGGG-3′ | 735 | 34 |
| S12 | 5′-GGAAGGCATAGC TGCTGG-3′ | 5′-CCTCGATGACATC CTTGG-3′ | 638 | 26 | |
| Real-time PCR | |||||
| mRNA | Tfam | 5′-CGCCTGTCAGCC TTATCTGTA-3′ | 5′-TGCATCTGGGTGT TTAGCTTA-3′ | 131 | n/a |
| COX I | 5′-GCCAGTATTAGCA GCAGGTAT-3′ | 5′-TGTTGATAAAGGA TTGGGTCT-3′ | 102 | n/a | |
| S12 | 5′-ATGGACGTCAAC ACTGCTCT-3′ | 5′-ATCTCTGCGTGCT TGCAT-3′ | 127 | n/a | |
| β-Actin | 5′-CCCCATTGAACA CGGCAT-3′ | 5′-GCCAACCGTGAA AAGATGACC-3′ | 154 | n/a | |
| DNA | COX I | 5′-GCCAGTATTAGCA GCAGGTAT-3′ | 5′-TGTTGATAAAGGA TTGGGTCT-3′ | 102 | n/a |
| COX II | 5′-CCCATTTCAACTT GGCTTACA-3′ | 5′-AGGGAGCTGATG AGGAATACA-3′ | 102 | n/a | |
| D-loop region | 5′-TCTCGATGGTAAC GGGTCTA-3′ | 5′-GCCTTGACGGCT ATGTTGA-3′ | 106 | n/a | |
| β-Actin | 5′- AGCCTTCCTTCCT GGGTAAGT-3′ | 5′-GGATGCCACAGGA TTCCATA-3′ | 124 | n/a | |
Tfam, mitochondrial transcription factor A; S12, ribosomal protein 12 (Rps12); COX I, cytochrome c oxidase subunit I; COX II, cytochrome c oxidase subunit II; D-loop region, noncoding regulatory region of the mitochondrial genome; β-actin, cytoskeletal protein β-actin; bp, base pairs.
Real-time PCR.
Gene expression was quantified in a 96-well plate using the StepOnePlus real-time PCR system (Applied Biosystems), along with SYBR Green chemistry (PerfeCTa SYBR Green SuperMix, ROX, Quanta BioSciences). Each well contained SYBR Green SuperMix forward and reverse primers (20 μM) and 100 ng of cDNA or total DNA (diluted in diethylpyrocarbonate-treated water), resulting in a final reaction volume of 25 μl per well. The PCR program consisted of a holding stage (95°C for 10 min), followed by 40 cycles of annealing (60°C for 1 min) and extension (95°C for 15 s) and a final melting stage (95°C for 15 s, 60°C for 1 min, 95°C for 15 s). Samples were tested in duplicates to ensure accuracy. Analyses of melt curves generated by the instrument were used to determine the presence of nonspecific amplification and primer dimers. Negative control wells contained diethylpyrocarbonate-treated water in place of cDNA or total DNA.
Real-time PCR quantification.
The threshold cycle (CT) value for the endogenous control genes for mRNA measures were averaged, in lieu of a single reference gene. The average CT values for these genes, Rps12 and Actb, did not change between sham-operated and denervated muscles within, as well as between, time points. This average was subtracted from the CT value of the gene of interest [ΔCT = CT(target gene) − CT(endogenous control)]. The same procedure was used in the quantification of mtDNA and nuclear DNA (nDNA), whereby the CT value of nDNA control, Actb, was subtracted from the CT value of a mitochondrial DNA marker (COX I, COX II, or the D-loop region). Actb was utilized as a sole endogenous nuclear DNA control, as it was unchanged between treatment conditions and across time points. In both instances, the ΔCT value of the sham-operated tissue was then subtracted from the ΔCT value of the denervated tissue [ΔΔCT = ΔCT(denervated) − ΔCT(sham-operated)]. Results are reported as fold changes using the ΔΔCT method, calculated as 2−ΔΔCT.
mtDNA quantification.
mtDNA copy number was quantified as the ratio of mtDNA to nDNA using real-time PCR. Total DNA was isolated from frozen powders (30 mg) of sham-operated and denervated TA muscle using the DNeasy Blood and Tissue Kit (Qiagen) according to the manufacturer's instructions. Then PCR was performed on the total DNA using sequence-specific sense and antisense primers for mtDNA (the mtDNA D-loop region or the regions encoding COX I or COX II) and nDNA (Actb), and the relative ratio of mtDNA to nDNA was determined. Real-time PCR primer sequences designed for the DNA sequences of COX I, COX II, the mtDNA D-loop region, and Actb are listed in Table 1.
Protein extraction and immunoblotting.
For whole muscle protein extraction, 20 μg of powdered tissue were added to Sakamoto buffer (20 mM HEPES, 2 mM EGTA, 1% Triton X-100, 10% glycerol, 50 mM β-glycerophosphate, 1 mM PMSF, 1 mM DTT, 1 mM sodium orthovanadate, 10 μM leupeptin, 5 μM pepstatin A, and 10 mg/ml aprotinin) and diluted 20-fold. Samples were rotated for 1 h, sonicated (3 times for 3 s each at 30% power), and centrifuged for 10 min at 12,000 g. Supernates were recovered, and protein concentration was determined by Bradford protein assay. Whole muscle or isolated SS mitochondrial and cytosolic extracts were separated by SDS-PAGE and subsequently electrotransferred onto nitrocellulose membranes. Membranes were blocked for 1 h in 1× Tris-buffered saline-Tween 20 [TBST; 25 mM Tris·HCl (pH 7.5), 1 mM NaCl, and 0.1% Tween 20] containing 5% skim milk and then incubated at 4°C overnight in blocking buffer with antibodies directed toward Tfam [1:3,000 dilution; manufactured in-house (20)], aciculin (1:250 dilution, Developmental Studies Hybridoma Bank, University of Iowa), porin (1:1,000 dilution; catalog no. MSA03, MitoSciences), human antigen R (HuR, 1:2,000 dilution; sc5261), CUG repeat binding protein (CUGBP1, 1:1,000; sc20003), K homology-type splicing regulatory protein (KSRP, 1 ml prediluted antibody serum), MT-CO1 (COX I, 1:1,000 dilution; catalog no. ab14705), MT-CO2 (COX II, 1:1,500 dilution; catalog no. bs-2376R), and COX IV (1:3,000 dilution; catalog no. ab14744). The KSRP antibody was a generous gift from Dr. Bernard Jasmin (University of Ottawa). After incubation, blots were washed in 1× TBST (3 times for 5 min each) to remove excess primary antibody and incubated with the appropriate secondary antibody coupled to horseradish peroxidase at room temperature for 1 h. Membranes were washed again with 1× TBST to remove excess secondary antibody, and antibody-bound protein was revealed by the enhanced chemiluminescence method. Films were scanned and analyzed using Carestream Molecular Imaging software standard edition v.5.4.2. To control for loading, protein quantifications were corrected with aciculin or porin immunoblotting or Ponceau staining where noted. There was no effect of time or denervation on the loading controls.
Statistical analyses.
Data were produced and analyzed with GraphPad 4.0 software, and values are means ± SE. Student's paired t-test was employed to assess differences between conditions. The nonlinear regression equation 50 = 100e(−kx) (where k is the measured rate of decay) was used to calculate mRNA half-lives. A two-way ANOVA was performed to determine differences in Tfam half-life.
RESULTS
Effect of denervation on muscle mass, muscle fiber cross-sectional area, and mitochondrial content.
Denervation of the TA muscle did not influence muscle mass within the first 24 h; however, significant reductions in muscle mass of 13% and 38% were observed after 3 and 7 days of denervation compared with the contralateral, sham-operated hindlimb (P < 0.05; Fig. 1A). To ensure that the lack of change in muscle mass within the first 24 h of denervation was not masked by local tissue inflammation and edema, we compared the wet and dry tissue masses of the TA muscle within this time period. There was no difference in the ratio of wet mass to dry mass of this muscle, confirming that tissue edema did not confound our measures of muscle mass during the period immediately following denervation (Fig. 1B). We also assessed the effect of denervation on the muscle mass and cross-sectional area of the EDL. Denervation reduced the mass of the EDL by 4 and 30% after 3 and 7 days, respectively (Fig. 1C). Individual fiber cross-sectional area of the EDL was also reduced following 3 or 7 days of denervation (Fig. 1, D and E), illustrated by the leftward shift in the fiber size frequency distributions with continued denervation (Fig. 1E). These data verify that our denervation paradigm was sufficient to induce a reduction in muscle mass and cross-sectional area.
Fig. 1.

Denervation (DEN) decreases hindlimb muscle mass and cross-sectional area (CSA). A: tibialis anterior (TA) muscle mass corrected for body mass (BM, n = 5–7 per time point). B: TA wet weight corrected for dry weight (n = 3 per time point). C: extensor digitorum longus (EDL) muscle mass corrected for body mass (n = 4 per time point). D: succinate dehydrogenase staining of sham-operated and denervated EDL muscles at 24 h, 3 days, and 7 days of denervation. E: fiber size distributions from sham-operated, 3-day-denervated, and 7-day-denervated EDL muscles. CSA data for sham-operated hindlimbs are pooled results of all sham-operated muscles analyzed (n = 4 per time point). *P < 0.05 vs. sham at the same time point. Values are means ± SE.
Effect of denervation on mitochondrial content and expression of nuclear- and mitochondrial-encoded mitochondrial proteins.
To assess a time course of the reduction in mitochondrial content with denervation, we measured COX activity, a common marker indicative of the mitochondrial content of a tissue. COX activity declined by 33 and 39% after 3 and 7 days of denervation, respectively (Fig. 2A). We also measured the expression of mitochondrially encoded COX subunits in isolated SS mitochondrial fractions. In particular, the protein expression of COX I and COX II was reduced by 36 and 72% and by 55 and 85% by 3 and 7 days of denervation, respectively (Fig. 2, B and C). In a similar fashion, denervation lowered expression of the nuclear-encoded COX subunit COX IV protein by 33 and 72% at 3 and 7 days of denervation, respectively (Fig. 2D).
Fig. 2.

Denervation lowers mitochondrial content and reduces expression of cytochrome c oxidase (COX) subunits in isolated mitochondria. A: TA COX activity in response 8 h, 16 h, 24 h, 3 days, and 7 days of denervation (n = 5 per time point). B–D: representative Western blots of mitochondrial DNA-encoded proteins COX I (B) and COX II (C), as well as the nuclear DNA-encoded protein COX IV (D) in isolated subsarcolemmal mitochondria from sham-operated (S) or denervated (D) muscle (n = 4 per time point for all experiments) *P < 0.05 vs. sham at the same time point. Values are means ± SE.
Effect of denervation on mtDNA copy number and mtDNA transcription.
As a corollary measure of mitochondrial content, we measured relative mtDNA copy number by real-time PCR, which was determined as the ratio of mtDNA to nDNA. We used primers for the mtDNA D-loop region as a marker of mtDNA and the cytoskeletal protein β-actin (Actb) as a measure of nDNA to quantify the relative abundance of mtDNA and nDNA. After 3 and 7 days of denervation, the ratio of mtDNA to nDNA was reduced by 20 and 43%, respectively (Fig. 3A). Similar reductions in the ratio of mtDNA to nDNA were observed when primers for the COX I- or COX II-encoding regions of mtDNA were used in place of the D-loop region as a mtDNA marker to determine relative mtDNA copy number (data not shown). To determine whether denervation may have also had an impact on mtDNA transcription, we measured the mRNA content of the mtDNA-encoded COX I as an indirect index of mtDNA transcription. Denervation significantly reduced COX I mRNA by 36 and 25% after 3 and 7 days of denervation, respectively (P < 0.05; Fig. 3B). We subsequently corrected these values to the mtDNA copy number at the same time points to evaluate the role of changes in mtDNA on transcript levels (Fig. 3A). Denervation significantly reduced the ratio of COX I mRNA to mtDNA copy number by 22% after 3 days of denervation, but intriguingly, this ratio increased by 35% after 7 days of denervation (P < 0.05; Fig. 3C).
Fig. 3.
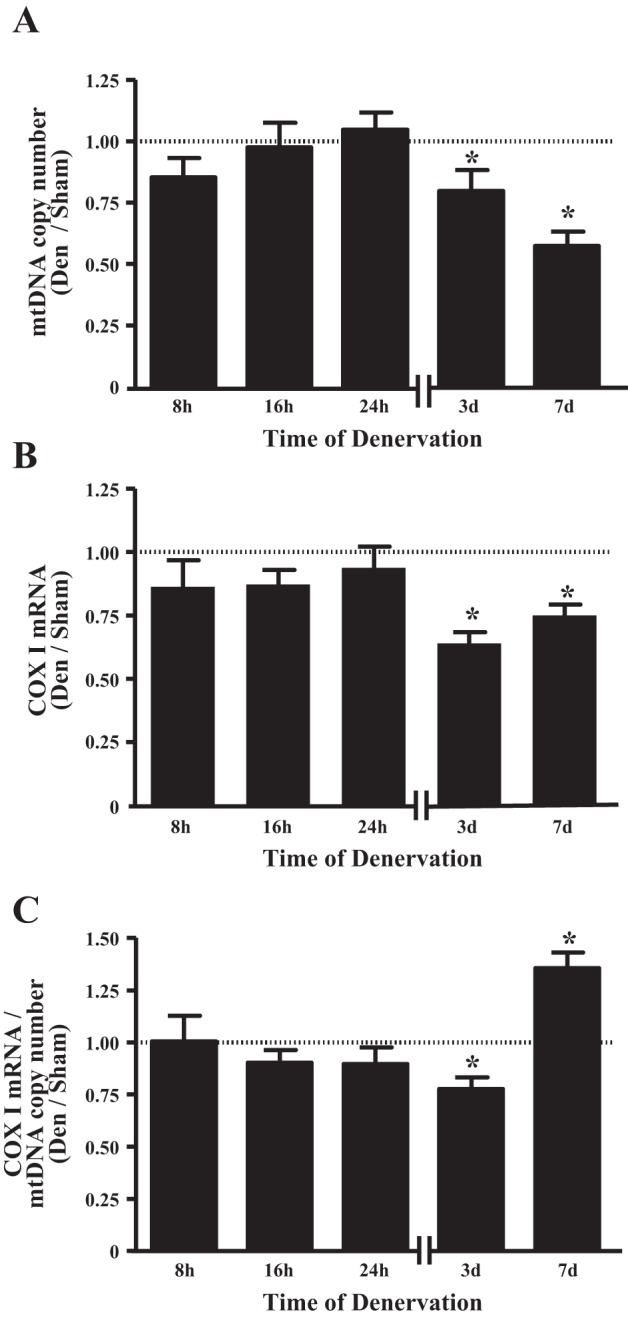
Denervation reduces mitochondrial DNA (mtDNA) copy number and mtDNA transcript expression. A: relative mtDNA copy number in TA muscle, calculated as ratio of mtDNA to nuclear DNA (n = 5 per time point). Threshold cycle (CT) values from quantitative PCR of the mtDNA D-loop region were normalized to nuclear DNA-encoded cytoskeletal protein β-actin, which was unchanged across all conditions. B: as an indirect index of mtDNA transcription, mRNA content of mtDNA-encoded COX I was measured using quantitative PCR (n = 5–6 per time point). C: cellular COX I transcript levels corrected for mtDNA copy number. *P < 0.05 vs. sham at the same time point. Values are means ± SE.
Effect of denervation on Tfam intracellular localization.
We previously showed that the import of the mitochondrial matrix-destined protein octamer-binding transcription factor is diminished in response to denervation (48). To further test our hypothesis that denervation reduces matrix-destined protein import, we measured the protein abundance of Tfam, a fundamental component of machinery required to transcribe mtDNA, in isolated SS mitochondria, as well as in the cytosolic fractions of the same muscles (Fig. 4A). Our Tfam antibody detects two bands, a 27-kDa, full-length precursor Tfam, which was present exclusively in the cytosol, and a 24-kDa mature Tfam, which was localized in mitochondria. The difference in molecular weight is accounted for by the proteolytic removal of the mitochondrial targeting sequence during protein import (49). In line with our previous measurements, SS mitochondrial Tfam content was reduced by 63 and 67% after 3 and 7 days of denervation, respectively (P < 0.05, Fig. 4A), a decrease that was approximately twofold greater than the decline in overall mitochondrial content (Fig. 2A).
Fig. 4.

Denervation diminishes intramitochondrial localization of mitochondrial transcriptional factor A (Tfam) protein, represses activation of the Tfam promoter, and induces alterations in stability of the Tfam transcript. A: cytosolic and subsarcolemmal (SS) mitochondrial fractions were isolated from TA muscle denervated for 24 h, 3 days, and 7 days. Top: representative Western blot highlighting cytosolic form of Tfam (“pre-Tfam”) and cleaved mitochondrial Tfam; bottom: graphical representation of data from Western blot (n = 3–4 per time point). B: Tfam transcriptional activity in response to 8 h, 16 h, 24 h, 3 days, and 7 days of denervation, determined using a 1.1-kb proximal Tfam promoter-luciferase reporter construct in TA muscle (n = 4–7 per time point). C: Tfam mRNA content in response to denervation measured using quantitative PCR (n = 6 per group). D: degradation of Tfam mRNA in sham-operated or denervated TA muscle at 8 h, 24 h, or 7 days postsurgery. Top: representative ethidium bromide-stained agarose gel; bottom: graphical representation of rate of decay (left) used to calculate half-life of Tfam (right) at a given time point. A reaction in the absence of cDNA is shown as a negative control. Half-lives were calculated as described in materials and methods (n = 5 per time point). *P < 0.05 vs. sham at the same time point. αP < 0.05, main effect of treatment. Values are means ± SE.
Effect of denervation on Tfam transcriptional activation, mRNA content, and stability.
Given the well-described role for Tfam in the expression of mtDNA-encoded transcripts, mtDNA copy number, and, consequently, mitochondrial function, we set out to assess the regulation of Tfam expression in response to denervation at the transcriptional and posttranscriptional levels. To measure the transcriptional activation of the Tfam promoter, we electrotransfected a 1.1-kb rat Tfam promoter-luciferase reporter into the TA prior to denervation. Activity of the promoter was reduced by 30–65% between 8 h and 3 days of denervation but was not significantly different from the contralateral, sham-operated TA after 7 days of denervation (Fig. 4B). Tfam mRNA was not different between denervated and sham-operated muscles between 8 h and 3 days of denervation but was increased 1.9-fold after 7 days of denervation (Fig. 4C). To resolve the incongruence between Tfam transcription and transcript levels, we also measured the stability of Tfam mRNA using an established in vitro cell-free mRNA decay assay (11, 28). Tfam mRNA was stabilized during short-term denervation, as transcript half-life was enhanced 1.8-fold after 8 h (P < 0.05) and 3-fold after 24 h (P = 0.08) of denervation (Fig. 4D). However, after 7 days of denervation, Tfam transcript stability was decreased by ∼40% compared with its half-life in the sham-operated muscle (P < 0.05; Fig. 4D). Thus, despite the early reduction in Tfam transcriptional activity following denervation, mRNA content is maintained at a constant level as stability is increased during the same time period.
Expression of RNA-binding proteins during denervation.
To gain further insight into the mechanisms mediating Tfam mRNA half-life during denervation, we assessed the expression of several RNA-binding proteins (RBPs) that have been implicated in the regulation of mRNA stability. In whole muscle protein extracts, no effect of denervation was observed on expression of HuR, a protein that promotes the stability and translation of target mRNAs (29) (Fig. 5A). Expression of CUGBP1, an mRNA-destabilizing protein that can interact with GC-, GU-, and AU-rich elements (36, 42), was elevated 1.4-, 1.9-, and 4.3-fold by 24 h, 3 days, and 7 days following denervation, respectively (Fig. 5B). KSRP, a protein that has role in the modulation of AU-rich element-containing mRNAs (19), was increased by 2.1- and 2.8-fold at 3 and 7 days postdenervation, respectively (Fig. 5C).
Fig. 5.
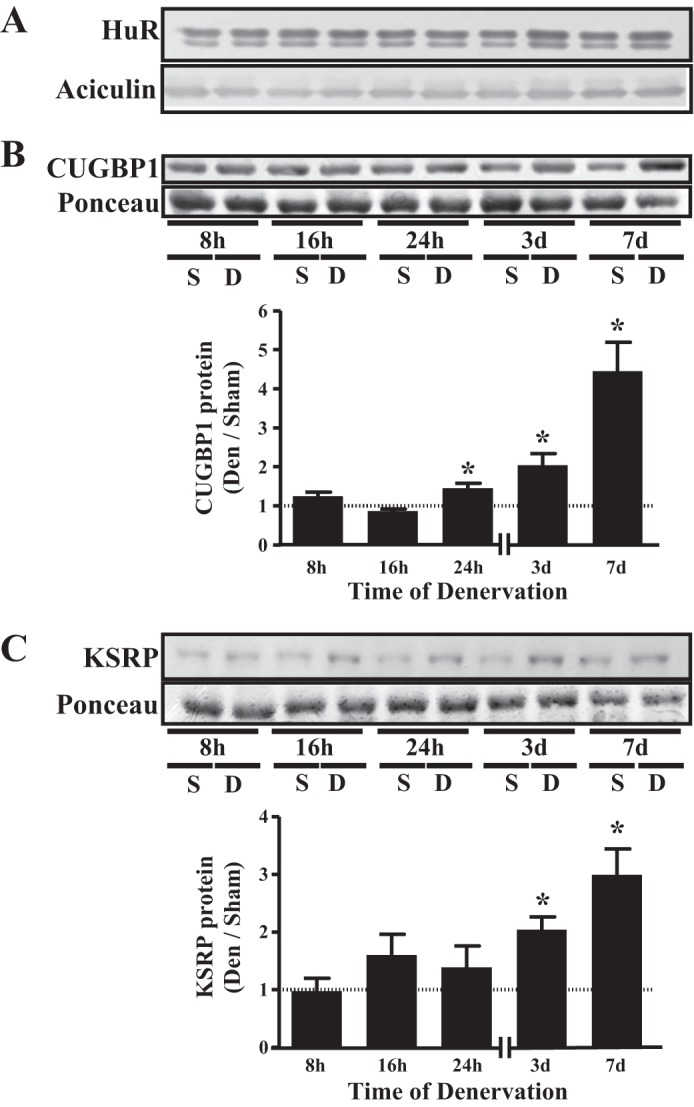
Denervation increases expression of mRNA destabilizing proteins. A–C: representative Western blot and graphical representation of human antigen R (HuR), CUG repeat binding protein (CUGBP1), and K homology splicing regulator protein (KSRP) expression in sham-operated and denervated muscle (n = 4 per time point for all experiments). Aciculin was used as loading control for HuR measurements, while Ponceau stains served as loading control for CUGBP1 and KSRP measurements. *P < 0.05 vs. sham at the same time point. Values are means ± SE.
DISCUSSION
It is well documented that chronic denervation-induced muscle atrophy is associated with a concomitant reduction in muscle mitochondrial content (1, 48, 54). Interestingly, this decrease in mitochondrial content appears to proceed in two phases: a rapid, substantial reduction that occurs during the first week subsequent to denervation followed by a slower, more gradual decline in the weeks that follow (1, 54). Previous work has highlighted the reduction in expression of factors implicated in mitochondrial biogenesis with prolonged muscle denervation (1, 44, 53). However, given the extensive decrease in muscle mitochondrial content during the early stages, we wished to determine if this was a by-product of a diminished drive for mitochondrial biogenesis. To do so, we examined the impact of denervation on the expression of Tfam, an essential nuclear-encoded mitochondrial transcription factor noted for its role in controlling mitochondrial DNA copy number, transcription, and compaction (13, 26, 34, 55). Thus the primary purposes of this study were to investigate the influence of short-term denervation-induced disuse on the control of various levels of Tfam expression and to determine if the large reduction in mitochondrial content could be attributed to alterations in the regulation of this transcription factor. We hypothesized that Tfam transcriptional activity, mRNA, and intramitochondrial protein content would decline and that these changes would precede the lessening of mitochondrial content.
Our first goal was to determine how rapidly and to what extent muscle mass and mitochondrial content were reduced during the very early stages of denervation. Our data illustrate that muscle mass of the TA (Fig. 1A) and EDL (Fig. 1, C–E) was reduced as soon as 3 days following denervation and declined further thereafter. To ensure that muscle atrophy at the earliest time points following denervation was not masked by inflammation and edema, we determined that there were no differences in the water content of the muscles from the sham-operated or denervated hindlimbs (Fig. 1B). Furthermore, we confirmed that the reduction in muscle mass was indeed a consequence of the reduction in muscle fiber size, a hallmark of atrophy, by quantifying fiber cross-sectional area (Fig. 1, D and E). The leftward shift in the fiber size distribution (Fig. 1E) with increasing time of denervation indicates that this was certainly the case.
The reduction in muscle mass was paralleled by a decline in COX activity, a common index of mitochondrial content, after 3 and 7 days of denervation (Fig. 2A). This change occurred in concert with a reduced expression of mitochondrial- and nuclear-encoded mitochondrial proteins. Specifically, we assessed the protein content of three subunits of the COX holoenzyme, COX I, COX II, and COX IV, in isolated SS mitochondria. Both mitochondrially encoded COX I and COX II proteins were reduced within the organelle following 3 and 7 days of denervation (Fig. 2, B and C). Similarly, nuclear-encoded COX IV was coordinately reduced (Fig. 2D), an effect that is likely mediated by the reduction in PGC-1α with denervation (1, 5, 22, 45, 53), a potent inducer of COX IV expression (32, 56). Additionally, the diminished expression of these subunits may also be linked to the impairment in mitochondrial respiration during muscle disuse (1, 38, 40, 48).
In parallel with the reduction in COX activity, we observed a decrease in mtDNA copy number, another marker of mitochondrial content, after 3 and 7 days of denervation (Fig. 3A). Additionally, COX I transcript levels were attenuated at these same time points (Fig. 3B), providing evidence for a reduction in mtDNA transcription, which contributes to the reduced protein expression of mtDNA-encoded COX subunits (Fig. 2, B and C). To examine whether the changes in COX I transcript levels were a by-product of the reduction in mtDNA copy number, we normalized these values to the mtDNA copy number at each time point of denervation (Fig. 3C). After 3 days of denervation, the ratio of COX I transcript to mtDNA copy number was reduced, suggesting that, at this time point, the impairment in mtDNA transcription was greater than the reduction in mtDNA copy number (Fig. 3C). To our surprise, this trend was reversed by 7 days of denervation, suggesting that the denervation-induced time-dependent decrease in mtDNA transcripts is due to a combination of reduced transcription and diminished mtDNA copy number.
Since Tfam is important in the regulation of mtDNA transcription and copy number, we investigated the regulation of Tfam expression at the transcriptional, posttranscriptional, and posttranslational levels. We previously showed that, with 6 wk of denervation, total cellular Tfam protein levels are reduced by 60% (1). Additionally, the import of ornithine carbamoyltransferase, a mitochondrial matrix-destined protein, was decreased as early as 3 days following denervation (48). Thus we hypothesized that denervation would result in a reduction of Tfam within mitochondria. To test this, we examined the protein content of Tfam in isolated SS mitochondria, as import into the mitochondrial matrix is required for it to interact with mtDNA. We chose to specifically investigate SS mitochondria, as this mitochondrial subpopulation has been shown to adapt to physiological stimuli with greater rapidity than the intermyofibrillar population (1, 4, 24, 48). In line with previous data, our current work reveals that intramitochondrial Tfam content was lowered in SS mitochondria as early as 3 days of denervation (Fig. 4A). This may provide a mechanism for the reduction in mtDNA copy number and COX I transcript levels at these same time points.
We then set out to examine the regulation of Tfam at the transcriptional and posttranscriptional levels to further evaluate the relationship between Tfam expression and mitochondrial content during changes in muscle activity. Interestingly, Tfam transcription in the TA muscle was reduced as early as 8 h following the denervation surgery and remained depressed for up to 3 days after removal of the neural stimulus (Fig. 4B). This provides evidence that factors interacting with the 1.1-kb proximal rat promoter of this gene are either less active in the induction or more active in the repression of the transcription of this gene and that this occurs well before the reduction of mitochondrial content. Unexpectedly, the mRNA content of Tfam was unaltered during this same time period (Fig. 4C), which exposed a dissociation between transcription and steady-state mRNA levels.
To evaluate this further, we utilized a cell-free in vitro decay assay that has been well described by our laboratory (11, 17, 28) to determine relative mRNA degradation rates between multiple divergent skeletal muscles. In this case, we sought to compare the degradation rate of Tfam mRNA between skeletal muscle that had been sham-operated or denervated. Our observations indicate that Tfam mRNA decay was attenuated at the early time points following denervation (Fig. 4D). This suggests that the lack of change in the steady-state Tfam mRNA could be accounted for by concomitant decreases in mRNA transcription, along with increases in mRNA stability. We are uncertain of the reason for the increase in mRNA content of Tfam following 7 days of denervation, but this may be due to a concomitant deficiency in the cell's capacity to translate the transcript. While we have not assessed the impact of denervation on translation in the current work, previous studies have suggested that skeletal muscle atrophy is associated with impairments in the initiation of translation (10, 27), as well as the diminished expression and activity of ribosomal components (23, 33, 35). We also previously documented the existence of tissue-specific mechanisms that control the stability of mitochondrially associated mRNAs (9, 11, 28). The current work highlights the notion that, in addition to tissue-specific mechanisms, mRNA stability is also reliant on time-dependent factors following the onset of an adaptive stimulus (Fig. 4D). Interestingly, we previously noted an opposing change, that is, a reduction in mRNA stability in response to chronic muscle use (28), indicating that the influence of mRNA stability is also stimulus-dependent.
In an attempt to reveal possible mechanisms accounting for the different half-lives of the Tfam transcript between sham-operated and denervated muscles, we investigated factors that might contribute to the change in Tfam transcript stability. The stability of mRNAs is mediated primarily by sequence elements found in the 3′-untranslated regions (UTRs) of transcripts, most notably those rich in adenosine and uridine (AU-rich elements) and guanosine and uridine (GU-rich elements) (7, 52). RBPs bind to these elements and promote the stabilization or degradation of the target mRNAs. In preliminary analyses, we mapped the 3′-UTR of the rat Tfam transcript and identified multiple potential binding sites for several RBPs based on target consensus sequences (7, 19, 36, 41, 42). We chose to measure several RBPs that have been characterized in skeletal muscle to have a role in facilitating transcript stabilization, as is the case with HuR (15, 31), or in promoting transcript destabilization, such as CUGBP1 (31) and KSRP (2, 6).
Our results indicate that HuR expression remained unaltered over the denervation time course (Fig. 5A), while whole cell protein expression of CUGBP1 and KSRP was elevated with progressive denervation (Fig. 5, B and C). This suggests that the overall cellular expression of these factors may not control the alterations in stability at the early denervation time points. While not examined in this study, alterations in the binding affinity or intracellular localization of these proteins may also contribute to the changes in Tfam stability. Furthermore, other proteins or noncoding RNAs (micro-RNAs) may also play a role in explaining our data. Nonetheless, it remains possible that the increased expression of both of the measured destabilizing RBPs contributes to the reduction in Tfam transcript stability after 7 days of denervation. We have identified multiple putative sequence elements in the 3′-UTR of the rat Tfam gene (data not shown), which, on the basis of sequence specificity of the above-mentioned RBPs, may represent binding sites for these proteins. Future work will examine possible interactions between RBPs and these elements in the Tfam 3′-UTR.
In sum, it appears that there are factors, albeit unknown at this time, regulating the Tfam promoter during the earliest stages following denervation. These effects are counteracted by alterations in the stability of the Tfam transcript. Ultimately, import of Tfam into the mitochondrion appears to be a crucial point in the regulation of Tfam activity during the early stages of denervation. Reductions in Tfam import occurred in concert with the decline in mitochondrial content, and we previously showed that COX activity is positively correlated with the rate of mitochondrial protein import (48). Thus the decrease in mitochondrial content as a result of denervation-induced muscle disuse is a result of diminished synthesis pathways, in part mediated by Tfam, along with the substantial increases in mitochondrial-specific autophagy (i.e., mitophagy) observed with sustained denervation (39, 50). Future studies should strive to determine the upstream signals regulating the Tfam promoter during denervation and could seek to further elucidate the processes that contribute to the reduction in mitochondrial content within the first 72 h of denervation.
GRANTS
This work is supported by funding from the Natural Sciences and Engineering Research Council of Canada to D. A. Hood. D. A. Hood is the holder of a Canada Research Chair in Cell Physiology.
DISCLOSURES
No conflicts of interest, financial or otherwise, are declared by the authors.
AUTHOR CONTRIBUTIONS
L.D.T. and D.A.H. developed the concept and designed the research; L.D.T. and M.J.C. performed the experiments; L.D.T., M.J.C., and D.A.H. analyzed the data; L.D.T. and D.A.H. interpreted the results of the experiments; L.D.T. prepared the figures; L.D.T. drafted the manuscript; L.D.T. and D.A.H. edited and revised the manuscript; L.D.T. and D.A.H. approved the final version of the manuscript.
ACKNOWLEDGMENTS
The authors are grateful for the excellent technical assistance of Eric M. A. Desjardins and Stephen F. Pastore.
REFERENCES
- 1.Adhihetty PJ, O'Leary MF, Chabi B, Wicks KL, Hood DA. Effect of denervation on mitochondrially mediated apoptosis in skeletal muscle. J Appl Physiol 3: 1143–1151, 2007. [DOI] [PubMed] [Google Scholar]
- 2.Amirouche A, Tadesse H, Lunde JA, Bélanger G, Côté J, Jasmin BJ. Activation of p38 signaling increases utrophin A expression in skeletal muscle via the RNA-binding protein KSRP and inhibition of AU-rich element-mediated mRNA decay: implications for novel DMD therapeutics. Hum Mol Genet 22: 3093–3111, 2013. [DOI] [PubMed] [Google Scholar]
- 3.Argadine HM, Hellyer NJ, Mantilla CB, Zhan W, Sieck GC. The effect of denervation on protein synthesis and degradation in adult rat diaphragm muscle. J Appl Physiol 107: 438–444, 2009. [DOI] [PMC free article] [PubMed] [Google Scholar]
- 4.Bizeau ME, Willis WT, Hazel JR. Differential responses to endurance training in subsarcolemmal and intermyofibrillar mitochondria. J Appl Physiol 85: 1279–1284, 1998. [DOI] [PubMed] [Google Scholar]
- 5.Brault JJ, Jespersen JG, Goldberg AL. Peroxisome proliferator-activated receptor-γ coactivator-1α or -1β overexpression inhibits muscle protein degradation, induction of ubiquitin ligases, and disuse atrophy. J Biol Chem 285: 19460–19471, 2010. [DOI] [PMC free article] [PubMed] [Google Scholar]
- 6.Briata P, Forcales SV, Ponassi M, Corte G, Chen CY, Karin M, Puri PL, Gherzi R. p38-dependent phosphorylation of the mRNA decay-promoting factor KSRP controls the stability of select myogenic transcripts. Mol Cell 20: 891–903, 2005. [DOI] [PubMed] [Google Scholar]
- 7.Chen CY, Shyu AB. AU-rich elements: characterization and importance in mRNA degradation. Trends Biochem Sci 20: 465–470, 1995. [DOI] [PubMed] [Google Scholar]
- 8.Cogswell AM, Stevens RJ, Hood DA. Properties of skeletal muscle mitochondria isolated from subsarcolemmal and intermyofibrillar regions. Am J Physiol Cell Physiol 264: C383–C389, 1993. [DOI] [PubMed] [Google Scholar]
- 9.Connor MK, Takahashi M, Hood DA. Tissue-specific stability of nuclear and mitochondrially encoded mRNAs. Arch Biochem Biophys 333: 103–108, 1996. [DOI] [PubMed] [Google Scholar]
- 10.Csibi A, Leibovitch MP, Cornille K, Tintignac LA, Leibovitch SA. MAFbx/atrogin-1 controls the activity of the initiation factor eIF3-f in skeletal muscle atrophy by targeting multiple C-terminal lysines. J Biol Chem 284: 4413–4421, 2009. [DOI] [PubMed] [Google Scholar]
- 11.D'souza D, Lai RY, Shuen M, Hood DA. mRNA stability as a function of striated muscle oxidative capacity. Am J Physiol Regul Integr Comp Physiol 303: R408–R417, 2012. [DOI] [PubMed] [Google Scholar]
- 12.Donà M, Sandri M, Rossini K, Dell'Aica I, Podhorska-Okolow M, Carraro U. Functional in vivo gene transfer into the myofibers of adult skeletal muscle. Biochem Biophys Res Commun 312: 1132–1138, 2003. [DOI] [PubMed] [Google Scholar]
- 13.Ekstrand MI, Falkenberg M, Rantanen A, Park CB, Gaspari M, Hultenby K, Rustin P, Gustafsson CM, Larsson NG. Mitochondrial transcription factor A regulates mtDNA copy number in mammals. Hum Mol Genet 13: 935–944, 2004. [DOI] [PubMed] [Google Scholar]
- 14.Falkenberg M, Larsson NG, Gustafsson CM. DNA replication and transcription in mammalian mitochondria. Annu Rev Biochem 76: 679–699, 2007. [DOI] [PubMed] [Google Scholar]
- 15.Figueroa A, Cuadrado A, Fan J, Atasoy U, Muscat GE, Muñoz-Canoves P, Muñoz A. Role of HuR in skeletal myogenesis through coordinate regulation of muscle differentiation genes. Mol Cell Biol 23: 4991–5004, 2003. [DOI] [PMC free article] [PubMed] [Google Scholar]
- 16.Finol HJ, Lewis DM, Owens R. The effects of denervation on contractile properties of rat skeletal muscle. J Physiol 319: 81–92, 1981. [DOI] [PMC free article] [PubMed] [Google Scholar]
- 17.Freyssenet D, Connor MK, Takahashi M, Hood DA. Cytochrome c transcriptional activation and mRNA stability during contractile activity in skeletal muscle. Am J Physiol Endocrinol Metab 277: E26–E32, 1999. [DOI] [PubMed] [Google Scholar]
- 18.Furuno K, Goodman M, Goldberg AL. Role of different proteolytic systems in the degradation of muscle proteins during denervation atrophy. J Biol Chem 265: 8550–8557, 1990. [PubMed] [Google Scholar]
- 19.Gherzi R, Lee KY, Briata P, Wegmüller D, Moroni C, Karin M, Chen CY. A KH domain RNA binding protein, KSRP, promotes ARE-directed mRNA turnover by recruiting the degradation machinery. Mol Cell 14: 571–583, 2004. [DOI] [PubMed] [Google Scholar]
- 20.Gordon JW, Rungi AA, Inagaki H, Hood DA. Effects of contractile activity on mitochondrial transcription factor A expression in skeletal muscle. J Appl Physiol 90: 389–396, 2001. [DOI] [PubMed] [Google Scholar]
- 21.Handschin C, Spiegelman BM. Peroxisome proliferator-activated receptor-γ coactivator 1 coactivators, energy homeostasis, and metabolism. Endocr Rev 27: 728–735, 2006. [DOI] [PubMed] [Google Scholar]
- 22.Hindi SM, Mishra V, Bhatnagar S, Tajrishi MM, Ogura Y, Yan Z, Burkly LC, Zheng TS, Kumar A. Regulatory circuitry of TWEAK-Fn14 system and PGC-1α in skeletal muscle atrophy program. FASEB J 28: 1398–1411, 2014. [DOI] [PMC free article] [PubMed] [Google Scholar]
- 23.Klemperer HG. Lowered proportion of polysomes and decreased amino acid incorporation from denervation muscle. FEBS Lett 28: 169–172, 1972. [DOI] [PubMed] [Google Scholar]
- 24.Koves TR, Noland RC, Bates AL, Henes ST, Muoio DM, Cortright RN. Subsarcolemmal and intermyofibrillar mitochondria play distinct roles in regulating skeletal muscle fatty acid metabolism. Am J Physiol Cell Physiol 288: C1074–C1082, 2005. [DOI] [PubMed] [Google Scholar]
- 25.Kukat C, Larsson NG. mtDNA makes a U-turn for the mitochondrial nucleoid. Trends Cell Biol 23: 457–463, 2013. [DOI] [PubMed] [Google Scholar]
- 26.Kukat C, Wurm CA, Spåhr H, Falkenberg M, Larsson NG. Super-resolution microscopy reveals that mammalian mitochondrial nucleoids have a uniform size and frequently contain a single copy of mtDNA. Proc Natl Acad Sci USA 108: 13534–13539, 2011. [DOI] [PMC free article] [PubMed] [Google Scholar]
- 27.Lagirand-Cantaloube J, Offner N, Csibi A, Leibovitch MP, Batonnet-Pichon S, Tintignac LA, Segura CT, Leibovitch SA. The initiation factor eIF3-f is a major target for atrogin1/MAFbx function in skeletal muscle atrophy. EMBO J 27: 1266–1276, 2008. [DOI] [PMC free article] [PubMed] [Google Scholar]
- 28.Lai RY, Ljubicic V, D'souza D, Hood DA. Effect of chronic contractile activity on mRNA stability in skeletal muscle. Am J Physiol Cell Physiol 299: C155–C163, 2010. [DOI] [PMC free article] [PubMed] [Google Scholar]
- 29.Lal A, Mazan-Mamczarz K, Kawai T, Yang X, Martindale JL, Gorospe M. Concurrent versus individual binding of HuR and AUF1 to common labile target mRNAs. EMBO J 23: 3092–3102, 2004. [DOI] [PMC free article] [PubMed] [Google Scholar]
- 30.Larsson NG, Wang J, Wilhelmsson H, Oldfors A, Rustin P, Lewandowski M, Barsh GS, Clayton DA. Mitochondrial transcription factor A is necessary for mtDNA maintenance and embryogenesis in mice. Nature 18: 231–236, 1998. [DOI] [PubMed] [Google Scholar]
- 31.Lee JE, Lee JY, Wilusz J, Tian B, Wilusz CJ. Systematic analysis of cis-elements in unstable mRNAs demonstrates that CUGBP1 is a key regulator of mRNA decay in muscle cells. PLos One 5: e11201, 2010. [DOI] [PMC free article] [PubMed] [Google Scholar]
- 32.Lehman JJ, Barger PM, Kovacs A, Saffitz JE, Medeiros DM, Kelly DP. Peroxisome proliferator-activated receptor-γ coactivator-1 promotes cardiac mitochondrial biogenesis. J Clin Invest 106: 847–856, 2000. [DOI] [PMC free article] [PubMed] [Google Scholar]
- 33.Machida M, Takeda K, Yokono H, Ikemune S, Taniguchi Y, Kiyosawa H, Takemasa T. Reduction of ribosome biogenesis with activation of the mTOR pathway in denervated atrophic muscle. J Cell Physiol 227: 1569–1576, 2012. [DOI] [PubMed] [Google Scholar]
- 34.Maniura-Weber K, Goffart S, Garstka HL, Montoya J, Wiesner RJ. Transient overexpression of mitochondrial transcription factor A (TFAM) is sufficient to stimulate mitochondrial DNA transcription, but not sufficient to increase mtDNA copy number in cultured cells. Nucleic Acids Res 32: 6015–6027, 2004. [DOI] [PMC free article] [PubMed] [Google Scholar]
- 35.Metafora S, Felsani A, Cotrufo R, Tajana GF, Di Iorio G, Del Rio A, De Prisco PP, Esposito V. Neural control of gene expression in the skeletal muscle fibre: the nature of the lesion in the muscular protein-synthesizing machinery following denervation. Proc R Soc Lond Ser B Biol Sci 209: 239–255, 1980. [DOI] [PubMed] [Google Scholar]
- 36.Moraes KC, Wilusz CJ, Wilusz J. CUG-BP binds to RNA substrates and recruits PARN deadenylase. RNA 12: 1084–1091, 2006. [DOI] [PMC free article] [PubMed] [Google Scholar]
- 37.Ngo HB, Kaiser JT, Chan DC. The mitochondrial transcription and packaging factor Tfam imposes a U-turn on mitochondrial DNA. Nat Struct Mol Biol 18: 1290–1296, 2011. [DOI] [PMC free article] [PubMed] [Google Scholar]
- 38.O'Leary MF, Hood DA. Effect of prior chronic contractile activity on mitochondrial function and apoptotic protein expression in denervated muscle. J Appl Physiol 105: 114–120, 2008. [DOI] [PubMed] [Google Scholar]
- 39.O'Leary MF, Hood DA. Denervation-induced oxidative stress and autophagy signaling in muscle. Autophagy 5: 230–231, 2009. [DOI] [PubMed] [Google Scholar]
- 40.O'Leary MF, Vainshtein A, Carter HN, Zhang Y, Hood DA. Denervation-induced mitochondrial dysfunction and autophagy in skeletal muscle of apoptosis-deficient animals. Am J Physiol Cell Physiol 303: C447–C454, 2012. [DOI] [PubMed] [Google Scholar]
- 41.Peng SS, Chen CY, Xu N, Shyu AB. RNA stabilization by the AU-rich element binding protein, HuR, an ELAV protein. EMBO J 17: 3461–3470, 1998. [DOI] [PMC free article] [PubMed] [Google Scholar]
- 42.Rattenbacher B, Beisang D, Wiesner DL, Jeschke JC, von Hohenberg M, St Louis-Vlasova IA, Bohjanen PR. Analysis of CUGBP1 targets identifies GU-repeat sequences that mediate rapid mRNA decay. Mol Cell Biol 30: 3970–3980, 2010. [DOI] [PMC free article] [PubMed] [Google Scholar]
- 43.Rubio-Cosials A, Sidow JF, Jiménez-Menéndez N, Fernández-Millán P, Montoya J, Jacobs HT, Coll M, Bernadó P, Solà M. Human mitochondrial transcription factor A induces a U-turn structure in the light strand promoter. Nat Struct Mol Biol 18: 1281–1289, 2011. [DOI] [PubMed] [Google Scholar]
- 44.Sacheck JM, Hyatt JP, Raffaello A, Jagoe RT, Roy RR, Edgerton VR, Lecker SH, Goldberg AL. Rapid disuse and denervation atrophy involve transcriptional changes similar to those of muscle wasting during systemic diseases. FASEB J 21: 140–155, 2007. [DOI] [PubMed] [Google Scholar]
- 45.Sandri M, Lin J, Handschin C, Yang W, Arany ZP, Lecker SH, Goldberg AL, Spiegelman BM. PGC-1α protects skeletal muscle from atrophy by suppressing FoxO3 action and atrophy-specific gene transcription. Proc Natl Acad Sci USA 103: 16260–16265, 2006. [DOI] [PMC free article] [PubMed] [Google Scholar]
- 46.Scarpulla RC. Transcriptional paradigms in mammalian mitochondrial biogenesis and function. Physiol Rev 88: 611–638, 2008. [DOI] [PubMed] [Google Scholar]
- 47.Shi Y, Dierckx A, Wanrooij PH, Wanrooij S, Larsson NG, Wilhelmsson LM, Falkenberg M, Gustafsson CM. Mammalian transcription factor A is a core component of the mitochondrial transcription machinery. Proc Natl Acad Sci USA 109: 16510–16515, 2012. [DOI] [PMC free article] [PubMed] [Google Scholar]
- 48.Singh K, Hood DA. Effect of denervation-induced muscle disuse on mitochondrial protein import. Am J Physiol Cell Physiol 300: C138–C145, 2011. [DOI] [PubMed] [Google Scholar]
- 49.Taylor AB, Smith BS, Kitada S, Kojima K, Miyaura H, Otwinowski Z, Ito A, Deisenhofer J. Crystal structures of mitochondrial processing peptidase reveal the mode for specific cleavage of import signal sequences. Structure 9: 615–625, 2001. [DOI] [PubMed] [Google Scholar]
- 50.Vainshtein A, Desjardins EM, Armani A, Sandri M, Hood DA. PGC-1α modulates denervation-induced mitophagy in skeletal muscle. Skelet Muscle 5: 1–17, 2015. [DOI] [PMC free article] [PubMed] [Google Scholar]
- 51.Virbasius JV, Scarpulla RC. Activation of the human mitochondrial transcription factor A gene by nuclear respiratory factors: a potential regulatory link between nuclear and mitochondrial gene expression in organelle biogenesis. Proc Natl Acad Sci USA 91: 1309–1313, 1994. [DOI] [PMC free article] [PubMed] [Google Scholar]
- 52.Vlasova IA, Tahoe NM, Fan D, Larsson O, Rattenbacher B, Sternjohn JR, Vasdewani J, Karypis G, Reilly CS, Bitterman PB, Bohjanen PR. Conserved GU-rich elements mediate mRNA decay by binding to CUG-binding protein 1. Mol Cell 29: 263–270, 2008. [DOI] [PMC free article] [PubMed] [Google Scholar]
- 53.Wagatsuma A, Kotake N, Mabuchi K, Yamada S. Expression of nuclear-encoded genes involved in mitochondrial biogenesis and dynamics in experimentally denervated muscle. J Physiol Biochem 67: 359–370, 2011. [DOI] [PubMed] [Google Scholar]
- 54.Wicks KL, Hood DA. Mitochondrial adaptations in denervated muscle: relationship to muscle performance. Am J Physiol Cell Physiol 260: C841–C850, 1991. [DOI] [PubMed] [Google Scholar]
- 55.Wredenberg A, Wibom R, Wilhelmsson H, Graff C, Wiener HH, Burden SJ, Oldfors A, Westerblad H, Larsson NG. Increased mitochondrial mass in mitochondrial myopathy mice. Proc Natl Acad Sci USA 99: 15066–15071, 2002. [DOI] [PMC free article] [PubMed] [Google Scholar]
- 56.Wu Z, Puigserver P, Andersson U, Zhang C, Adelmant G, Mootha V, Troy A, Cinti S, Lowell B, Scarpulla RC, Spiegelman BM. Mechanisms controlling mitochondrial biogenesis and respiration through the thermogenic coactivator PGC-1. Cell 98: 115–124, 1999. [DOI] [PubMed] [Google Scholar]
- 57.Yakubovskaya E, Guja KE, Eng ET, Choi WS, Mejia E, Beglov D, Lukin M, Kozakov D, Garcia-Diaz M. Organization of the human mitochondrial transcription initiation complex. Nucleic Acids Res 42: 4100–4112, 2014. [DOI] [PMC free article] [PubMed] [Google Scholar]
- 58.Zhao J, Brault JJ, Schild A, Cao P, Sandri M, Schiaffino S, Lecker SH, Goldberg AL. FoxO3 coordinately activates protein degradation by the autophagic/lysosomal and proteasomal pathways in atrophying muscle cells. Cell Metab 6: 472–483, 2007. [DOI] [PubMed] [Google Scholar]