Abstract
Hepatitis B is a worldwide infectious disease caused by hepatitis B virus (HBV), it leaded to millions of deaths every year, HBV mainly through immune response to damage liver cells. The purpose of this study was to judge the value of Regulatory T cells (Treg) and IL-17+ T helper cells (Th17) in different chronic HBV infection stages. 96 patients with chronic HBV infection were enrolled and selected 33 healthy adults as control. Detected the expression of Treg and Th17 cells in peripheral blood by flow cytometry and assayed liver function simultaneously. Compared to the control group, the expression of Treg (6.80±1.92 vs. 4.42±0.97; P<0.0001) and Th17 (6.15±4.20 vs. 2.66±1.79; P<0.0001) cells were both increased and the ratio of Treg/Th17 was significantly decreased (1.48±0.89 vs. 2.29±1.31; P=0.0001) in patients with HBV infection. Spearman correlation analysis demonstrated that the level of Treg and Th17 cells were associated with liver function. ROC curve analysis found that Treg and Th17 cells were suitable for as a screening test for early detection of the disease. In conclusion, the expression of Treg and Th17 cells were increased in chronic hepatitis B patients and these indicators were independent risk factors to hepatitis.
Keywords: Treg, Th17, hepatitis B, cirrhosis, hepatocellular carcinoma
Introduction
Hepatitis B is a worldwide infectious diseases caused by hepatitis B virus (HBV), it can develop to cirrhosis and hepatocellular carcinoma (HCC). Generally, the chronic HBV infection course can be divided into chronic hepatitis B (CHB), hepatitis B-associated liver cirrhosis (HBV-LC) and hepatitis B-associated hepatocellular carcinoma (HBV-HCC), thus leaded to millions of deaths every year. In 2006, the hepatitis B surface antigen (HBsAg) carrier rate was 0.96% among children under 5 years of age and estimated 84 million HBV carriers in china [1]. Previous studies showed that HBV replication in liver cells mainly through immune response to damage liver cells [2,3]. HBV infection could induce cellular and humoral immune response, cause autoimmune response and immune dysfunction, unbalance the ratio of T helper cells [4-6] and produce autoantibodies [7-10]. In recent years, regulatory T (Treg) cells and IL-17+ T helper (Th17) cells played an important role in autoimmune diseases and many studies proved that the expression of Treg and Th17 cells were changed in the patients with CHB, HBV-LC or HBV-HCC [11-13], but the systematic study of the change in different stages of chronic HBV infection were lacked.
Therefore, we studied the expression of Treg and Th17 cells at different stages of chronic HBV infection, the purpose of this study was to determine whether the expression of Treg and Th17 cells or the balance of Treg/Th17 were changed in different chronic HBV infection stages and to judge the value of these indicators.
Materials and methods
Subjects
Ninety-six patients of chronic HBV infection (HBV group), median age was 48.27 years (rang: 23-72 y) with 74 males (77.1%) and 22 females (22.9%), including 43 patients of CHB (CHB group), 29 patients of HBV-LC (HBV-LC group), 24 patients of HBV-HCC (HBV-HCC group) were enrolled in this study. The diagnosis was based on the guidelines for chronic hepatitis B diagnosis of the American Association for the Study of Liver Diseases (AASLD) [14]. Thirty-three healthy individuals were enrolled as normal controls (Control group) shown as Table 1. Additional inclusion criteria included no treatment with nucleic acid analogues or α-IFN within 3 years prior to study initiation. Subjects with hepatitis C virus, hepatitis D virus or human immunodeficiency virus were excluded from the study. The study protocol was approved and monitored by the ethics committee of Nanjing Jiangbei Peoples’ Hospital, and written informed consent was obtained from the patients.
Table 1.
Summary of the characteristics of study participants
| HBV group | Control group | P value | |
|---|---|---|---|
| Gender, No. | 96 | 33 | |
| Male | 74 | 23 | |
| Female | 22 | 10 | |
| Age, y (mean±SD) | 48.3±15 | 43.5±13.1 | 0.11 |
Chronic hepatitis B virus infection (HBV).
Flow cytometric analysis
HU FOXP3 STANG KIT and HU TH1/17 PHNOTYP KIT were purchased from BD PharMingen (San Diego, CA). Whole blood from each patient at admission was collected in heparin anticoagulated vacutainer tube. Samples were stained and fixed within the day of collection. For test Treg cells, whole blood samples (200 µL) were first stained with CD4 FITC, CD25 APC in dark for 30 min, Then FOXP3 PE was added for 30 min. For detect Th-17 cells, whole blood samples (200 µL) were activated with phorbol-12-myristate 13-acetate (PMA; 50 ng/ml) and ionomycin (1 mg/ml) for 4 h. After using BD cytofix and perm in dark for 30 min,then mixed in Th1/Th17 Phenotyping Cocktail for 30 min. All specimens were tested on the Flow Cytometry within 3 h. Three-color flow cytometric analyses were performed using FACSCalibur and CellQuest software (Becton Dickinson, San Jose, CA).
Statistical analysis
Results were reported as means±SD for percentages. Statistical comparisons between two groups used independent samples T-test. The one-way ANOVA and Scheff method were used for multiple comparisons. Spearman correlation analysis was used to evaluate relationships between two variables. Data analysis was done by using SPSS version 13.0 for Windows and MedCal statistical software (ver. 12. 4. 0. 0), Confidence interval was 95%.
Results
Expression of Treg cells significantly increased in HBV group
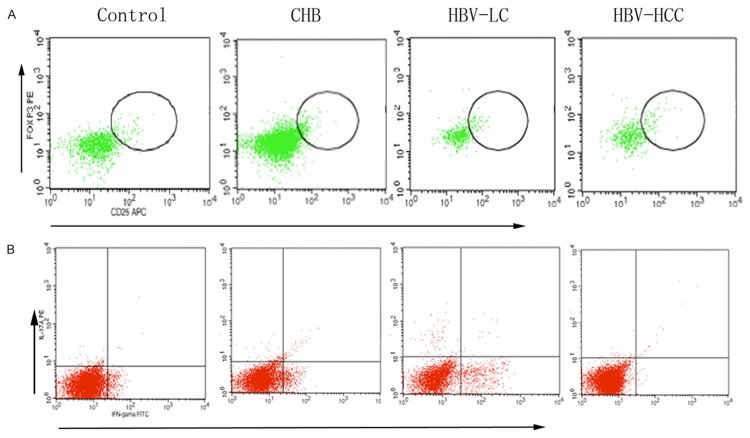
We defined the Treg cells as the population of CD4+CD25+FoxP3+T cells taken the percentage of total CD4+T cells (Figure 1A). Compared to control group, the expression of Treg cells were significantly increased in HBV group (96 vs. 33; 6.80±1.92 vs. 4.42±0.97; P<0.0001; Figure 2A). Then we analyzed the data in different HBV infection stages, found there were significant differences between control and each HBV infection subgroups (P<0.0001, Figure 2B), but there was no difference between CHB, HBV-LC and HBV-HCC groups.
Figure 1.
Representative dot plots of FoxP3 and IL-17A. A. Representative dot plots of FoxP3 expression in peripheral CD4+T cells of Controls, CHB, HBV-LV, HBV-HCC. B. Representative dot plots of IL-17A a expression in peripheral CD4+T cells of Controls, CHB, HBV-LV, HBV-HCC. Chronic hepatitis B virus infection (HBV), chronic hepatitis B (CHB), hepatitis B-associated liver cirrhosis (HBV-LC), hepatitis B-associated hepatocellular carcinoma (HBV-HCC), regulatory T cells (Treg), IL-17+ T helper cells (Th17).
Figure 2.
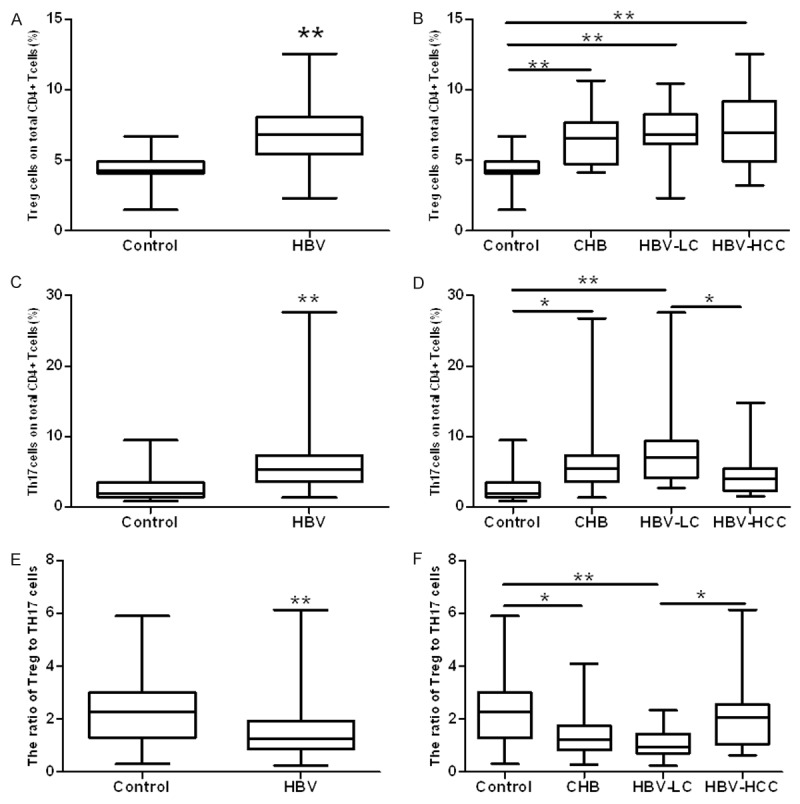
Results with Treg, Th17and Treg/Th17 ratio between chronic HBV infection patients and controls. Compared with Control, Treg, Th17 and Treg/Th17 were all increased significantly (A, C, E). When to subgroups, Treg was increased in all chronic HBV infection groups (B), Th17 and Treg/Th17 were changed significantly in CHB and HBV-LC groups (D, F) (*P<0.005,** P<0.001).
The frequency of Th17 cells significantly increased in HBV group
We next defined the Th17 cells as the population of CD4+IL-17A+T cells taken the percentage of total CD4+T cells (Figure 1B). Similar to Treg cells, the frequency of Th17 cells in HBV group was more higher than in control group (96 vs. 33; 6.15±4.20 vs. 2.66±1.79; P<0.0001; Figure 2C). Subgroup analysis showed that with the development of HBV infection, there were significant differences between the groups (P<0.0001, Figure 2D). But compared to healthy individuals, the expression of Th17 only significant increased in CHB and HBV-LC groups.
Treg/Th17 decreased in HBV group
To reveal whether there was an imbalance between Treg and Th17 cells, we analyzed the ratio of Treg/Th17 and confirmed that compared to control group, Treg/Th17 was decreased in HBV group (96 vs. 33; 1.48±0.89 vs. 2.29±1.31; P=0.0001; Figure 2E), and showed significant differences between the different HBV infection stages (P<0.0001; Figure 2F), similar to expression of Th17 cell, Treg/Th17 in CHB and HBV-LC groups expressed more lower than in control group.
Treg and Th17 cells had positive linear correlation in HBV group
We used spearman correlation analysis to evaluate the relationship between Treg and Th17 cells (Table 2) and found there was positive linear correlation in HBV (R=0.33; P=0.0012; Figure 3A) and CHB (R=0.39; P=0.0102; Figure 3B) groups, and there were no linear correlation in HBV-LC (R=0.27; P=0.1795; Figure 3C) and HBV-HCC (R=0.35; P=0.0985; Figure 3D) groups.
Table 2.
Results of spearman correlation analysis for Treg to Th17
Chronic hepatitis B (CHB), hepatitis B-associated liver cirrhosis (HBV-LC), hepatitis B-associated hepatocellular carcinoma (HBV-HCC), regulatory T cells (Treg), IL-17+ T helper cells (Th17).
P<0.005;
P<0.001.
Figure 3.
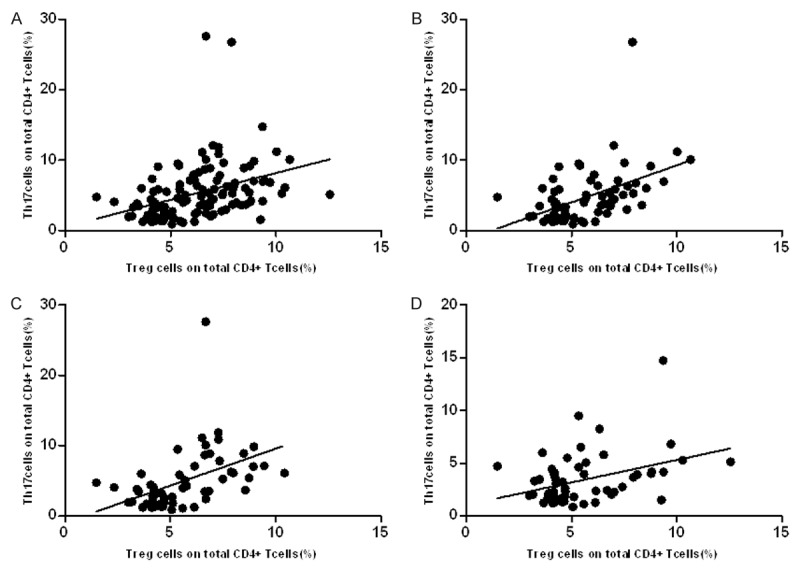
Relationship between Treg, Th17 and Treg/Th17 in chronic HBV infection patients. Spearman correlation analysis showed there were significant positive linear correlations between Treg ang Th17 cells in HBV group (A) and CHB group (B), HBV-LC and HBV-HCC groups (C, D) also showed positive linear correlations but without significant different.
The relationship between Treg cells, Th17 cells, Treg/Th17 and liver inflammation indicators
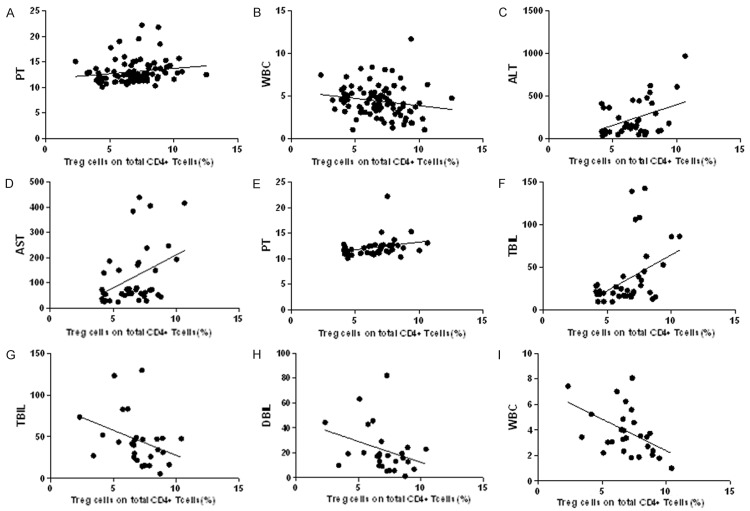
We selected ALT (alanine aminotransferase), AST (aspartate aminotransferase), PT (prothrombin time), TBIL (total bilirubin), DBIL (direct bilirubin), ALB (albumin), WBC (white blood cell) and HBV-DNA as the biochemical indicators of liver inflammation, and used spearman correlation analysis to evaluate relationships between liver inflammation and Treg or Th17 cells (Table 3). The results revealed that there were significantly correlation between Treg cells and PT (R=0.23; P=0.0217; Figure 4A), WBC (R=-0.27; P=0.0088; Figure 4B) in HBV group, Treg cells and ALT (R=0.32; P=0.0347; Figure 4C), AST (R=0.32; P=0.0376; Figure 4D), PT (R=0.34; P=0.0265; Figure 4E) and TBIL (R=0.32; P=0.0341; Figure 4F) in CHB group, Treg cells and TBIL (R=-0.43; P=0.0194; Figure 4G), DBIL (R=-0.41; P=0.0276; Figure 4H), WBC (R=-0.43; P=0.0197; Figure 4I) in HBV-LC group.
Table 3.
Results of spearman correlation analysis for Treg, Th17 and Treg/Th17 to liver inflammation indicators
| Th17 | Treg | Treg/Th17 | ||||||
|---|---|---|---|---|---|---|---|---|
|
|
||||||||
| Group | Mean±SD | r | p-value | r | p-value | r | p-value | |
| HBV | ALT (U/L) | 131.2±167.64 | 0.08 | 0.4630 | 0.02 | 0.8297 | -0.06 | 0.5903 |
| AST (U/L) | 99.58±133.02 | 0.00 | 0.9729 | 0.15 | 0.1501 | 0.08 | 0.4481 | |
| PT (s) | 13.06±2.24 | 0.09 | 0.3622 | 0.23 | 0.0217* | -0.01 | 0.8908 | |
| TB (μmol/L) | 48.02±71.36 | 0.15 | 0.1586 | 0.17 | 0.1018 | -0.08 | 0.4562 | |
| DB (μmol/L) | 23.34±43.26 | 0.11 | 0.2677 | 0.17 | 0.1034 | -0.05 | 0.5955 | |
| WBC (*109/L) | 4.40±1.79 | -0.05 | 0.6246 | -0.27 | 0.0088** | -0.07 | 0.5236 | |
| ALB (g/L) | 37.74±7.3 | 0.02 | 0.8406 | -0.10 | 0.3485 | -0.05 | 0.6347 | |
| HBV-DNA (Log10copies /ml) | 3.74±3.07 | 0.09 | 0.3964 | 0.01 | 0.8903 | -0.06 | 0.5679 | |
| CHB | ALT (U/L) | 230.49±207.5 | 0.23 | 0.1417 | 0.32 | 0.0347* | 0.23 | 0.3998 |
| AST (U/L) | 120.70±119.4 | 0.06 | 0.6907 | 0.32 | 0.0376* | 0.06 | 0.6551 | |
| PT (s) | 12.21±1.9 | 0.25 | 0.1129 | 0.34 | 0.0265* | 0.25 | 0.5627 | |
| TB (μmol/L) | 35.52±33.85 | 0.18 | 0.2549 | 0.32 | 0.0341* | 0.18 | 0.8626 | |
| DB (μmol/L) | 18.48±22.06 | 0.20 | 0.1941 | 0.28 | 0.0730 | -0.10 | 0.5351 | |
| WBC (*109/L) | 4.73±1.21 | -0.02 | 0.8967 | -0.13 | 0.3905 | -0.02 | 0.9551 | |
| ALB (g/L) | 42.23±5.8 | 0.01 | 0.9272 | -0.15 | 0.3296 | 0.01 | 0.5282 | |
| HBV-DNA (Log10 copies/ml) | 5.09±2.78 | -0.03 | 0.8655 | -0.01 | 0.9515 | 0.04 | 0.8065 | |
| HBV-LC | ALT (U/L) | 43.03±35.65 | 0.09 | 0.6352 | -0.08 | 0.6841 | -0.20 | 0.2954 |
| AST (U/L) | 52.24±35.21 | -0.04 | 0.8527 | -0.16 | 0.3989 | -0.10 | 0.5589 | |
| PT (s) | 14.16±2.35 | -0.08 | 0.6690 | -0.13 | 0.5145 | 0.02 | 0.9332 | |
| TB (μmol/L) | 46.15±30.34 | -0.15 | 0.4258 | -0.43 | 0.0194* | -0.02 | 0.9312 | |
| DB (μmol/L) | 22.56±18.68 | -0.17 | 0.3765 | -0.41 | 0.0276* | 0.00 | 0.9899 | |
| WBC (*109/L) | 3.90±1.87 | -0.11 | 0.5531 | -0.43 | 0.0197* | -0.15 | 0.4288 | |
| ALB (g/L) | 33.04±6.9 | 0.03 | 0.8719 | 0.00 | 0.9980 | -0.07 | 0.7364 | |
| HBV-DNA (Log10 copies/ml) | 2.88±2.73 | 0.16 | 0.4497 | 0.28 | 0.1625 | -0.13 | 0.5353 | |
| HBV-HCC | ALT (U/L) | 60.00±48.75 | 0.17 | 0.4407 | 0.13 | 0.5577 | -0.02 | 0.9195 |
| AST (U/L) | 118.9±203.69 | 0.10 | 0.6420 | 0.29 | 0.1633 | 0.12 | 0.5737 | |
| PT (s) | 13.24±2.13 | 0.01 | 0.9742 | 0.17 | 0.4237 | 0.08 | 0.7036 | |
| TB (μmol/L) | 72.67±129.96 | 0.33 | 0.1118 | 0.25 | 0.2481 | -0.28 | 0.1865 | |
| DB (μmol/L) | 32.97±79.22 | 0.13 | 0.5572 | 0.27 | 0.2073 | -0.05 | 0.8338 | |
| WBC (*109/L) | 4.43±2.42 | 0.05 | 0.8150 | -0.17 | 0.4355 | -0.05 | 0.8181 | |
| ALB (g/L) | 35.36±5.44 | 0.15 | 0.4714 | 0.14 | 0.5114 | -0.04 | 0.8670 | |
| HBV-DNA (Log10 copies/ml) | 1.95±2.87 | -0.19 | 0.4113 | -0.05 | 0.8358 | 0.30 | 0.2034 | |
Alanine aminotransferase (ALT), aspartate aminotransferase (AST), prothrombin time (PT), total bilirubin (TBIL), direct bilirubin (DBIL), albumin (ALB), white blood cell (WBC).
P<0.005;
P<0.001.
Figure 4.
Relationship between Treg and liver inflammation indicators in chronic HBV infection patients. Result of spearman correlation analysis showed there were significant linear correlations between Treg and PT, WBC in HBV group (A, B), ALT, AST, PT and TBIL in CHB group (C-F), TBIL, DBIL and WBC in HBV-LC group (G-I) alanine aminotransferase (ALT), aspartate aminotransferase (AST), prothrombin time (PT), total bilirubin (TBIL), direct bilirubin (DBIL), white blood cell (WBC).
Analysis of Treg cells, Th17 cells and Treg/Th17 as chronic HBV infection-specific markers
To examine the selectivity of the blood markers Treg cells, Th17 cells and Treg/Th17 for chronic HBV infection, the data were subjected to ROC curve analysis, and the results were shown in Table 4. As is understood from the data of Figure 5 and Table 4, the AUC (area under curve) value of serum Treg and Th17 cells levels were all above 0.75 in the HBV, CHB, HBV-LC and HBV-HCC groups with the Th17 cells sensitivity detected at most more than 80% and specificity more than 75% respectively, Treg cells sensitivity detected at most less than 75% and specificity more than 90% respectively,. In addition, when the serum Treg/Th17 level was measured, the AUC value most less than 0.75 in all groups, with the specificity detected at most less than 55% respectively, in all cases, indicated that Treg and Th17 cells were more suitable than Treg/Th17 as chronic HBV infection-specific markers.
Table 4.
Result of ROC analysis of Treg, Th17 and Treg/Th17
| Th17 | Treg | Treg/Th17 | ||||||||||
|---|---|---|---|---|---|---|---|---|---|---|---|---|
|
|
||||||||||||
| Group | AUC | Sensitivity (%) | Specificity (%) | Criterion (%) | AUC | Sensitivity (%) | Specificity (%) | Criterion (%) | AUC | Sensitivity (%) | Specificity (%) | Criterion (%) |
| HBV | 0.84±0.035 | 80.2 | 75.8 | >3.45 | 0.857±0.033 | 71.9 | 93.9 | >5.7 | 0.703±0.056 | 88.5 | 45.5 | ≤2.45 |
| CHB | 0.839±0.045 | 81.4 | 75.8 | >3.45 | 0.854±0.043 | 67.4 | 93.9 | >5.7 | 0.72±0.06 | 76.7 | 60.6 | ≤1.75 |
| HBV-LC | 0.916±0.038 | 93.1 | 75.4 | >3.45 | 0.89±0.044 | 82.8 | 93.9 | >5.7 | 0.795±0.057 | 96.6 | 54.4 | ≤1.93 |
| HBV-HCC | 0.751±0.068 | 62.5 | 78.8 | >3.56 | 0.824±0.059 | 66.7 | 97 | >6.14 | 0.562±0.077 | 75 | 45.5 | ≤2.45 |
Figure 5.
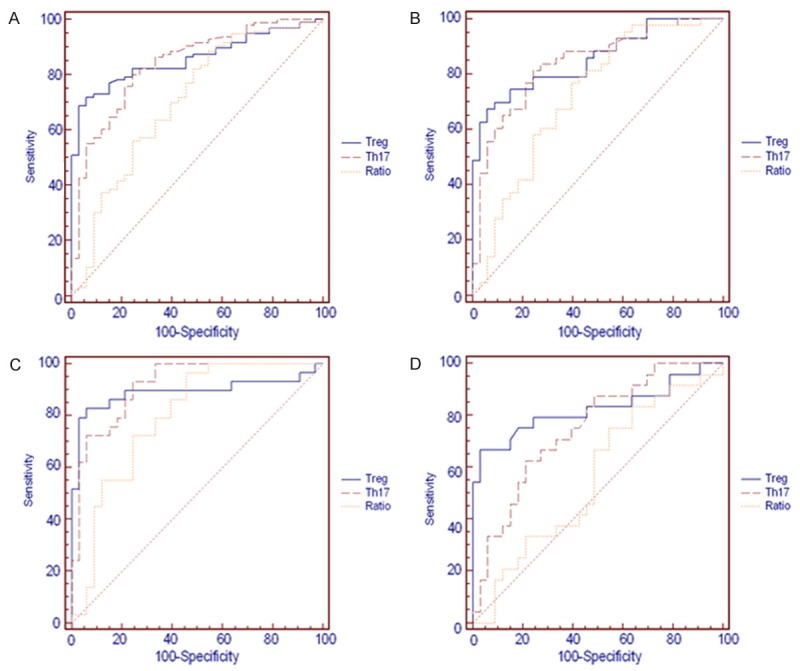
ROC curve analysis of Treg, Th17 and Treg/Th17 in chronic HBV infection patients. ROC curve analysis showed Treg and Th17 cells were significantly higher in all groups, but the AUC (area under curve) value of Treg/Th17 was less than 0.70 in HBV-HCC group.
Discussion
Chronic HBV infection could cause autoimmune reactions to injury the liver cells directly, or through mediate antibody-dependent cytotoxicity (ADCC) cause liver damage [15-19]. Increasing evidences have shown that immune-mediated liver damage plays an important role in chronic HBV infection. Bo Yang confirmed Th17 cells and serum IL-17 concentration were significantly higher in CHB and HBV related acute-on-chronic liver failure (ACLF) patients than in asymptomatic chronic HBV carriers (AsC) and control groups, and increased with immune inflammation aggravation from AsC, CHB to ACLF [20]. Zhu S found that levels of Treg and Th17 cells were positively correlated with the degree of inflammatory activity and liver pathology HAI score [21], all these results suggested that Treg and Th17 cells involved in the inflammation and liver cell immune clearance after HBV infection. In this study, we were detected the expression of Treg and Th17 cells in the peripheral blood of patients with chronic HBV infection, and found that compared to the control group, both Treg and Th17 cells increased significantly in the HBV group, it was similar to past studies. Further subgroup analysis revealed that Treg cells increased with disease progression. Similarly, level of Th17 cells also elevated in CHB and HBV-LC groups. We used spearman correlation analysis to evaluate relationships between Treg and Th17 cells and found there was positive linear correlation.
Since Treg and Th17 cells derived from the same original T cells, and has same cell differentiation signaling pathway with TGF-β essential for their differentiation [22,23], Th17 cells can increase the immune response by release inflammatory cytokines, and Treg cells can secrete immunosuppressive cytokines to suppress it, the imbalance between Treg/Th17 related to the occurrence of many diseases [24-29]. Xueping Yu found Treg and Th17 cells showed changes in genes, protein levels and T cell phenotypes during ACHBLF events. And the survival of ACHBLF patients was associated with the increased Treg/Th17 ratio [30]. Zhang JY discovered HBC patients taking entecavir antiviral therapy could significantly increase Treg/Th17 ratios [31]. In this study, we found that the imbalance of Treg to Th17 cells correlated with the progression of the disease. The ratio of Treg/Th17 in patients with chronic HBV infection was significantly decreased, which suggested that the Treg/Th17 balance modulated liver damage in chronic HBV infection. Or, on the other hand, Treg/Th17 imbalance may cause HBV infection to chronic. Subgroup analysis showed there also was significant difference between the groups. These data suggested that the interaction between Treg and Th17 cells was important to maintain the balance between the limited immune response and pathological damage. So, these indicators may be independent risk factors to hepatitis.
We also analyzed the relationship between the two types of T cells and chronic HBV infection progression. We found that in all patients, only Treg cells had correlated with PT and WBC levels significantly. In subgroups, we found that Treg cells had correlated with ALT, AST, TBIL and PT levels significantly in CHB group and had correlated with TBIL, DBIL and WBC levels significantly in HBV-LC group, but there were no relationships between Treg cells and ALB, HBV-DNA. Th17 cells and ratio of Treg/Th17 showed no significant relationship with liver inflammation markers either. These data suggested Treg and Th17 cells were independent with HBV replication. Spearman correlation analysis demonstrated that the level of Treg cells was shown to be significantly associated with the biochemical indicators of liver function, it could reflect the changes in liver function more effectively and had more worthy to be used as an independent evaluation.
The results of ROC curve analysis proved that Treg and Th17 cells were suitable for as screening tests for early detection of the disease owing to both high sensitivity and specificity, but the ratio of Treg/Th17 was not reliable especially due to the lack of specificity (45.5% for all stages, 45.5% for the HBV-HCC group).
In conclusion, this study showed that the Treg and Th17 cells were increased in chronic HBV infection patients and changed with the course of disease. While with the course of disease developed, expression of Treg and Th17 cells were increased, and appeared the imbalance between the Treg and Th17 cells. The level of changes may be served for determine the degree of liver damage.
The limited sample population and duration of follow-up in study precluded us from further refinement, as CHB including mild, moderate and severe CHB, HBV-LC including compensated and decompensate LC. Large-scale multicenter studies are needed to prove the further association of Treg and Th17 cells and chronic HBV infection.
Acknowledgements
The authors thank Fan Yang who provided liver function tests assistance. Grant Information: This work was supported by a project Funded by the project Funded by the Priority Academic Program Development of Jiangsu Higher Education Institutions (PAPD) (JX10231801) and the project supported by the Medical Technology Development of Nanjing (YKK11179, YKK14220).
Disclosure of conflict of interest
None.
References
- 1.Lu FM, Zhang H. Prevention of hepatitis B in china: achievement and challenges. Chin Med J (Engl) 2009;122:2925–7. [PubMed] [Google Scholar]
- 2.Suri D, Schilling R, Lopes AR, Mullerova I, Colucci G, Williams R, Naoumov NV. Non-cytolytic inhibition of hepatitis B virus replication in human hepatocytes. J Hepatol. 2001;35:790–797. doi: 10.1016/s0168-8278(01)00215-x. [DOI] [PubMed] [Google Scholar]
- 3.Jung MC, Pape GR. Immunology of hepatitis B infection. Lancet Infect Dis. 2002;2:43–50. doi: 10.1016/s1473-3099(01)00172-4. [DOI] [PubMed] [Google Scholar]
- 4.Han YP, Li J, Jiang LF, Xu QQ, Liu B, Dong L, Chen N, Kong LH, Xie FR, Huang ZH. Hepatitis B e antigen from chronic hepatitis B patients induces Th1/Th2 cytokine imbalance in vitro. Zhonghua Gan Zang Bing Za Zhi. 2013;21:584–9. doi: 10.3760/cma.j.issn.1007-3418.2013.08.006. [DOI] [PubMed] [Google Scholar]
- 5.Sominskaya I, Skrastina D, Petrovskis I, Dishlers A, Berza I, Mihailova M, Jansons J, Akopjana I, Stahovska I, Dreilina D, Ose V, Pumpens P. A VLP library of C-terminally truncated Hepatitis B core proteins: correlation of RNA encapsidation with a Th1/Th2 switch in the immune responses of mice. PLoS One. 2013;8:e75938. doi: 10.1371/journal.pone.0075938. [DOI] [PMC free article] [PubMed] [Google Scholar]
- 6.Dimitropoulou D, Karakantza M, Theodorou GL, Leonidou L, Assimakopoulos SF, Mouzaki A, Gogos CA. Serum cytokine profile in patients with hepatitis B e antigen-negative chronic active hepatitis B and inactive hepatitis B virus carriers. World J Gastrointest Pathophysiol. 2013;4:24–7. doi: 10.4291/wjgp.v4.i1.24. [DOI] [PMC free article] [PubMed] [Google Scholar]
- 7.Marcos M, Alvarez F, Brito-Zeron P, Bove A, Perez-De-Lis M, Diaz-Lagares C, Sanchez-Tapias JM, Ramos-Casals M. Chronic hepatitis B virus infection in Sjögren’s syndrome. Prevalence and clinical significance in 603 patients. Autoimmun Rev. 2009;8:616–20. doi: 10.1016/j.autrev.2009.02.007. [DOI] [PubMed] [Google Scholar]
- 8.Shantha S, Thyagarajan SP, Premavathy RK, Sukumar RG, Mohan KV, Palanisamy KR, Rajasambandam P. Correlation of autoimmune reactivity with hepatitis B and C virus (HBV and HCV) infection in histologically proven chronic liver diseases. Indian J Med Microbiol. 2002;20:12–5. [PubMed] [Google Scholar]
- 9.Kansu A, Kuloğlu Z, Demirçeken F, Girgin N. Autoantibodies in children with chronic hepatitis B infection and the influence of interferon alpha. Turk J Gastroenterol. 2004;15:213–8. [PubMed] [Google Scholar]
- 10.Huang Z, van Velkinburgh J, C Ni B, Wu Y. Pivotal roles of the interleukin-23/T helper 17 cell axis in hepatitis B. Liver Int. 2012;32:894–901. doi: 10.1111/j.1478-3231.2012.02764.x. [DOI] [PubMed] [Google Scholar]
- 11.Zhang Y, Cobleigh MA, Lian JQ, Huang CX, Booth CJ, Bai XF, Robek MD. A proinflammatory role for interleukin-22 in the immune response to hepatitis B virus. Gastroenterology. 2011;141:1897–906. doi: 10.1053/j.gastro.2011.06.051. [DOI] [PMC free article] [PubMed] [Google Scholar]
- 12.Ye Y, Xie X, Yu J, Zhou L, Xie H, Jiang G, Yu X, Zhang W, Wu J, Zheng S. Involvement of Th17 and Th1 effector responses in patients with Hepatitis B. J Clin Immunol. 2010;30:546–55. doi: 10.1007/s10875-010-9416-3. [DOI] [PubMed] [Google Scholar]
- 13.Xu D, Fu J, Jin L, Zhang H, Zhou C, Zou Z, Zhao JM, Zhang B, Shi M, Ding X, Tang Z, Fu YX, Wang FS. Circulating and liver resident CD4+CD25+regulatory T cells actively influence the antiviral immune response and disease progression in patients with hepatitis B. J Immunol. 2006;177:739–47. doi: 10.4049/jimmunol.177.1.739. [DOI] [PubMed] [Google Scholar]
- 14.Lok AS, McMahon BJ. Chronic hepatitis B: update. Hepatology. 2009;50:661–662. doi: 10.1002/hep.23190. [DOI] [PubMed] [Google Scholar]
- 15.Mokuda S, Doi O, Takasugi K. Simultaneous quantitative analysis of the expression of CD64 and CD35 on neutrophils as markers to differentiate between bacterial and viral infections in patients with rheumatoid arthritis. Mod Rheumatol. 2012;22:750–7. doi: 10.1007/s10165-011-0587-4. [DOI] [PubMed] [Google Scholar]
- 16.Colovic N, Jurisic V, Terzic T, Jevtovic D, Colovic M. Alveolar granulocytic sarcoma of the mandible in a patient with HIV. Onkologie. 2011;34:55–8. doi: 10.1159/000317351. [DOI] [PubMed] [Google Scholar]
- 17.Nuutila J. The novel applications of the quantitative analysis of neutrophil cell surface FcgammaRI (CD64) to the diagnosis of infectious and inflammatory diseases. Curr Opin Infect Dis. 2010;23:268–74. doi: 10.1097/QCO.0b013e32833939b0. [DOI] [PubMed] [Google Scholar]
- 18.Michalak TI, Lau JY, McFarlane BM, Alexander GJ, Eddleston AL, Williams R. Antibody-directed complement-mediated cytotoxicity to hepatocytes from patients with chronic hepatitis B. Clin Exp Immunol. 1995;100:227–32. doi: 10.1111/j.1365-2249.1995.tb03658.x. [DOI] [PMC free article] [PubMed] [Google Scholar]
- 19.Yu X, Guo R, Ming D, Su M, Lin C, Deng Y, Lin Z, Su Z. The ratios of Treg/Th17 and TGF-β1/IL-17 are associated with the development of HBV-associated liver cirrhosis. J Gastroenterol Hepatol. 2014;29:1065–1072. doi: 10.1111/jgh.12459. [DOI] [PubMed] [Google Scholar]
- 20.Yang B, Wang Y, Zhao C, Yan W, Che H, Shen C, Zhao M. Increased Th17 cells and interleukin-17 contribute to immune activation and disease aggravation in patients with chronic hepatitis B virus infection. Immunol Lett. 2013;149:41–9. doi: 10.1016/j.imlet.2012.12.001. [DOI] [PubMed] [Google Scholar]
- 21.Liang XS, Li CZ, Zhou Y, Wan MB. Changes of Treg and Th17 cells balance in the development of acute and chronic hepatitis B virus infection. BMC Gastroenterol. 2012;12:43. doi: 10.1186/1471-230X-12-43. [DOI] [PMC free article] [PubMed] [Google Scholar]
- 22.Korn T, Petermann F. Development and function of interleukin 17-producing gammadelta t cells. Ann N Y Acad Sci. 2012;1247:34–45. doi: 10.1111/j.1749-6632.2011.06355.x. [DOI] [PubMed] [Google Scholar]
- 23.Mills KH. Induction, function and regulation of IL-17-producing T cells. Eur J Immunol. 2008;38:2636–2649. doi: 10.1002/eji.200838535. [DOI] [PubMed] [Google Scholar]
- 24.Li J, Wang L, Wang S, Zhu H, Ye P, Xie A, Shen B, Liu C, Guo C, Fu Q, Zhang K, Xia J. The Treg/Th17 imbalance inpatients with idiopathic dilated cardiomyopathy. Scand JImmunol. 2010;71:298–303. doi: 10.1111/j.1365-3083.2010.02374.x. [DOI] [PubMed] [Google Scholar]
- 25.Li N, Bian H, Zhang J, Li X, Ji X, Zhang Y. The Th17/Treg imbalance exists in patients with heart failure with normal ejection fraction and heart failure with reduced ejection fraction. Clin Chim Acta. 2010;411:1963–1968. doi: 10.1016/j.cca.2010.08.013. [DOI] [PubMed] [Google Scholar]
- 26.Li J, Qiu SJ, She WM, Wang FP, Gao H, Li L, Tu CT, Wang JY, Shen XZ, Jiang W. Signifiance of the balance between regulatory T (Treg) and T helper 17 (Th17) cells during hepatitis B virus related liver firosis. PLoS One. 2012;7:e39307. doi: 10.1371/journal.pone.0039307. [DOI] [PMC free article] [PubMed] [Google Scholar]
- 27.Xu D, Fu J, Jin L, Zhang H, Zhou C, Zou Z, Zhao JM, Zhang B, Shi M, Ding X, Tang Z, Fu YX, Wang FS. Circulating and liver resident CD4+CD25+ regulatory T cells actively influencethe antiviral immune response and disease progression in patients with hepatitis B. J Immunol. 2006;177:739–747. doi: 10.4049/jimmunol.177.1.739. [DOI] [PubMed] [Google Scholar]
- 28.Zhang GL, Xie DY, Lin BL, Xie C, Ye YN, Peng L, Zhang SQ, Zhang YF, Lai Q, Zhu JY, Zhang Y, Huang YS, Hu ZX, Gao ZL. Imbalance of interleukin-17-producing CD4 T cells/regulatory T cells axis occurs in remission stage of patients with hepatitis B virus-related acute-on-chronic liver failure. J Gastroenterol Hepatol. 2013;28:513–21. doi: 10.1111/jgh.12082. [DOI] [PubMed] [Google Scholar]
- 29.Su ZJ, Yu XP, Guo RY, Ming DS, Huang LY, Su ML, Deng Y, Lin ZZ. Changes in the balance between Treg and Th17 cells in patients with chronic hepatitis B. Diagn Microbiol Infect Dis. 2013;76:437–44. doi: 10.1016/j.diagmicrobio.2013.04.026. [DOI] [PubMed] [Google Scholar]
- 30.Liang XS, Li CZ, Zhou Y, Yin W, Liu YY, Fan WH. Changes in circulating Foxp3+ regulatory T cells and interleukin-17-producing T helper cells during HBV-related acute-on-chronic liver failure. World J Gastroenterol. 2014;20:8558–8571. doi: 10.3748/wjg.v20.i26.8558. [DOI] [PMC free article] [PubMed] [Google Scholar]
- 31.Zhang JY, Song CH, Shi F, Zhang Z, Fu JL, Wang FS. Decreased ratio of Treg cells to Th17 cells correlates with HBV DNA suppression in chronic hepatitis B patients undergoing entecavir treatment. PLoS One. 2010;5:e13869. doi: 10.1371/journal.pone.0013869. [DOI] [PMC free article] [PubMed] [Google Scholar]


