Abstract
Food intake and digestion are vital functions, and their dysregulation is fundamental for many human diseases. Current methods do not support their dynamic quantification on large scales in unrestrained vertebrates. Here, we combine an infrared macroscope with fluorescently labeled food to quantify feeding behavior and intestinal nutrient metabolism with high temporal resolution, sensitivity, and throughput in naturally behaving zebrafish larvae. Using this method and rate-based modeling, we demonstrate that zebrafish larvae match nutrient intake to their bodily demand and that larvae adjust their digestion rate, according to the ingested meal size. Such adaptive feedback mechanisms make this model system amenable to identify potential chemical modulators. As proof of concept, we demonstrate that nicotine, l-lysine, ghrelin, and insulin have analogous impact on food intake as in mammals. Consequently, the method presented here will promote large-scale translational research of food intake and digestive function in a naturally behaving vertebrate.
Keywords: appetite, hunger, satiation, satiety, DiR' dye
food intake and digestion are key physiological processes that provide nutrients to drive all bodily functions. Nutrient intake is matched to nutritional needs by the brain—a process termed nutrient homeostasis—using an intertwined organism-wide array of extrinsic and intrinsic cues coding food availability and demand (2, 42). Dysfunction of feeding and digestive behavior is at the root of global health problems, such as obesity, malnutrition, and Type 2 diabetes, among many others, and, therefore, a deeper understanding of feeding and digestive behavior is of high importance (25).
Drugs or genetic manipulations that alter food intake or digestion are highly desirable remedies for food-related disorders. To screen for genes or small molecules with clinically desirable impact, the technology of choice needs to support the analyses of hundreds to thousands of individual animals. Until now, large-scale studies of feeding behavior have solely been feasible in small invertebrates such as Drosophila, but were constrained to 20–50 conditions in vertebrates, thereby making large-scale screens elusive (12, 17, 35). Technically, even more demanding than measuring food intake is the quantification of nutrient digestion, as there is no direct optical access to the gastrointestinal tract in most species. More specialized technologies, such as bioluminescence, MRI, or computed tomography, have been valuable to generate insights into in vivo dynamics of digestive function (10, 18, 19, 31). However, all of these methods require immobilization of the experimental subject to reduce motion artifacts, thereby making concurrent behavioral observations impossible. Consequently, quantifying the dynamics of food intake and its digestion with high throughput is a formidable technological challenge in any freely behaving animal.
Zebrafish (Danio rerio) larvae gained popularity as a vertebrate model system in biomedical research, because their genetic, anatomical, and physiological homology to mammals coupled with their small size (∼4 mm) and short generation time make them desirable for large-scale screening (28, 36). Most organs, including the digestive system, are already formed within 4 to 6 days postfertilization (dpf) (21, 30). At that age the larval yolk sac is depleted, and they start to depend on external food sources (13). One of their natural feeds are live paramecia, a unicellular protozoan, which they hunt with characteristic kinematic behaviors (5, 11, 39). Whether these complex prey capture maneuvers are simply triggered by a moving prey or actively regulated by a nutrient homeostatic state (i.e., hunger and satiation) is unknown. A strategy to track food intake and its digestion is to stain the food source with fluorescent-labeled macrospheres, phospholipids, or membrane dyes in these transparent vertebrates. In past efforts, researchers have implemented such strategies and generated key insights into digestive physiology (3, 9, 14, 15, 34). However, all of these were based on euthanized or anesthetized larvae, which makes dynamic measurements of intestinal food content difficult. Yet, nutrient homeostasis clearly depends not only on food intake but also on food digestion, absorption, and storage. Resolving this dynamic interaction is, therefore, essential to reveal fundamental aspects of food intake and intestinal nutrient metabolism.
The infrared macroscope presented here overcomes these limitations through three technological innovations. First, it enables high temporal resolution studies of the dynamics in intestinal fluorescent dye content in freely behaving animals. To facilitate the interpretation of these fluorescent traces, we developed analytical tools to extract separate metrics for intake and digestive rates, respectively. Second, it supports the concurrent observation of 96 individual zebrafish larvae. Third, it allows for the simultaneous measurement of fish kinematics using infrared light. We applied this infrared macroscope to demonstrate that zebrafish larvae actively regulate nutrient homeostasis and intestinal nutrient metabolism, even at a very young age and that anorectic and orexigenic compounds altered feeding behavior in fish in a similar way as they do in mammals. Overall, our infrared macroscope can quantify feeding and digestive behavior with high temporal resolution, sensitivity, and throughput in an unrestrained vertebrate.
MATERIALS AND METHODS
Animals.
Adult and larval zebrafish fish (Danio rerio) were maintained on a 14:10-h light-dark cycle at 28°C. Larvae were raised at a density of >1 ml/fish in blue water (pH 7.0 sodium-bicarbonate buffer, 1 g/l methylene blue, 0.3 ml/l instant ocean salt, exchanged daily). If not stated directly, fish from the mitfa−/− (nacre) strain were used in all experiments at 7 dpf (20). They lack body pigmentation and are, therefore, significantly more translucent than wild-type strains. To minimize clutch-specific effects, embryos of at least two independent clutches were pooled for experiments. All protocols and procedures involving zebrafish were approved by the Harvard University/Faculty of Arts and Sciences Standing Committee on the Use of Animals in Research and Teaching.
Infrared macroscope.
The infrared macroscope was assembled and aligned using standard structural framing and optomechanic components (Thorlabs, Newton, NJ) within a light-proof enclosure. The large behavioral platform was machined from clear acrylic and situated above an array of 280 infrared LEDs (940 nm; Pinecomputers, Burlington, VT). The platform was illuminated from above with one cool white light (LZ4, LED engine) and with eight far-red LEDs (740 nm, LZ4, LED engine) mounted behind a band-pass filter (ET710/75; Chroma, Irvine, CA). Images of the platform were captured with a CMOS camera (UI-3370CP-NIR, USB 3.0, 4MP-2048 × 2048, 12 bit, full well capacity 13′500 e−, quantum efficiency 43% at 800 nm; IDS, Cologne, Germany) protected with a long pass filter (ET 780lp; Chroma). A low F-number lens (EF 50 mm f/1.4; USM, Canon, Japan) was used to maximize emission light collection. Custom-written LabView code was used to control the illumination settings and image capture. The white light was always turned on to mimic daylight unless stated. The far-red light served as the excitation light source for fluorescent imaging and the LED array for transmitted macroscopy. For behavioral imaging, fluorescent images were captured every minute for 2 h with 100 ms of exposure time (except Fig. 4); and transmitted images were used to trace the swimming distance of all zebrafish larvae at a rate of 20 Hz in real time.
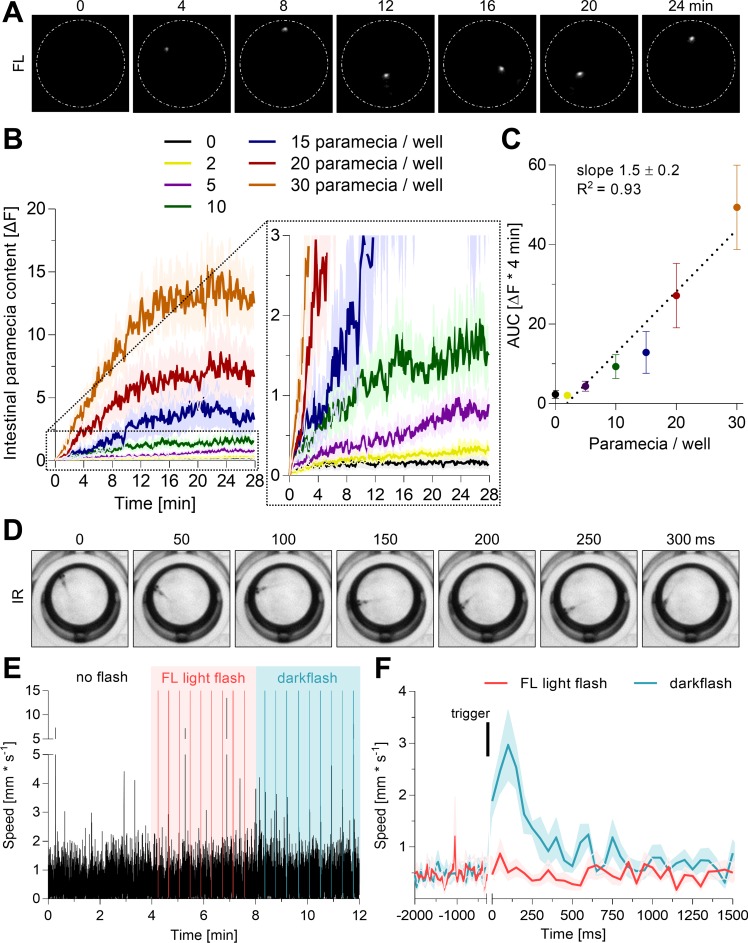
Fig. 4.
Monitoring feeding and kinematic behavior of freely swimming zebrafish larvae. A: example fluorescence recording of a 7-dpf zebrafish larvae offered 20 stained paramecia in a single well of a 96-well plate (white dashes, diameter 6.8 mm). B and C: individual zebrafish larvae (7 dpf) were fasted for 2 h prior to exposure to the indicated number of labeled paramecia to estimate the sensitivity of the macroscope. Fluorescence images were captured every 10 s for 28 min, and the fluorescence emission was quantified. The area under the curve (AUC) is plotted in C. Values are expressed as means ± SE; n = 36. D: raw image sequence of a 7-dpf zebrafish larva swimming in a 96-well plate well acquired by the CMOS camera during transmitted light mode. Machine vision enables detection of the zebrafish larvae and extraction of its center of mass as x-y coordinates. E and F: 96 individual zebrafish larvae (7 dpf) were exposed to no light flashes, then to repetitive FL light flashes, and finally to repetitive dark flashes (300 ms each) to test for the sensitivity of motion detection. The mean speed of all fish was plotted at a resolution of 20 Hz (E). The triggered average speed of all flashes is plotted in F. Bars represent flash timing. Values are expressed as means ± SE; n = 9.
Paramecia staining.
Paramecia cultures were grown under standard laboratory conditions. The culture media were filtered through a fine mesh (pore size ∼20 μm), which retained the paramecia and, thereby, enabled purification. Paramecia were collected into blue water, concentrated by centrifugation for 2 min at 1500 rcf, and stained with 0.5% (vol/vol) DiR′ dye (2.5 mg/ml, 1,1′-dioctadecyl-3,3,3′,3′-tetramethylindotricarbocyanine iodide, dissolved in DMSO; Molecular Probes, Eugene, OR) for 20 min. After staining, paramecia were centrifuged as above and washed and suspended in the desired volume. This protocol was followed throughout the study. The amount of DiR′ dye varied for Fig. 2 only. Paramecia were quantified by two distinct methods: 1) exact quantification (for Fig. 4, B and C) was performed manually by aspirating single paramecia into a pipette under a dissecting macroscope and placing them into single wells and 2) approximate paramecia numbers were measured by optical density (OD, 490 nm). OD (x) correlates linearly with paramecia number (y × 103/ml) as follows: y = 37 × − 2, R2 = 0.81. The paramecia number per milliliter for this correlation was determined at different ODs using a hemocytometer. For direct imaging purposes, paramecia were heat-fixed by placing 40 μl of a defined paramecia culture onto a 90°C preheated 25 × 75 mm macroscope glass slide (VWR, Radnor, PA) for 5 min. Subsequently paramecia were imaged with the infrared macroscope using 100-ms exposure time and/or a Zeiss SteREO Discovery V12 microscope (AchromatS 1 × FWD 60-mm objective, AxioCam HRC camera).
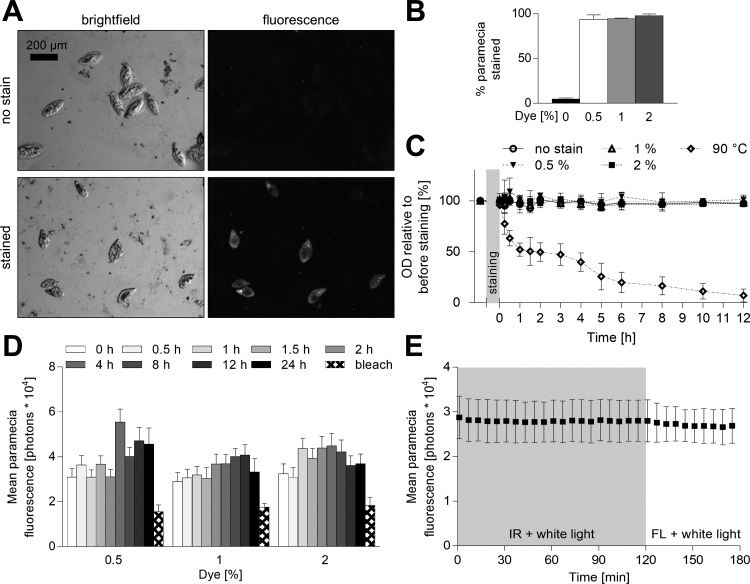
Fig. 2.
Characteristics of the infrared labeled paramecia. A and B: a standardized number of paramecia were stained with different doses of DiR′ dye and heat-fixed, and fluorescence and brightfield images were captured with a conventional microscope (see representative images in A). Cell number was counted in both channels and compared with estimate the efficacy of paramecia staining. Values are expressed as means ± SD; n = 3 (each >100 cells). C: paramecia were stained with different doses of DiR′ dye, washed, and maintained in standard conditions. Their optical density (OD) was measured before and after staining for several hours to test for an impact of staining on paramecia viability. As a control, one group of paramecia was heated to 90°C, which caused cell lysis. Values are expressed as means ± SD; n = 3 (each >100 cells). D: paramecia were stained with different doses of DiR′ dye, washed, maintained in standard conditions, and heat fixed after defined time intervals poststaining to test the time stability of the paramecia staining. The emission signal of individual paramecia was measured with the infrared macroscope (100-ms exposure time), and paramecia were bleached postexperiment using FL light (760 lux, 2 h) as a positive control. Values are expressed as means ± SD; n = 3 (each >100 cells). E: paramecia were exposed for 2 h continuously to IR and white light followed by 1 h of continuous exposure to FL (340 lux) and white light. The fluorescence emission was recorded every 5 min. These light intensities were used for all future experiments. Values are expressed as means ± SD; n = 3 (each >100 cells).
Behavioral experiments.
Zebrafish larvae were continuously fed with unlabeled paramecia starting at 4 dpf and were held in petri dishes prior to every experiment at room temperature (22–24°C) for at least 3 h. We conducted both feeding and digestive experiments. For all experiments, larvae were randomly allocated to treatment groups and positioned on the plate.
For feeding experiments, zebrafish larvae were either continuously fed by exposure to an excess of unlabeled paramecia or were fasted by washing and transferring zebrafish larvae to a new petri dish containing no paramecia for a given time interval. Prior exposure to labeled paramecia and behavioral imaging, all zebrafish larvae were washed and subsequently placed individually into 160 μl of blue water in a single well of a 96-well plate (Falcon, VWR). Within 1 min prior to the start of behavioral imaging, 40 μl of labeled paramecia (>140 paramecia unless stated) was added to each well and the plate was imaged with the infrared macroscope, as described above. If stimuli were used, zebrafish larvae were fasted for 2 h and randomly placed into one of the 96 wells; then 50 μl of drugs or vehicle were added to each well. The zebrafish larvae were preexposed to the drug for 30 min prior to the addition of 40 μl of labeled paramecia (>140 individual paramecia) and subsequent behavioral imaging. All drugs were dissolved in blue water, and the drug concentration per well was as follows: carvedilol (∼10 μM; Sigma, St. Louis, MO), melatonin (∼10 μM; Sigma), tricaine mesylate or MS-222 (∼10 mM; Sigma), nicotine (∼10 μM; Sigma), caffeine (∼10 μM; Sigma), d-glucose (∼10 mM; Fluka, Newport News, VA), l-alanine (∼10 mM; Fluka), l-lysine (∼10 mM; Fluka), human ghrelin (∼0.03, 0.3 μM; H-4864, Bachem, Switzerland), and human insulin (∼0.3, 3, 30 μM; Sigma). These drugs and doses were selected on the basis of their impact in humans and rodents, as described in the results.
For digestive experiments, zebrafish larvae were fasted for 240, 255, 270 and 285 min and then exposed to an excess of labeled paramecia in a petri dish for 60, 45, 30, and 15 min, respectively. Subsequently, zebrafish larvae were washed, placed individually into 200-μl blue water within a single well of an empty 96-well plate, and imaged with the infrared macroscope for 2 h.
Image analysis.
Fluorescence emission (ΔF) in the zebrafish larval intestine was quantified in each well using cell profiler 2.1.1 (8). Acquired images were all treated and analyzed equally. First, images were corrected for background and uneven illumination as follows:
Here, ΔFraw is the raw image; ΔFbackground is the raw image captured at t = 0 min; and ΔFillumination is a normalization image acquired to correct for uneven illumination. ΔFillumination was acquired as follows: 200 μl DiR′ dye (125 ng/ml, dissolved in DMSO) was added into each well of a 96-well plate; subsequently, 20 fluorescence images were captured of the dye plate under standard conditions prior to calculation of a maximal intensity projection. The mean signal intensity of each well was measured followed by normalization by the maximum intensity well. The resulting quotient was used to define each well's illumination correction. After correction, each image was segmented as follows. Pixels with a gray value larger than 1 were grouped to adjacent pixels. All pixel groups position with a diameter of 220 μm or larger (single paramecia major and minor ferret diameter are 181 ± 28 μm and 124 ± 18 μm) were localized to each well. Within wells, the pixel group with the maximal integrated intensity (group area × mean intensity) was identified, and the integrated signal intensity was extracted and plotted as ΔF. A similar strategy was used to quantify heat-fixed paramecia (Fig. 2) with an adapted correction and segmentation approach.
Transmitted macroscopy was used to trace the swimming dynamics of zebrafish larvae in all wells. Images were recorded at 20 fps and analyzed online using LabView 13.0 F1 (National Instruments, Austin, TX) as follows: The software followed a real-time loop, in which each image was subtracted from the next frame's image to obtain pixels that were altered in the frame interval. The resulting delta-pixel image was thresholded on the basis of size (>605 μm) to record x-y coordinates and a time stamp for each delta-pixel groups, presumably corresponding to a moving single fish. Speed was binned for 1-min time intervals, except for the darkflash experiment (Fig. 4, D–F).
Modeling.
The rate of fluorescence emission (dF/dt) in the zebrafish larval intestinal cavity reflects a signal composed of at least two biological processes: ingestion and digestion of labeled paramecia (given our data showing the lack of significance of the photo-bleaching process), and can be described as a function of resulting fluorescence (F) as follows:
To obtain the exact analytical form of the ingestion and digestion functions, we took a two-pronged approach: First, we assumed linearity in the digestion rate based on the data shown in Fig. 5C, and from here, we used a machine learning-based fitting algorithm within MatLab to fit the data to several different models with a linear digestion function and a number of different sigmoid-like ingestion functions. The software used the fmincon function to perform a lightly constrained minimization of a function calculating the root mean squared (RMS) error between the data and the model. We used leave-one-out cross validation to select the most predictive model based on the lowest cross validation RMS error value, which turn out to be a two-parameter, sigmoid-based on the generalized logistic function as shown below:
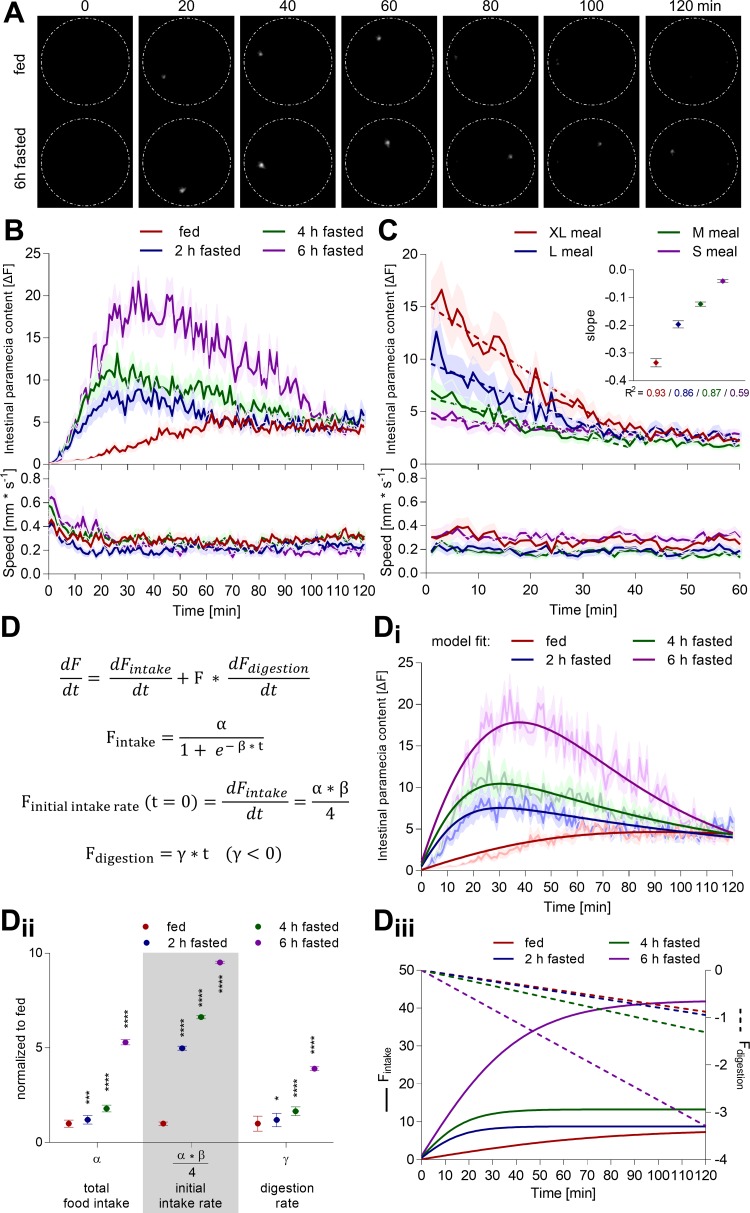
Fig. 5.
Zebrafish larvae actively control nutrient homeostasis and digestion. A and B: individual zebrafish larvae (7 dpf) were fasted for different time intervals or constantly fed prior to exposure to an excess of labeled paramecia. Their subsequent ingestion and digestion of labeled paramecia were quantified simultaneously, as well as their swimming behavior, using the infrared macroscope. An example fluorescence image sequence of two distinctly fed zebrafish larvae hunting live paramecia is shown in A (white dashes: border of a single-well of a 96-well plate, diameter 6.8 mm). Values are expressed as means ± SE; n = 36. C: individual zebrafish larvae (7 dpf) were fed different meal sizes. Subsequently, all available paramecia were removed by washing, thereby enabling us to record solely the digestion of a given meal and the swimming behavior of the fish. A linear regression was fitted into the data (first 40 min, dashed line). Values are expressed as means ± SE; n = 36. D: rate of fluorescence signal change in the larval intestine reflects an interplay of two biological processes, ingestion rate of labeled paramecia (Fintake), and digestion rate (Fdigestion) of previously ingested paramecia (F). Panel C suggested a linear form for the digestion function, and we used machine learning to determine the functional form for the ingestion function. This model can be fit to all experimental data acquired by the infrared macroscope. D, i: here, we show an example fit of the model to the raw data shown in B (dimmed). D, ii: extracted parameters correspond to the saturation level (α) and initial intake rate (α·β/4) of the ingestion function, and the linear slope of the digestion function (γ). Values are expressed as means ± SE; n = 36; unpaired one-way ANOVA, Dunnett's post hoc test; *P < 0.05, ***P < 0.001, ****P < 0.0001. D, iii: ingestion (solid line) and digestion function (dashed line) can be plotted using these parameters.
Here, α is the asymptote of the curve, representing the level at which the function saturates, and β is the relative rate of the function, representing the rate of ingestion before saturation. To calculate the quality of the fit, we utilized a bootstrap-based approach to calculate the error associated with fitting each of the model parameters.
Statistics.
The data were analyzed using GraphPad Prism 6.0. Statistical significance between the means was tested using one-way ANOVA and Dunnett's post hoc test as indicated. Differences were considered significant at P < 0.05.
RESULTS
Infrared macroscope-based quantification of dynamics in intestinal dye content and swimming kinetics of freely behaving zebrafish larvae.
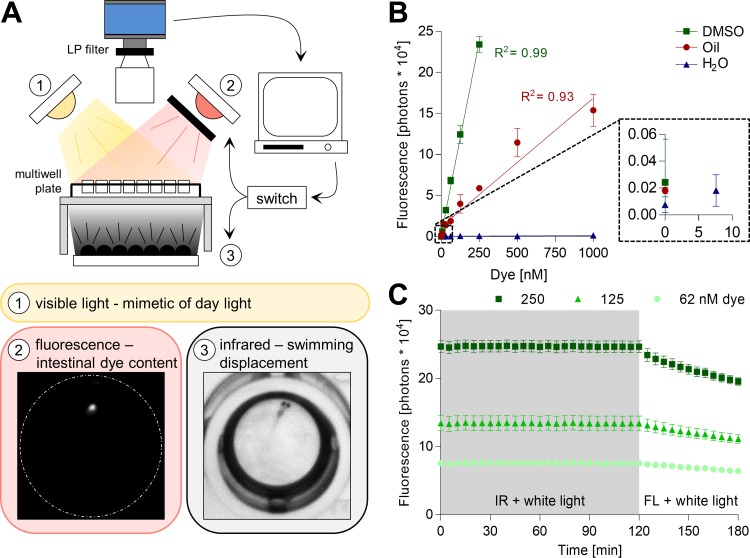
We aimed to measure the intake and digestion of stained paramecia by unrestrained zebrafish larvae and simultaneously trace their swimming speed with high throughput. To that end, we built a macroscope able to excite and detect DiR′ dye within an area large enough to situate a multiwell plate (Fig. 1A). Three major factors were considered when selecting the DiR′ dye for paramecia staining. First, the dye was excitable with infrared light, which is critical as zebrafish behavior is light-sensitive and, therefore, visible excitation light could induce unwanted behavioral responses (6). Second, the DiR′ dye did not stain the fish water due its lipophilic structure. Fluorescent emission was not detectable from 1 μM DiR′ dye in water, but it correlated linearly with dye concentration dissolved in DMSO and oil at detection limits of 7.8 nM (Fig. 1B, signal at least 3 SD above noise level). The emission signal noise floor was 6.6 ± 0.4% in DMSO and 17 ± 1% in oil, respectively. Third, the dye must be photostable under the infrared array used for tracking zebrafish kinematic behavior, and under the white light required to mimic daylight (Fig. 1A). DiR′ dye fluorescence emission was not affected by continuous exposure to the 940-nm array and white light, whereas 1-h continuous exposure to the DiR′ dye excitation light bleached the emission signal by 18.2 ± 0.3% (Fig. 1C). Subsequently, we developed a protocol to stain paramecia with the lipophilic DiR′ dye (see materials and methods). This labeling protocol stained paramecia with high efficiency (Fig. 2, A and B) and had no detectable impact on paramecia viability (Fig. 2C); labeling persisted for several hours (Fig. 2D). Stained paramecia had a consistent major and minor feret diameter of 181 ± 28 μm and 124 ± 18 μm (mean ± SD), respectively. Similar to the DiR′ dye in DMSO, paramecia staining was highly photostable and did not bleach under the imaging conditions established here (Fig. 2E). These illumination settings were used throughout the rest of the study. In summary, paramecia stained with DiR′ dye were viable, photostable, and detectable for at least several hours by the infrared macroscope built here.
Fig. 1.
Performance of the infrared macroscope. A: the camera was situated above a transparent behavioral platform to enable imaging of a multiwell plate. The camera was protected by a long-pass filter (LP) with a cutoff at 780 nm. The behavioral platform was illuminated by three distinct light sources: 1) a white light to mimic daylight; 2) a far-red light refined by a bandpass filter (BP; 670–750 nm) for fluorescent excitation (FL); and 3) a 940-nm light array (IR) to enable transmitted light macroscopy. The light sources were alternated to capture either fluorescent (2, white dashes represent border of a single well in a 96-well plate, diameter 6.8 mm) or transmitted (3) light images. The latter allowed for online tracking of zebrafish larvae swimming displacement and the former for intestinal dye content measurement. B: different doses of DiR′ dye dissolved in DMSO, oil, or water were excited with the FL light, and the fluorescence emission was recorded for 100 ms. Values are expressed as mean ± SD, n = 3. DMSO: y = 0.094 ± 0.002 x + 0.3 ± 0.2, R2 = 0.99; oil: y = 0.016 ± 0.001 x + 1.2 ± 0.3, R2 = 0.93. C: light stability of the DiR′ dye was assessed by exposing different doses of the dye in DMSO to 2 h of continuous IR and white light, followed by 1 h of continuous FL (760 lux) and white light illumination. The fluorescent emission was recorded every 5 min for 100 ms. Values are expressed as means ± SD; n = 3.
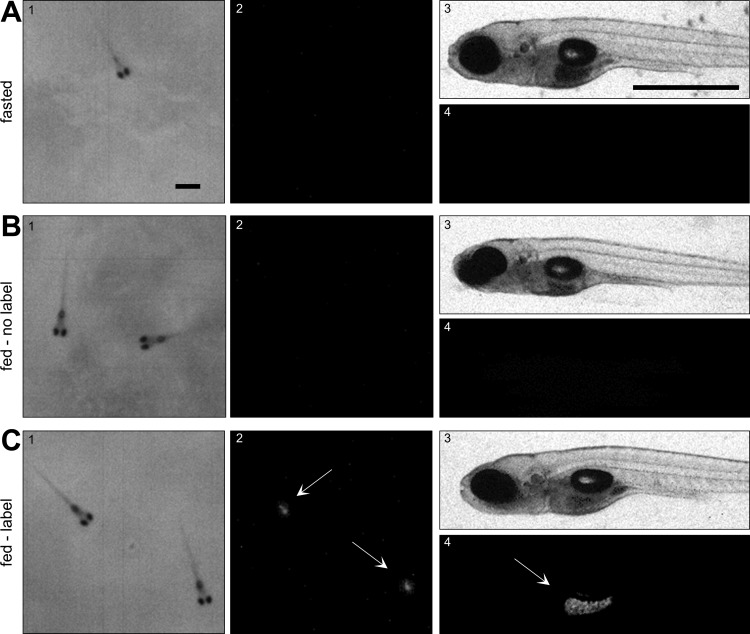
Next, we evaluated the performance of the infrared macroscope for in vivo detection of intestinal dye content and larval swimming behavior. First, we tested whether the infrared macroscope is able to detect ingested paramecia in cold-euthanized larval zebrafish (nac strain) and compared it to a conventional microscope. Euthanized larvae were used to minimize paramecia digestion. Solely DiR′ dye-labeled paramecia were detectable with both scopes, and DiR′ dye signal was mainly localized to the intestine of zebrafish larvae (Fig. 3). Second, we tested the sensitivity of the infrared macroscope for quantitative in vivo detection of food intake. Images were segmented using a size threshold to exclude single paramecia detection. This was a necessity to distinguish fluorescent emission of freely moving paramecia from paramecia within the intestinal track of a larva. To test the sensitivity of this methodology, we fed zebrafish larvae a defined number of individual paramecia and measured their intestinal dye content with high temporal resolution (Fig. 4A). Intestinal dye content increased over time relative to the number of paramecia available to each fish (Fig. 4B). Analogously, the integrated signal correlated linearly with paramecia ingestion (Fig. 4C). The infrared macroscope detection limit was two ingested paramecia, and above this threshold, increments of single ingested paramecia were distinguishable. As expected, paramecia availability affected the amplitude of intestinal fluorescence signal, as well as the intake rate (Fig. 4B). Hence, we can distinguish free from intestinal paramecia. Third, we tested whether the infrared light used for fluorescent excitation affected fish swimming behavior. Dark flashes increased swimming activity in zebrafish larvae and, therefore, served as a positive control (6). Zebrafish larvae were exposed to constant white light illumination, then to a set of excitation light flashes, and finally to a set of dark flashes while tracking online their swimming behavior with 20-Hz resolution. Excitation light flashes did not alter swimming behavior, whereas dark flashes repeatedly induced swim bursts (Fig. 4E). Specifically, dark flashes elicited an increase in swimming displacement for ∼250 ms after the stimulus, comparable to previous reports (Fig. 4F) (6). In summary, the presented infrared macroscope can simultaneously detect intestinal paramecia content and swimming behavior in 96 undisturbed, live zebrafish larvae.
Fig. 3.
High-resolution images of the ingested DiR′ dye. Fasted zebrafish larvae (7 dpf) were exposed to none (A), nonlabeled (B), or labeled (C) paramecia for 30 min before euthanasia in iced water, agar embedding, and imaging with the infrared macroscope using the transmitted (1) or FL (2) light mode, and a Zeiss microscope using brightfield (3) and fluorescence (4) microscopy. Fish were euthanized to minimize digestion. Arrows indicate labeled paramecia in the larvae's intestine. Scale bar reflects 1 mm in both images.
Zebrafish larvae actively control nutrient homeostasis and digestion.
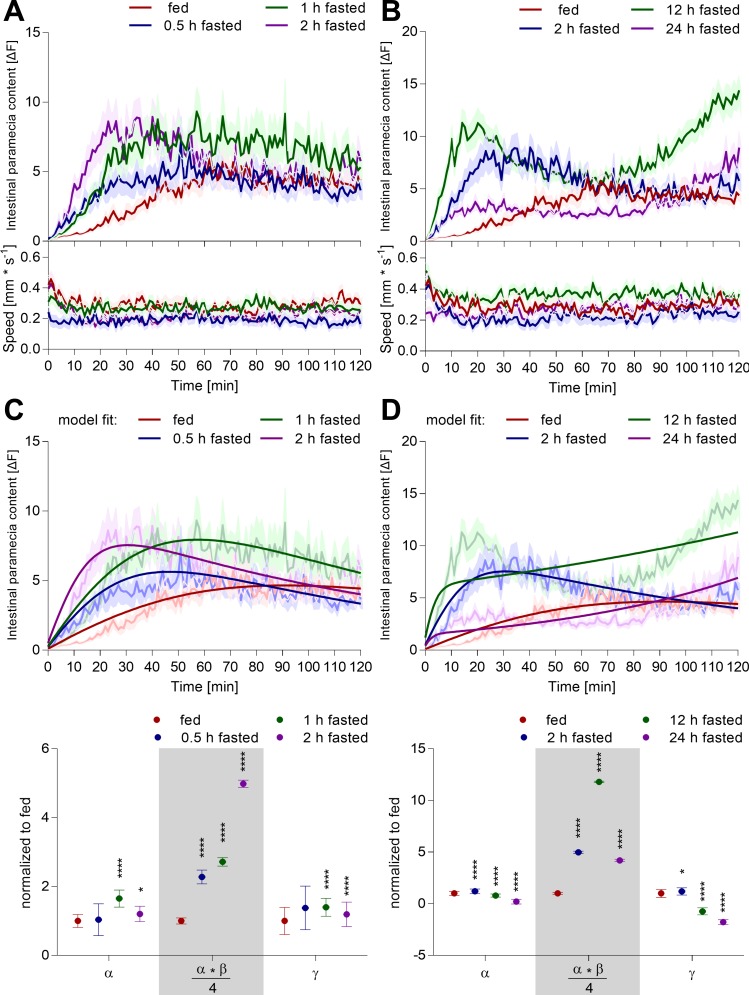
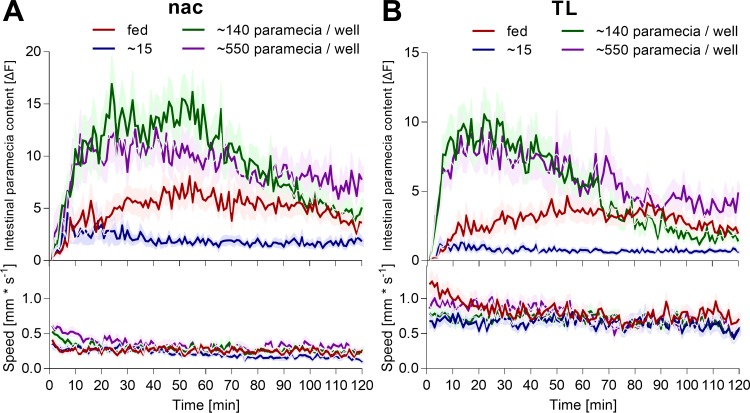
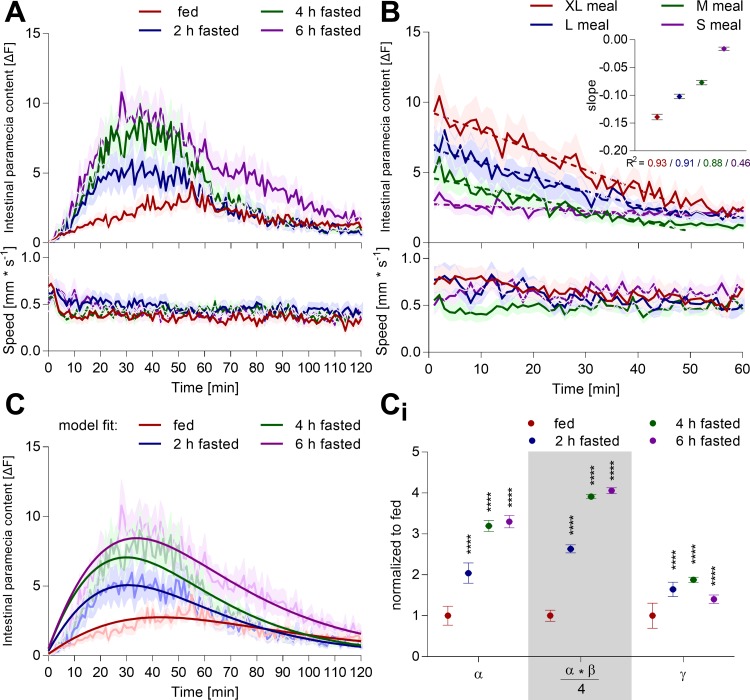
Zebrafish larvae execute complex maneuvers for prey capture. However, whether this behavior is a simple motor command triggered by moving prey or actively regulated by nutrient homeostatic state is unknown. To trigger a nutrient demand, we fasted zebrafish larvae for different lengths of time and recorded their intestinal dye content and swimming behavior upon exposure to an excess of labeled paramecia. Shorter periods of fasting (0.5–6 h) increased intestinal dye content acutely and incrementally with fasting times (Fig. 5, A and B, Fig. 6A), suggesting that zebrafish do, in fact, modulate their feeding behavior based on hunger state. Longer periods of fasting (>12 h) did trigger an acute paramecia intake and stimulated a second phase of paramecia ingestion (Fig. 6B). Paramecia intake by zebrafish larvae starved for the preceding 24 h was even lower than the fed control group, suggesting that food deprivation spanning a significant portion of larval maturation (>14% of total life span at the time) is a major homeostatic burden. Swimming dynamics did not show dramatic changes related to the fasting periods. Occasionally, we observed an initial period of slightly higher swim activity, which is likely caused by adaptation to the novel environment (see Fig. 5B). In all interventions, intestinal fluorescent signals decayed, highlighting the need for dynamic measurements. This decay may be caused by a combination of photobleaching, lack of paramecia, and/or digestion. Photobleaching can be excluded, as our illumination settings did not cause significant paramecia bleaching, even when continuously exposed for 1 h to the excitation light (Fig. 2E). In the behavioral protocol utilized here, larvae and paramecia were exposed to the excitation light for a total of 12 s (100 ms every min for 2 h). Second, an excess of paramecia (>140 paramecia/fish) was provided to avoid paramecia availability becoming a limiting factor for food intake throughout the study. Once >140 paramecia were offered to an individual fish, intestinal fluorescence content dynamics showed minor alterations (Fig. 7). Consequently, we propose that intestinal fluorescent signal decay is mainly due to paramecia digestion. The DiR′ dye gets dissolved in water upon plasma membrane lysis, causing its fluorescence emission to vanish (Fig. 1B). To test this specifically, larval zebrafish were fed different meal sizes and then washed to remove all noningested paramecia; subsequently, their intestinal dye content and swimming behavior were measured (Fig. 5C). The intestinal fluorescence signal decayed over time and was fit with a linear regression. Slopes increased with meal size, suggesting that larger meals stimulate larger intestinal digestive activity. Analogous experiments were conducted in another wild-type strain (TL) and showed consistent outcomes across strains (Fig. 8, A and B). Hence, intestinal dye content reflects a signal composed of at least two biological processes: ingestion and digestion of labeled paramecia.
Fig. 6.
Feeding, digestive, and kinematic behavior of short- and long-termed starved zebrafish larvae. A and B: individual zebrafish larvae (7 dpf) were fasted for different time intervals or constantly fed prior to exposure to an excess of labeled paramecia. Their subsequent ingestion and digestion of labeled paramecia was quantified simultaneously with their swimming behavior using the infrared macroscope. C and D: model established in Fig. 5 can be fit to the above data (dim line, original data; solid line, model fit), and the experimental outcome can be parameterized accordingly. Values are expressed as means ± SE; n = 36; unpaired one-way ANOVA, Dunnett post hoc test; *P < 0.05, ****P < 0.0001.
Fig. 7.
Zebrafish larvae behavior upon exposure to an excess of paramecia. Individual zebrafish larvae (A, nac; B, TL strain; 7 dpf) were fasted for 2 h prior to exposure to an approximate number of labeled paramecia per well. The fed group was continuously fed and exposed to >140 paramecia/well. Their subsequent ingestion and digestion of labeled paramecia were quantified simultaneously with their swimming behavior using the infrared macroscope. Values are expressed as means ± SE; n = 36.
Fig. 8.
Zebrafish larvae actively control nutrient homeostasis and digestion. Analogous experiments as presented in Fig. 5 for the nac larval strain were conducted here with 7 dpf-old TL larval zebrafish (distinct wild type strain). A: individual zebrafish larvae were fasted for different time intervals or constantly fed prior to exposure to an excess of labeled paramecia. Their subsequent ingestion and digestion of labeled paramecia was quantified simultaneously, as well as their swimming behavior, using the infrared macroscope. Values are expressed as means ± SE; n = 24. B: individual zebrafish larvae were fed different meal sizes. Subsequently, all available paramecia were removed by washing and, thereby, enabled to record solely the digestion of a given meal and the swimming behavior of the fish. A linear regression was fitted into the data (first 50 min, dashed line). Values are expressed as means ± SE; n = 24. C: model established in Fig. 5 was applied here to the TL strain. The model fit to the experimental data acquired in panel A (dimmed data) is shown as a solid line, and the parameters were extracted (Ci). Values are expressed as means ± SE; n = 24; unpaired one-way ANOVA, Dunnett post hoc test; ****P < 0.0001.
In an effort to describe the complex interplay of paramecia intake and their concurrent digestion, we developed a rate-based model. The basic model structure attributed the temporal changes in intestinal fluorescence to an additive effect between the rate of paramecia ingestion and the rate of paramecia digestion. Paramecia digestion is directly dependent on the intestinal paramecia content and was modeled as a linear decay based on experimental results (Fig. 5C). To identify the functional form that most closely reflects the ingestion function, we used machine learning to fit numerous asymptotic functions to our data via root mean square error minimization and selected a modified logistic function using leave-one-out cross validation (see materials and methods). The model parameterized the intestinal fluorescence into an ingestion saturation level (α), its corresponding asymptotic rate (β), and the linear slope of the digestion function (γ) (Fig. 5D). These parameters reflect three biologically relevant functions: total paramecia intake (α), the initial rate of paramecia intake (α·β/4), and the digestion rate (γ). Using these parameters, we were able to reconstruct the ingestive and digestive processes responsible for the intestinal fluorescence measured in Fig. 5B (Fig. 5D, iii). The model suggested that an increase in starvation time stimulated a larger initial paramecia intake rate and increased the total number of ingested paramecia (Fig. 5D, ii). Importantly, the model predicted that digestion rate increased with meal size in agreement with our independent experimental observations (Fig. 5C). This rate-based model was applicable to another wild-type strain, showing the broader feasibility of the concept (Fig. 8). The model's predictive power was limited when intestinal fluorescence had multiple or unclear peak structure (Figs. 6B and 10—nicotine, d-glucose, or l-lysine). Hence, this model simplified the distinction of ingestive and digestive processes and condensed the temporal data into three discrete biologically relevant parameters.
Fig. 10.
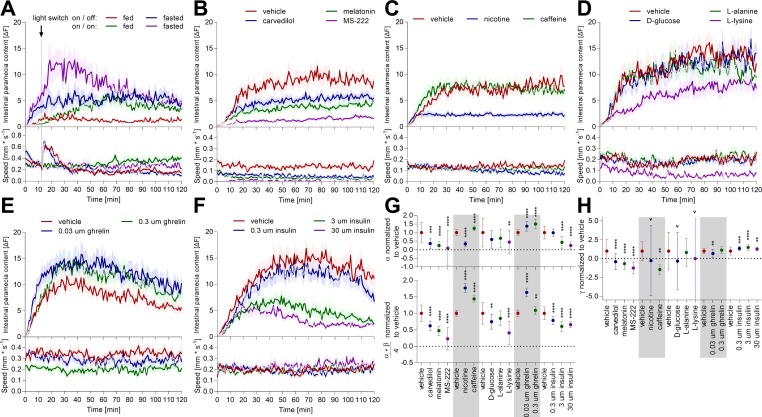
Distinct environmental, pharmacological, and physiological interventions modulate feeding and swimming behavior. A: individual zebrafish larvae (7 dpf) were fasted for 2 h or constantly fed prior to exposure to an excess of labeled paramecia. White light illumination was shut off 12 min after paramecia exposure (pointed line). Zebrafish ingestion and digestion of labeled paramecia were quantified simultaneously with their swimming behavior. Values are expressed as means ± SE; n = 24. B–F: individual zebrafish larvae (7 dpf) were fasted for 2 h, and then exposed for 30 min to a specific compound prior to being given access to an excess of labeled paramecia. Zebrafish ingestion, digestion, and swimming behavior were monitored with the infrared macroscope. Distinct compounds were used: sedating pharmaceuticals (B), common daily drugs (C), individual nutrients (D), and physiological peptides (E and F). All of the experimental data acquired were fit to the model established in Fig. 5, and the parameters describing the ingestion (G) and the digestion (H) function were extracted. Values are expressed as means ± SE; n = 32 (B–D), 36 (E and F); unpaired one-way ANOVA, Dunnett post hoc test; **P < 0.01, ***P < 0.001, ****P < 0.0001.
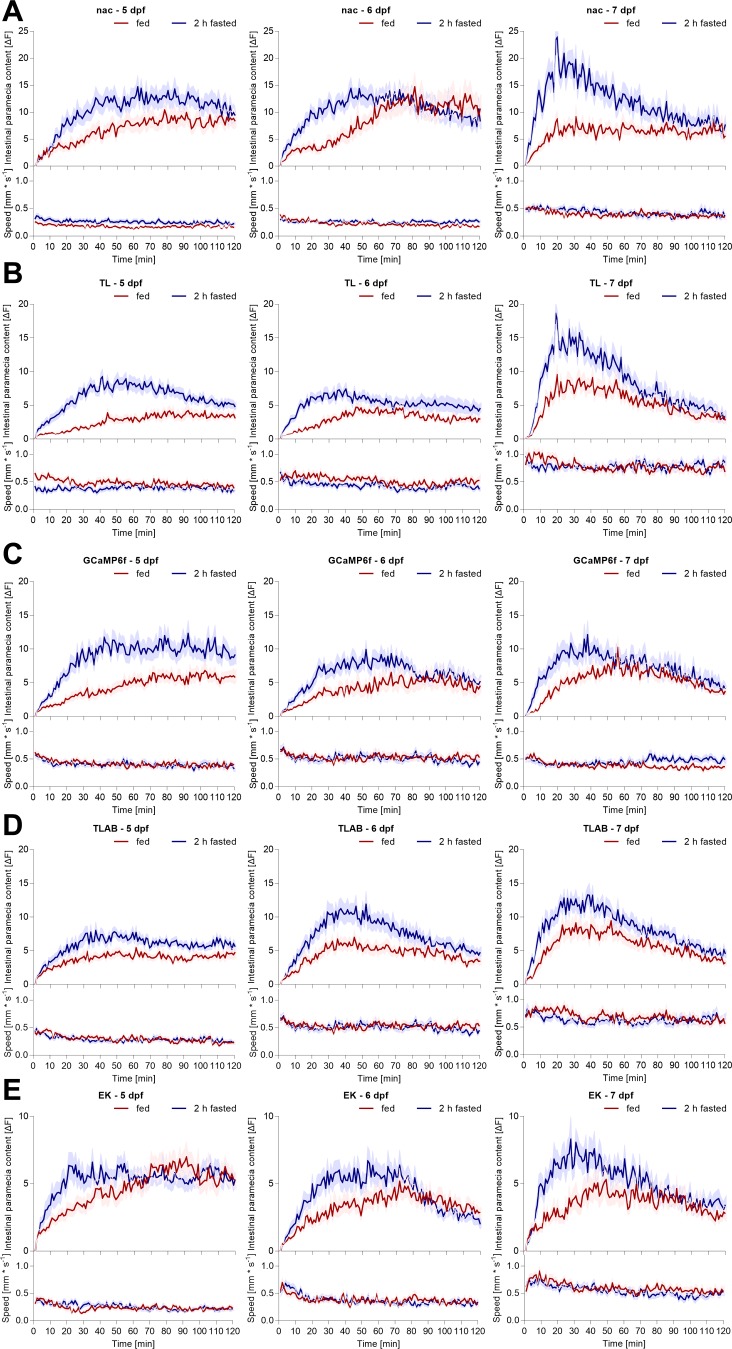
Finally, to firmly establish that zebrafish larvae, regardless of genetic background, regulate nutrient homeostasis at different stages of maturation, we tested numerous wild-type stains at different ages. Notably, four out of the five strains tested here show standard pigmentation patterns (in contrast to the translucent nacre strain used mainly in this work), which demonstrates that this technique is not limited to translucent strains. All larvae increased intestinal fluorescent content postfasting compared with fed animals at 5, 6, and 7 dpf regardless of the strain (Fig. 9). Swimming activity increased from 5 to 7 dpf larvae and showed variation between strains. Overall, we showed that active control of nutrient homeostasis and intestinal nutrient digestion is a general principal seen across otherwise behaviorally and genetically diverse populations of zebrafish larvae.
Fig. 9.
Developmental and strain-specific impact on feeding, digestive, and kinematic behavior. Individual zebrafish larvae were fed or fasted for 2 h prior to exposure to an excess of labeled paramecia. Their subsequent ingestion and digestion of labeled paramecia were quantified simultaneously with their swimming behavior using the infrared macroscope. Distinct zebrafish reference strains: nac-little pigmentation (A), TL-wild type (B), GCaMP6f (brain-wide neuronal activity reporter)-AB background (C), TLAB-wild type (D), and EK-wild type (E) were tested at 5, 6, and 7 dpf, as indicated. Values are expressed as means ± SE; n = 36.
Distinct environmental, pharmacological, and physiological interventions regulate zebrafish larvae feeding and digestive behavior.
Zebrafish larvae actively control food intake and its digestion. Active control enables modulation of these key metabolic functions by using the appropriate modulators. We tested distinct known and unknown stimuli for an impact on larval feeding and digestive behavior, thereby taking advantage of the high-throughput capacity of the infrared macroscope. Initially, we tested interventions known to modulate zebrafish kinematic behavior (but having an unknown impact on feeding behavior) and, thereby, further validated the method. Paramecia hunting behavior was proposed to be primarily mediated by vision (11). To confirm this finding, we turned off white light illumination 12 min postparamecia exposure in our behavioral experiment. Intestinal dye content stopped rising immediately upon the onset of darkness in the starved group but did not decline to zero, indicating that fish were still able to hunt, albeit with lower efficiency (Fig. 10A). Additionally, fish displacement increased acutely upon onset of darkness and settled to a more quiescent state 50 min after the onset of darkness. Both observations were in line with previous fish motion studies (6, 11). It is worth consideration that paramecia might also alter their behavior based on ambivalent light conditions. Next, we tested three sedative drugs. Two of them, carvedilol and melatonin, were identified in a large-scale kinematic screen in larval zebrafish (29), and the third, MS-222, is a standard anesthetic used in zebrafish research. Not surprisingly, these sedative drugs immobilized the larva to different extents and reduced paramecia intake accordingly (Fig. 10B). Total paramecia intake, initial paramecia intake rate, and digestion rate were all reduced in line with the impact of sedating drugs on distinct aspects of animal physiology (Fig. 10, G and H). Critically, these data highlight the importance of measuring feeding and digestive behavior simultaneously with kinematic parameters when assessing the behavioral impact of unknown compounds with potential anesthetic properties.
Subsequently, we sought to test interventions known to alter feeding behavior in rodents and humans, but of unknown impact in zebrafish larvae. First, we focused on common daily drugs, such as caffeine and nicotine. Both are popular due to their arousing effect and other properties. Smokers report using cigarettes as a means to control body weight and nicotine inhibits feeding in rodent models, whereas caffeine has no general accepted impact on appetite (22, 40). Interestingly, caffeine and nicotine induced a faster initial paramecia intake rate in zebrafish larvae (Fig. 10, C and G). Caffeine had no long-term impact on paramecia intake, whereas nicotine inhibited food intake extensively. Second, high-protein diets are more satiating than high-fat or high-carbohydrate diets in rodents and humans, an effect likely driven by specific amino acids (23, 24). l-lysine was shown to be particularly anorectic compared with other isomolar amino acids or glucose (17). Analogous to rodents, l-lysine had an acute impact on paramecia intake and swimming in zebrafish larvae, whereas isomolar concentrations of l-alanine or d-glucose had no apparent behavioral impact (Fig. 10D). Third, numerous hormones contribute to the control of nutrient intake and maintenance of nutrient homeostasis. Two hormones of opposing behavioral effect are the orexigenic hormone ghrelin and the anorectic peptide insulin (1, 43–45). Comparable to other vertebrates, ghrelin stimulated paramecia intake, and insulin inhibited food intake in zebrafish larvae (Fig. 10, E and F). Interestingly, the highest ghrelin dose (0.3 μM) reduced fish displacement slightly but stimulated paramecia intake, indicating no link between both behaviors. Altogether, we reproduced the impact of previously identified kinematic modulators of zebrafish swimming behavior, confirming the reproducibility of these effects. Importantly, pharmacological, dietary, and endocrinal interventions had an analogous impact on feeding and digestive behavior in zebrafish larvae, as previously reported for rodents and humans. Consequently, real-time and parallel monitoring of zebrafish larvae feeding and digestive behavior holds promise as an appropriate assay for high-throughput translational research.
DISCUSSION
The zebrafish larvae's appeal for biomedical research comes from their applicability in large-scale whole animal screens (28, 36). Eating and digestion disorders are of major clinical interest and, therefore, there is a need for technology to make zebrafish larvae available to these fields. The infrared macroscope described here can trace 96 larvaes' swimming behavior and simultaneously quantify their food intake and digestion with a sensitivity of single paramecia (Fig. 4). All measurements are feasible with infrared light, thereby not disturbing natural fish behavior. Consequently, feeding behavior and intestinal nutrient metabolism are now accessible targets for high-throughput genetic and drug screens in vertebrates. Such unbiased whole organism phenotype screens yield a significantly higher success rate in identifying first-in-class small molecules compared with target-driven cellular or in vitro approaches, thereby contributing to the appeal of the present technology (28, 37). Additionally, the use of a vertebrate model, such a zebrafish, is desirable to exploit physiological, genetic, and anatomical homologies to humans. In confirmation of this, we showed that interventions linked to human behavioral changes induce similar phenotypes in fish (Fig. 10). Hence, zebrafish larvae hold promise for the identification of conserved mechanisms underlying feeding behavior and intestinal nutrient metabolism.
A major utility of our presented technique is its ability to answer questions about nutrient homeostasis. We showed that nutrient deprivation, generally known as hunger, caused an acute increase in nutrient intake (Fig. 5). When this nutrient need was met, nutrient intake dropped, and larvae were satiated. This behavior occurred on a 2-h timescale and likely modulated the visual-motor programs required for hunting behavior (4, 26, 33). Upon meal ingestion, food is digested within the gastrointestinal tract. Here, we revealed that digestive activity is matched to the meal size in zebrafish larvae (Fig. 5). This adaptable response to the feed size indicates an active control over digestive function and represents a conserved functional feature of the gastrointestinal tract (7, 16, 19). To resolve the dynamic interaction between intake and the co-occurring digestion of stained paramecia, we parameterized both processes using a rate-based model. The model successfully predicted active regulation of nutrient digestion (Fig. 5) and revealed that sedating drugs inhibit digestion (Fig. 10), analogous to previous observations in rodents (38). The model is powerful in the controlled experimental conditions here (i.e., abundant food and known food deprivation times), but it may underrepresent other biological parameters. For instance, the ingestive function depends also on paramecia availability (Fig. 4B), hunting success rate, and food preference among others, and the digestive function results from the synergistic action of gastric acid and pancreatic digestive enzyme secretion, peristaltic intestinal muscle contractions, epithelial nutrient absorption, and microbiota nutrient breakdown (14, 27, 32, 41). As larval zebrafish share these features with higher vertebrates, the simultaneous experimental readout of these metrics and integration into the model represents abundant ground for future efforts. We conclude that zebrafish larvae actively regulate nutrient homeostasis and digestion.
Perspectives and Significance
Overall, we developed an infrared macroscope to pioneer feeding and digestive research in zebrafish larvae, as well as to support future high-throughput discovery endeavors. This opens the avenue for zebrafish larvae research to contribute to the neuronal understanding of nutrient homeostasis, digestive physiology, and the underlying crosstalk of the autonomic and central nervous systems.
GRANTS
J. Jordi is funded by an Early Postdoc Mobility Grant from the Swiss National Science Foundation, and F. Engert is supported by National Institutes of Health Grants U01NS090449-01, DP1 NS082121, and 5R01DA030304-02.
DISCLOSURE
J. Jordi and F. Engert filed a patent for the presented technology.
AUTHOR CONTRIBUTIONS
Author contributions: J.J. and F.E. conception and design of research; J.J., performed experiments; J.J., D.G.-N., and E.S. analyzed data; J.J. interpreted results of experiments; J.J. prepared figures; J.J. drafted manuscript; E.Y.S. and C.L.W. performed preliminary experiments; J.J., D.G.-N., E.S., and F.E. edited and revised manuscript; J.J., D.G.-N., E.S., E.Y.S, C.L.W. and F.E. approved final version of manuscript.
ACKNOWLEDGMENTS
We thank A. D. Bolton, K. Herrera, T. A. Lutz, F. Verrey, S. Kunes, A. Schier, and R. Peterson for input to the manuscript, as well as J. Miller and her team for excellent fish care.
REFERENCES
- 1.Air EL, Benoit SC, Clegg DJ, Seeley RJ, Woods SC. Insulin and leptin combine additively to reduce food intake and body weight in rats. Endocrinology 143: 2449–2452, 2002. [DOI] [PubMed] [Google Scholar]
- 2.Begg DP, Woods SC. The endocrinology of food intake. Nat Rev Endocrinol 9: 584–597, 2013. [DOI] [PubMed] [Google Scholar]
- 3.Bernier R, Golzio C, Xiong B, Stessman HA, Coe BP, Penn O, Witherspoon K, Gerdts J, Baker C, Vulto-van Silfhout AT, Schuurs-Hoeijmakers JH, Fichera M, Bosco P, Buono S, Alberti A, Failla P, Peeters H, Steyaert J, Vissers LE, Francescatto L, Mefford HC, Rosenfeld JA, Bakken T, O'Roak BJ, Pawlus M, Moon R, Shendure J, Amaral DG, Lein E, Rankin J, Romano C, Vries de BB, Katsanis N, Eichler EE. Disruptive CHD8 mutations define a subtype of autism early in development. Cell 158: 263–276, 2014. [DOI] [PMC free article] [PubMed] [Google Scholar]
- 4.Bianco IH, Engert F. Visuomotor transformations underlying hunting behavior in zebrafish. Curr Biol 25: 831–846, 2015. [DOI] [PMC free article] [PubMed] [Google Scholar]
- 5.Bianco IH, Kampff AR, Engert F. Prey capture behavior evoked by simple visual stimuli in larval zebrafish. Front Syst Neurosci 5: 101, 2011. [DOI] [PMC free article] [PubMed] [Google Scholar]
- 6.Burgess H, Granato M. Modulation of locomotor activity in larval zebrafish during light adaptation. J Exp Biol 210: 2526–2539, 2007. [DOI] [PubMed] [Google Scholar]
- 7.Camilleri M. Integrated upper gastrointestinal response to food intake. Gastroenterology 131: 640–658, 2006. [DOI] [PubMed] [Google Scholar]
- 8.Carpenter AE, Jones TR, Lamprecht MR, Clarke C, Kang IH, Friman O, Guertin DA, Chang JH, Lindquist RA, Moffat J, Golland P, Sabatini DM. CellProfiler: image analysis software for identifying and quantifying cell phenotypes. Genome Biol 7: R100, 2006. [DOI] [PMC free article] [PubMed] [Google Scholar]
- 9.Farber SA, Pack M, Ho SY, Johnson ID, Wagner DS, Dosch R, Mullins MC, Hendrickson HS, Hendrickson EK, Halpern ME. Genetic analysis of digestive physiology using fluorescent phospholipid reporters. Science 292: 1385–1388, 2001. [DOI] [PubMed] [Google Scholar]
- 10.Fuhrmann G, Leroux JC. In vivo fluorescence imaging of exogenous enzyme activity in the gastrointestinal tract. Proc Natl Acad Sci USA 108: 9032–9037, 2011. [DOI] [PMC free article] [PubMed] [Google Scholar]
- 11.Gahtan E, Tanger P, Baier H. Visual prey capture in larval zebrafish is controlled by identified reticulospinal neurons downstream of the tectum. J Neurosci 25: 9294–9303, 2005. [DOI] [PMC free article] [PubMed] [Google Scholar]
- 12.Gasque G, Conway S, Huang J, Rao Y, Vosshall L. Small-molecule drug screening in Drosophila identifies the 5HT2A receptor as a feeding modulation target. Sci Rep 3: srep02120, 2013. [DOI] [PMC free article] [PubMed] [Google Scholar]
- 13.Gut P, Baeza-Raja B, Andersson O, Hasenkamp L, Hsiao J, Hesselson D, Akassoglou K, Verdin E, Hirschey MD, Stainier DY. Whole-organism screening for gluconeogenesis identifies activators of fasting metabolism. Nat Chem Biol 9: 97–104, 2013. [DOI] [PMC free article] [PubMed] [Google Scholar]
- 14.Hama K, Provost E, Baranowski T, Rubinstein A, Anderson J, Leach S, Farber S. In vivo imaging of zebrafish digestive organ function using multiple quenched fluorescent reporters. Am J Physiol Gastrointest Liver Physiol 296: G445–G453, 2009. [DOI] [PMC free article] [PubMed] [Google Scholar]
- 15.Ho SY, Lorent K, Pack M, Farber S. Zebrafish fat-free is required for intestinal lipid absorption and Golgi apparatus structure. Cell Metab 3: 289–300, 2006. [DOI] [PMC free article] [PubMed] [Google Scholar]
- 16.Hunt JN, Smith JL, Jiang CL. Effect of meal volume and energy density on the gastric emptying of carbohydrates. Gastroenterology 89: 1326–1330, 1985. [DOI] [PubMed] [Google Scholar]
- 17.Jordi J, Herzog B, Camargo SM, Boyle CN, Lutz TA, Verrey F. Specific amino acids inhibit food intake via the area postrema or vagal afferents. J Physiol (Lond) 591: 5611–5621, 2013. [DOI] [PMC free article] [PubMed] [Google Scholar]
- 18.Jordi J, Herzog B, Lutz TA, Verrey F. Novel antidiabetic nutrients identified by in vivo screening for gastric secretion and emptying regulation in rats. Am J Physiol Regul Integr Comp Physiol 307: R869–R878, 2014. [DOI] [PubMed] [Google Scholar]
- 19.Jordi J, Verrey F, Lutz TA. Simultaneous assessment of gastric emptying and secretion in rats by a novel computed tomography-based method. Am J Physiol Gastrointest Liver Physiol 306: G173–G182, 2014. [DOI] [PubMed] [Google Scholar]
- 20.Lister JA, Robertson CP, Lepage T, Johnson SL, Raible DW. nacre encodes a zebrafish microphthalmia-related protein that regulates neural-crest-derived pigment cell fate. Development 126: 3757–3767, 1999. [DOI] [PubMed] [Google Scholar]
- 21.Löhr H, Hammerschmidt M. Zebrafish in endocrine systems: recent advances and implications for human disease. Annu Rev Physiol 73: 183–211, 2011. [DOI] [PubMed] [Google Scholar]
- 22.Mineur YS, Abizaid A, Rao Y, Salas R, DiLeone RJ, Gündisch D, Diano S, Biasi De M, Horvath TL, Gao XBB, Picciotto MR. Nicotine decreases food intake through activation of POMC neurons. Science 332: 1330–1332, 2011. [DOI] [PMC free article] [PubMed] [Google Scholar]
- 23.Morrison CD, Laeger T. Protein-dependent regulation of feeding and metabolism. Trends Endocrinol Metab 26: 256–262, 2015. [DOI] [PMC free article] [PubMed] [Google Scholar]
- 24.Morrison CD, Reed SD, Henagan TM. Homeostatic regulation of protein intake: in search of a mechanism. Am J Physiol Regul Integr Comp Physiol 302: R917–R928, 2012. [DOI] [PMC free article] [PubMed] [Google Scholar]
- 25.Morton GJ, Meek TH, Schwartz MW. Neurobiology of food intake in health and disease. Nat Rev Neurosci 15: 367–378, 2014. [DOI] [PMC free article] [PubMed] [Google Scholar]
- 26.Preuss SJ, Trivedi CA, Berg-Maurer vom CM, Ryu S, Bollmann JH. Classification of object size in retinotectal microcircuits. Curr Biol 24: 2376–2385, 2014. [DOI] [PubMed] [Google Scholar]
- 27.Rawls J, Mahowald M, Ley R, Gordon J. Reciprocal gut microbiota transplants from zebrafish and mice to germ-free recipients reveal host habitat selection. Cell 127: 423–433, 2006. [DOI] [PMC free article] [PubMed] [Google Scholar]
- 28.Rennekamp AJ, Peterson RT. 15 years of zebrafish chemical screening. Curr Opin Chem Biol 24C: 58–70, 2014. [DOI] [PMC free article] [PubMed] [Google Scholar]
- 29.Rihel J, Prober DA, Arvanites A, Lam K, Zimmerman S, Jang S, Haggarty SJ, Kokel D, Rubin LL, Peterson RT, Schier AF. Zebrafish behavioral profiling links drugs to biological targets and rest/wake regulation. Science 327: 348–351, 2010. [DOI] [PMC free article] [PubMed] [Google Scholar]
- 30.Schlegel A, Stainier DY. Lessons from “lower” organisms: what worms, flies, and zebrafish can teach us about human energy metabolism. PLoS Genet 3: e199, 2007. [DOI] [PMC free article] [PubMed] [Google Scholar]
- 31.Schwizer W, Fox M, Steingötter A. Non-invasive investigation of gastrointestinal functions with magnetic resonance imaging: towards an “ideal” investigation of gastrointestinal function. Gut 52, Suppl 4: iv34–iv39, 2003. [DOI] [PMC free article] [PubMed] [Google Scholar]
- 32.Seiler C, Davuluri G, Abrams J, Byfield F, Janmey P, Pack M. Smooth muscle tension induces invasive remodeling of the zebrafish intestine. PLoS Biol 10, 2012. [DOI] [PMC free article] [PubMed] [Google Scholar]
- 33.Semmelhack JL, Donovan JC, Thiele TR, Kuehn E, Laurell E, Baier H. A dedicated visual pathway for prey detection in larval zebrafish. Elife 3, 2014. [DOI] [PMC free article] [PubMed] [Google Scholar]
- 34.Shimada Y, Hirano M, Nishimura Y, Tanaka T. A high-throughput fluorescence-based assay system for appetite-regulating gene and drug screening. PLoS ONE 7: e52549, 2012. [DOI] [PMC free article] [PubMed] [Google Scholar]
- 35.Solon-Biet SM, McMahon AC, Ballard JW, Ruohonen K, Wu LE, Cogger VC, Warren A, Huang X, Pichaud N, Melvin RG, Gokarn R, Khalil M, Turner N, Cooney GJ, Sinclair DA, Raubenheimer D, Couteur Le DG, Simpson SJ. The ratio of macronutrients, not caloric intake, dictates cardiometabolic health, aging, and longevity in ad libitum-fed mice. Cell Metab 19: 418–430, 2014. [DOI] [PMC free article] [PubMed] [Google Scholar]
- 36.Stewart A, Braubach O, Spitsbergen J, Gerlai R, Kalueff A. Zebrafish models for translational neuroscience research: from tank to bedside. Trends Neurosci 37, 2014. [DOI] [PMC free article] [PubMed] [Google Scholar]
- 37.Swinney DC, Anthony J. How were new medicines discovered? Nat Rev Drug Discov 10: 507–519, 2011. [DOI] [PubMed] [Google Scholar]
- 38.Torjman MC, Joseph JI, Munsick C, Morishita M, Grunwald Z. Effects of isoflurane on gastrointestinal motility after brief exposure in rats. Int J Pharm 294: 65–71, 2005. [DOI] [PubMed] [Google Scholar]
- 39.Trivedi CA, Bollmann JH. Visually driven chaining of elementary swim patterns into a goal-directed motor sequence: a virtual reality study of zebrafish prey capture. Front Neural Circuits 7: 86, 2013. [DOI] [PMC free article] [PubMed] [Google Scholar]
- 40.Voorhees CC, Schreiber GB, Schumann BC, Biro F, Crawford PB. Early predictors of daily smoking in young women: the national heart, lung, and blood institute growth and health study. Prev Med 34: 616–624, 2002. [DOI] [PubMed] [Google Scholar]
- 41.Wallace K, Pack M. Unique and conserved aspects of gut development in zebrafish. Dev Biol 255: 12–29, 2003. [DOI] [PubMed] [Google Scholar]
- 42.Williams K, Elmquist J. From neuroanatomy to behavior: central integration of peripheral signals regulating feeding behavior. Nat Neurosci 15: 1350–1355, 2012. [DOI] [PMC free article] [PubMed] [Google Scholar]
- 43.Woods SC, Lotter EC, McKay LD, Porte D. Chronic intracerebroventricular infusion of insulin reduces food intake and body weight of baboons. Nature 282: 503–505, 1979. [DOI] [PubMed] [Google Scholar]
- 44.Wren AM, Seal LJ, Cohen MA, Brynes AE, Frost GS, Murphy KG, Dhillo WS, Ghatei MA, Bloom SR. Ghrelin enhances appetite and increases food intake in humans. J Clin Endocrinol Metab 86: 5992, 2001. [DOI] [PubMed] [Google Scholar]
- 45.Wren AM, Small CJ, Ward HL, Murphy KG, Dakin CL, Taheri S, Kennedy AR, Roberts GH, Morgan DG, Ghatei MA, Bloom SR. The novel hypothalamic peptide ghrelin stimulates food intake and growth hormone secretion. Endocrinology 141: 4325–4328, 2000. [DOI] [PubMed] [Google Scholar]


