. 2015 Jul 30;4:e07389. doi: 10.7554/eLife.07389

Figure 5. Overexpression of string and wg contributes to the miR-965 mutant phenotype.

(A) Dorsal views of abdomens from adult female esg-Gal4 UAS-string flies illustrating the segment gap, segment fusion and polarity reversal phenotypes. (B) Penetrance of abdominal defects of all classes in esg-Gal4 UAS-string vs mutant. esg-Gal4 UAS-string: n = 97/469; KO1/KO2 n = 110/446. p = 0.16 Fishers exact test. (C) Penetrance of abdominal defects in esg-Gal4 UAS-wgts flies reared at 18° and 25°C vs KO1/KO2. esg-Gal4 UAS-wgts reared at 18°C: n = 9/129; esg-Gal4 UAS-wgts at 25°C n = 1/254; KO1/KO2 n = 110/446. p = 0.014 comparing wgts at 18 vs 25°C, Fishers exact test. (D) Penetrance of abdominal defects comparing KO1/KO2 mutants with KO1/KO2 mutants carrying one copy of stringEY12388 or string4 alleles. p < 0.001 comparing KO1/KO2 to KO1/KO2; stgEY/+ or stg4/+ using Fisher's exact test. (E) Confocal micrographs showing dorsal histoblast nests of wild-type (WT) and miR-965 mutant (KO) at ∼24 hr APF labeled with anti-Wg (red). Nuclei were labeled with DAPI (blue). Scale bar: 20 µm. Anterior and dorsal histoblast nests in the miR-965 mutants were not yet fused at 24 hr APF, due to delayed migration. Images were captured using identical microscope settings. (F) Penetrance of abdominal segmentation defects comparing KO1/KO2 mutants with KO1/KO2 mutants carrying one copy of wgSP-1 or wgl-12 temperature sensitive alleles or carrying one copy of wgSP-1 and stg4 together. p < 0.05 comparing KO1/KO2 to KO1, wgSP-1/KO2 using Fisher's exact test. KO1/KO2 was not significantly different from KO1, wgI-12/KO2, perhaps because wgI-12 is a weaker, temperature sensitive allele. p < 0.001 comparing KO1/KO2 with KO1, wgSP-1/KO2; stg4/+ using Fisher's exact test.

DOI: http://dx.doi.org/10.7554/eLife.07389.021

Figure 5.

Figure 5—figure supplement 1. The proportion of flies with defects caused by string overexpression.

Figure 5—figure supplement 1.

Penetrance of the three types of abdominal defect in flies overexpressing UAS-String under esg-Gal4 control. n = 102 flies. Refers to Figure 5A.
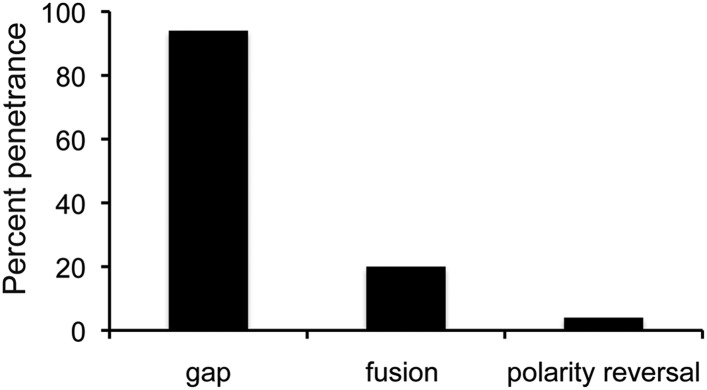
Figure 5—figure supplement 2. Still images from a time-lapse video of esg-Gal4>UAS-string histoblasts.

Figure 5—figure supplement 2.

Left: rapid proliferation phase. Note the presence of cells of different sizes, indicative of asynchronous division. Images represent 0 hr and mitosis M1, M2 and M3. Genotype: esg-Gal4, UAS-string, UAS-GFP. Right: growth and migration phase. Note the delayed spreading and incomplete replacement of the LEC, compared to controls at the equivalent time points (Figure 3C). Genotype: esg-Gal4, UAS-string, UAS-GFP. Refers to Figure 5B and Videos 8, 9.
Figure 5—figure supplement 3. Speed of histoblast nest migration.

Figure 5—figure supplement 3.

n = 15 for control, n = 18 for KO1/KO2 and n = 11 for esg-GAL4>UAS-stg. p < 0.001 comparing control and esg-GAL4>UAS-stg using one-way ANOVA. esg-GAL4>UAS-stg is not significantly different from the miR-965 mutant (KO1/KO2). Control and miR-965 mutant samples are same as in Figure 3—figure supplement 1. Refers to Figure 5B and Video 9.
Figure 5—figure supplement 4. Rescue of the migration defect of miR-965 mutants with reduced levels of string.

Figure 5—figure supplement 4.

Left: still images taken from a time-lapse video showing histoblast divisions in the miR-965 mutant (KO1/KO2) with reduced levels of string transcript using the stgEY12388 allele. M1 and M2 indicate mitosis 1 and 2. Cell membranes were labeled using Atpα-GFP (green). Nuclei were labeled using Histone2-RFP (red). ADHN: anterior dorsal histoblast nest. PDHN: posterior dorsal histoblast nest. Scale bars: 50 µM. Right: still images taken from a time-lapse video showing histoblast nest migration in animals of the same genotypes. Scale bars: 100 µM. Refers to Figure 5D and Video 11.
Figure 5—figure supplement 5. Speed of histoblast migration restored by reduced string activity.

Figure 5—figure supplement 5.

Left: speed of histoblast nest migration in the third abdominal segment. p < 0.05 comparing KO1/KO2 with KO1/KO2; stgEY12388. Control (n = 15), KO1/KO2 (n = 18) and KO1/KO2; stgEY12388 (n = 14). The Control and KO1/KO2 samples are the same as those in Figure 3—figure supplement 1. The two experiments were done together. Right: speed of histoblast migration in the fourth abdominal segment. p < 0.05 comparing KO1/KO2 with KO1/KO2; stgEY12388. Refers to Figure 5D and Video 11.