Abstract
Identifying drugs for the treatment of glioblastoma (GBM), a rapidly fatal disease, has been challenging. Most screening efforts have been conducted with immortalized cell lines grown with fetal bovine serum, which have little relevance to the genomic features found in GBM patients. Patient-derived neurosphere cultures, while being more physiologically relevant, are difficult to screen and therefore are only used to test a few drug candidates after initial screening efforts. Laminin has been used to generate two-dimensional cell lines from patient tumors, preserving the genomic signature and alleviating some screening hurdles. We present here the first side-by-side comparison of inhibitor sensitivity of laminin and neurosphere-grown patient-derived GBM cell lines and show that both of these culture methods result in the same pattern of inhibitor sensitivity. We used these screening methods to evaluate the dependencies of seven patient-derived cell models: three grown on laminin and four grown as neurospheres, against 56 agents in 17-point dose–response curves in 384-well format in triplicate. This allowed us to establish differential sensitivity of chemotherapeutic agents across the seven patient-derived models. We found that MEK inhibition caused patient-sample-specific growth inhibition and that bortezomib, an FDA-approved proteasome inhibitor, was potently lethal in all patient-derived models. Furthermore, the screening results led us to test the combination of the Bcl-2 inhibitor ABT-263, and the mTOR inhibitor AZD-8055, which we found to be synergistic in a subset of patient-derived GBM models. Thus, we have identified new candidate therapeutics and developed a high-throughput screening system using patient-derived GBM samples.
Keywords: Glioblastoma multiforme, screening, laminin, neurosphere, personalized medicine
Glioblastoma multiforme (GBM) is the most deadly form of brain cancer. With a five-year survival rate of less than 4%,1 new approaches to treatment are necessary. The concept of precision, patient-specific medicines, administered on the basis of the molecular makeup of the individual patient tumor, has had success in other cancers. Even in the absence of a preselected molecular feature to target, the application of personalized medicine screening can be used to identify compounds that are selectively lethal to specific cell lines. This concept has been brought to fruition by large scale screening efforts of compound sensitivity among many cell lines with the National Cancer Institute screen of 60 human tumor cell lines (NCI60),2 Cancer Cell Line Encyclopedia (CCLE),3 and the Genomics of Drug Sensitivity in Cancer resource.4 Unfortunately, when predicting inhibitor sensitivity for GBM models, traditional cell lines and culture conditions do not allow for recapitulation of patient tumor physiology. Gene expression, single nucleotide polymorphisms, and copy number aberrations in established glioma lines are not representative of patient tumors,5 and not all traditional GBM cell lines are tumorigenic in mice.6 This situation makes the use of standard glioma lines for the prediction of genome-specific inhibition a challenging pursuit. Fortunately, the use of neurospheres, which are patient-derived, three-dimensional spheroids maintained in a serum-free environment with growth factors, has become increasingly common. In 2006, Fine and colleagues showed that neurospheres closely mirror the genotype and gene expression patterns of patient tumors.6 Dirks and colleagues pioneered a similar method, which also uses serum-free growth conditions supplemented with epidermal and fibroblast growth factors (EGF and FGF) to grow patient-derived glioblastoma cells as adherent cells with the addition of the basement membrane protein laminin.7 This method has also been shown to retain the molecular signature of patient tumors and is amenable to high-content screening.7
For the purpose of the application of personalized medicine, we wanted to screen patient-derived cells that closely mirror the genotype and gene expression patterns of patient tumors. However, neurospheres are usually tested only in low-throughput as confirmation against compounds that have already been determined to have activity using a previous high-throughput assay; the screening method using laminin-grown cells is high content, requiring sophisticated imaging equipment and analysis.8 To adequately determine differential sensitivity among cell models, dose–response curves are necessary, expanding the required data collection and prompting us to develop a high-throughput screen with a simple end point, but using patient-derived neurosphere and laminin-grown cell models.
Experimental Procedures
Cell Growth
Patient-derived GBM samples were obtained at Henry Ford Hospital and generated as previously described.9 At Columbia University, cells were defrosted and grown on regular tissue-culture-treated plates in serum-free neurosphere medium with growth factors EGF and FGF, and maintained by standard neurosphere culture.9 If the cells failed to grow, laminin was added at a concentration of 1 μL/cm2 directly to the flask. Laminin cultures were grown in the same medium as neurospheres.
High-Throughput Screening
Pathways involved in GBM were selected for small molecule inhibition. An emphasis was placed on compounds that are in clinical development or are FDA-approved for other cancers. Working with compounds already established as safe and effective, we foresaw faster translation of these results to patients. A list of compounds tested appears in Table S1.
Each screening sample was begun with freshly dissociated neurospheres or freshly detached laminin-supplemented cells. Inhibitor was added 24 h after cell seeding, and viability was assessed with CellTiter-Glo 72 h after inhibitor addition. Generally, except in some instances of low solubility, each inhibitor was added in a 17-point, 2-fold dilution series with a final concentration range of 0.8 nM–50 μM. Compounds that were not potent within the concentration range tested are denoted as EC50 > 50 μM. To compute fold change (Figure 3b and Table S4) and calculate the z-scores used for the heatmap in Figure 2, the value 100 μM was assigned to cases of EC50 > 50 μM. Extended methods can be found in the Supporting Information.
Figure 3.
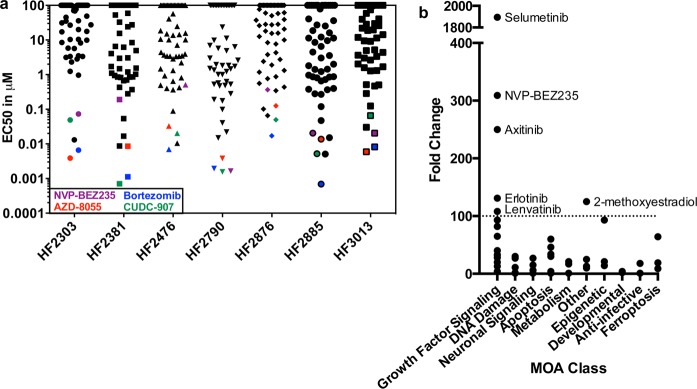
Results arranged by potency and fold change. (a) The EC50 values of every compound are plotted for each cell line. The overall most potent compounds, bortezomib, CUDC-907, NVP-BEZ235, and AZD-80355 are highlighted. (b) The fold change, the EC50 value of the most resistant cell line divided by the EC50 value of the most sensitive cell line, is plotted for each compound. Compounds with a fold change greater than 100 are highlighted.
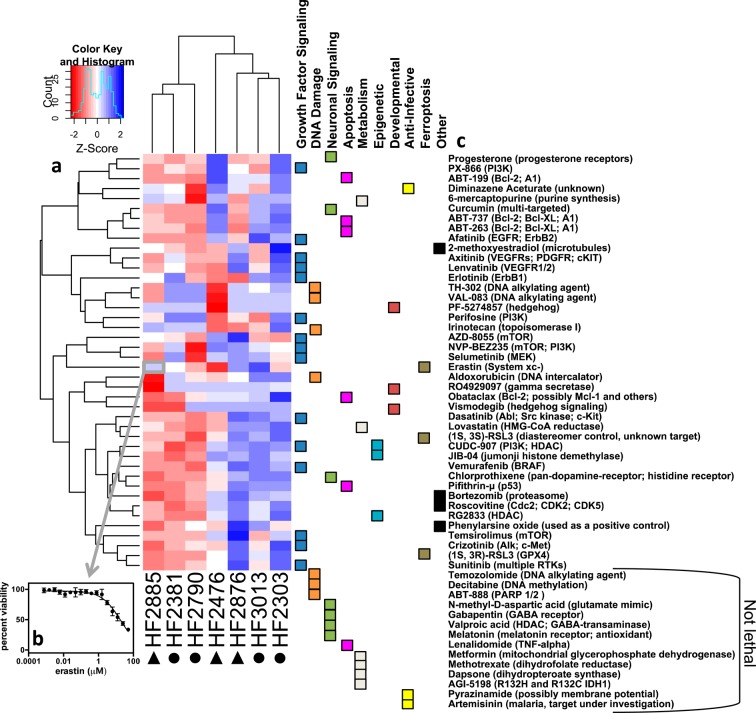
Figure 2.
Heatmap of cell line sensitivity. (a) Heatmap of the z-scores of the log10(EC50) value of each compound across all cell lines. Red indicates sensitivity, while blue indicates resistance. Circles indicate neurosphere-grown cell lines and triangles indicate laminin-grown lines. (b) Each box in the heatmap is representative of the z-score of an EC50 value, which has been generated from a 17-point dose–response curve. (c) The associated target of inhibition for each compound. Fourteen compounds that were not lethal to any cell lines, noted at the bottom of the list, were not included in the heatmap because a z-score could not be calculated.
Comparative Inhibitor Sensitivity with Cells Grown as Neurospheres and on Laminin
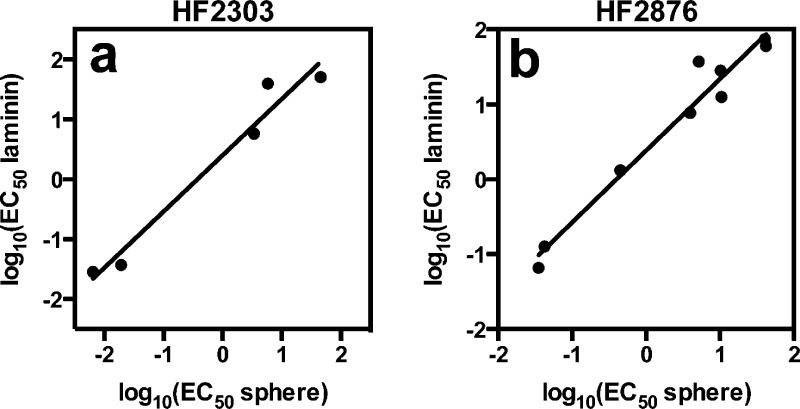
Some patient-derived cells failed to expand in neurosphere culture, but thrived under laminin supplementation. Therefore, we first examined whether laminin-supplemented cultures retained a similar compound sensitivity profile as neurospheres. We tested HF2303 cells, which grow best as neurospheres, and HF2876, which grow best on laminin in both growth conditions. For both HF2303 and HF2876, observed inhibitor potency changed less than 10-fold between conditions, with the majority of compounds exhibiting less than a 3-fold change in potency under the different culture conditions (Figure 1, Table S2, and Figure S1). Not shown in Figure 1 are the five of ten compounds that were not lethal to HF2303 at the concentrations tested and the two of 11 compounds that were not lethal to HF2876 in the tested concentration range, as these could not be compared. This observation suggests that inhibitor resistance is maintained, in addition to inhibitor sensitivity.
Figure 1.
Comparison of inhibitor sensitivity in patient-derived GBM cells grown as neurospheres or on laminin. (a) HF2303, which was routinely grown as neurospheres, R2 = 0.96, and (b) HF2876, which was routinely grown on laminin, R2 = 0.96. Values with 95% confidence intervals are listed in Table S2.
When the experimental results were combined into a single heatmap and subjected to hierarchical clustering (Figure 2a), the cell lines did not cluster as laminin grown versus neurosphere grown (circles beneath the cell line names indicate neurosphere lines and triangles indicate laminin lines). Furthermore, there is no apparent similarity in the inhibitor signature among the neurosphere grown or laminin grown cell lines. Thus, we concluded that growth on laminin or as neurospheres does not change compound sensitivity, and growth conditions can be used as needed for each cell line.
High-Throughput Screening Results
Cells were grown either as neurospheres (HF2303, HF2790, HF2381, HF3013) or on laminin (HF2476, HF2876, HF2885) and were subjected to 17-point dose–response curves to analyze differential sensitivity to compound treatment. All results were visualized in a heatmap (Figure 2). Each box of the heatmap is the z-score corresponding to the log of the EC50 for each cell-line–compound pair, in triplicate (Figure 2b). Therefore, over 20,000 data points were collected for the generation of this figure. Hierarchical clustering revealed that several compounds from the same mechanistic class clustered together (Figure 2c). For example, ABT-263, ABT-737, and ABT-199, which all target the antiapoptotic Bcl-2 protein, are found in a common cluster. Axitinib and lenvatinib, which both target VEGFRs, are clustered together, as are CUDC-907 and JIB-04, which both target histone modification. Hierarchical clustering was also applied to the cell lines. HF2885, HF2381, and HF2790 share a distinct cluster from the rest of the cell lines.
A set of compounds was broadly potent across all patient-derived GBM cells (Figure 3a). Bortezomib, a proteasome inhibitor that is FDA-approved for select hematologic malignancies,10 was the most potent inhibitor in three of the eight cell lines and was among the most potent three inhibitors for all compounds tested in all cell lines. EC50 values ranged from 0.7–17 nM. CUDC-907 was the second most potent compound on the basis of EC50, while the mTOR/PI3K (phosphoinositide 3-kinase) inhibitor NVP-BEZ235 and the mTORC1/mTORC2 inhibitor AZD-8055 were the next most potent. CUDC-907 is a dual PI3K/HDAC (histone deacetylase) inhibitor in Phase I clinical trials for lymphoma, multiple myeloma, advanced solid tumors, and relapsed solid tumors (NCT01742988, NCT02307240). Noteworthy is that three of the four most potent compounds target mTOR/PI3K signaling. Temozolomide, the standard of care in GBM treatment, was not lethal at 50 μM, the highest concentration tested. This result is in agreement with other studies that routinely use >100 μM temozolomide to induce cell death.11 Several compounds, including temozolomide and selumetinib, were tested in HF2476 and HF2876 with a secondary assay using PrestoBlue to confirm compound sensitivity (Table S5).
Other compounds exhibited >100-fold selectivity among GBM cell models (Figure 3b). Selumetinib, a MEK inhibitor under clinical investigation, was the most selective, with a 1894 difference in potency between the most sensitive cell line and the most resistant cell line. The growth factor signaling inhibitors were overall more selective among the cell models than any of the other classes of compounds (Figure 3b).
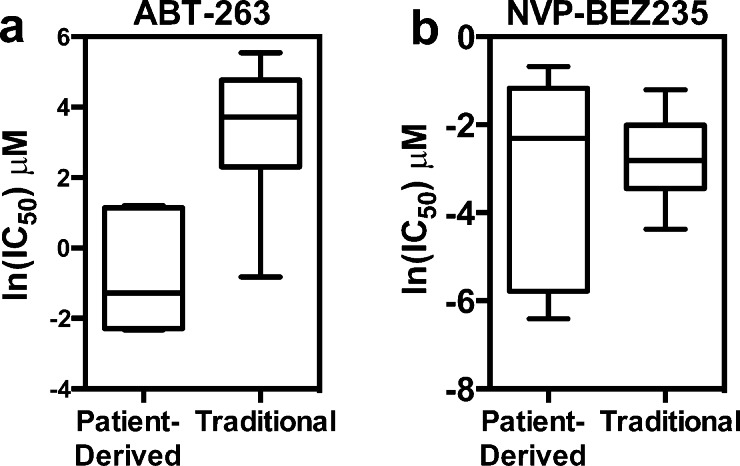
We compared the patient-derived GBM compound sensitivity data to publically available data from www.cancerrxgene.org.4 When comparing the sensitivity data of the patient-derived GBM cells to the traditionally grown glioma cell lines in this repository, we found an example in which the patient-derived cell lines were uniquely sensitive to ABT-263, and another example in which there was no observable difference, NVP-BEZ235 (Figure 4). Therefore, without using the patient-derived system, we may have missed the unique sensitivity of GBM to ABT-263.
Figure 4.
Comparison of patient-derived GBM cell line inhibitor sensitivity to traditionally-grown GBM cell lines. (a) ln(IC50) of ABT-263 in patient-derived GBM cell lines and traditional GBM cell lines. Using the Mann–Whitney test, P < 0.0001. (b) ln(IC50) of NVP-BEZ235 in patient-derived GBM cell lines and traditional GBM cell lines. Using the Mann–Whitney test, P = 0.6539. Another representation is shown in Figure S2.
Synergistic Inhibition by AZD-8055 and ABT-263
We next explored whether the compound sensitivity data could be used to identify synergistic compound combinations. We tested the combination of AZD-8055 with ABT-263 for three reasons: (1) previous literature demonstrated that AZD-8055 and ABT-263 synergize in BRAF and KRAS driven colorectal cancer,12 (2) AZD-8055 was among the most potent drugs in our screen, but approximately 20–30% of cells remained alive after drug treatment in most cases (Figure S3), and (3) an examination of the differential sensitivity of AZD-8055 and ABT-263 revealed that four cell lines were resistant to either ABT-263 or AZD-8055 (Figure 5a). Viability testing of the compounds independently and in combination against these four cell lines revealed that AZD-8055 and ABT-263 act synergistically in HF2476 and HF3013, while the response was not synergistic, and possibly antagonistic, in HF2303 and HF2876 (Figure 5b). Treatment of the cells with AZD-8055, an mTOR inhibitor, led to a decrease in phosphorylated S6 ribosomal protein, and treatment with ABT-263, a Bcl-2/Bcl-XL/A1 inhibitor, increased cleaved caspase 3 (Figure S4) indicating these compounds are acting on target. These data reveal a potential combination therapy to kill AZD-8055-resistant cells and amplify the effects of ABT-263 and AZD-8055 in a subset of patient tumors.
Figure 5.
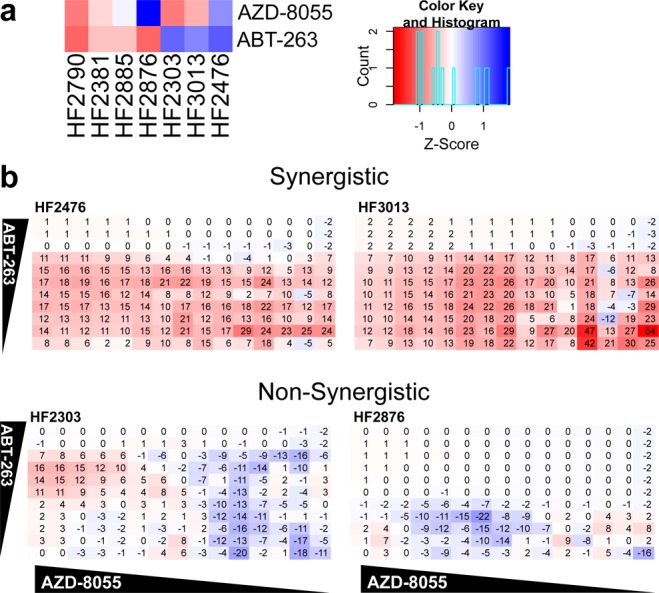
Combination treatment. (a) Comparison of AZD-8055 and ABT-263 treatment in all cell lines. Red indicates sensitivity, while blue indicates resistance. (b) Depiction of synergism where the values shown are excess over Bliss Independence, a prediction of inhibition without synergism.13,14 Increased synergism is evident by an increased number, shown in red, while negative numbers in blue represent an antagonistic effect.
The screening method presented here allowed us to screen four neurosphere models and three laminin-grown models against 56 compounds, in full dose–response curves in triplicate, targeting pathways implicated in GBM. Additionally, we tested an inhibitor combination of two compounds in a 15 × 11 matrix against four cell lines. This method, using common laboratory reagents, can be scaled up to allow for further screening of more compounds or against more cell lines to better capture the heterogeneity of patient GBMs. If a patient has a known effective treatment, one would predict that cell lines with similar sensitivity profiles from other patients might benefit from the same therapy, thus providing guidance for treatment of other patients. Furthermore, the pattern of sensitivities allows for an efficacy profile across a heterogeneous GBM population for new therapeutic agents. Combined with genetic characterization, this could lead to a large-scale analysis in which genomic features can be correlated in an unbiased manner with inhibitor sensitivity, leading to novel biomarkers for the pursuit of personalized GBM medicines.
In conclusion, we have developed a high-throughput screening method adaptable for patient-derived neurospheres and growth on laminin. A similar method could be employed for other cancers in which spheroid-based culture methods are the most relevant in vitro model. As personalized medicine becomes more prevalent, screening for differential sensitivity using physiologically relevant assays will be an essential component of therapeutic target identification.
Acknowledgments
We would like to thank Donald Lo for helpful project advice.
Glossary
ABBREVIATIONS
- GBM
glioblastoma multiforme
- PI3K
phosphoinositide 3-kinase
- HDAC
histone deacetylase
Supporting Information Available
Extended experimental methods. Neurosphere and laminin inhibitor sensitivity. Overlay of laminin/neurosphere growth curves. Comparison of patient-derived GBM cell line inhibitor sensitivity to www.CancerRxGene.org data. AZD-8055 growth curves. Western blot of AZD-8055 and ABT-263 treated cells. Confirmation of EC50 values with PrestoBlue. List of all compounds tested and targets. Full list of results arranged by potency. Full list of results arranged by fold change. Clinical information for patient-derived glioblastoma cell lines. The Supporting Information is available free of charge on the ACS Publications website at DOI: 10.1021/acsmedchemlett.5b00128.
Author Contributions
C.E.Q. and B.R.S designed experiments and wrote the manuscript. C.E.Q. and E.R. performed experiments. A.C.D. and T.M. provided patient-derived cells and instruction in specialized cell culture methods. All authors have given approval to the final version of the manuscript.
This work was supported by a grant from Accelerate Brain Cancer Cure (ABC2) to B.R.S and T.M. In addition, T.M. and A.C.D. are supported by the LIGHT Research Program at the Hermelin Brain Tumor Center. B.R.S. is an HHMI Early Career Scientist and is supported by grants from the US National Institutes of Health (5R01CA097061 and R01CA161061) and NYSTEM.
The authors declare no competing financial interest.
Supplementary Material
References
- Dolecek T. A.; Propp J. M.; Stroup N. E.; Kruchko C. CBTRUS Statistical Report: Primary Brain and Central Nervous System Tumors Diagnosed in the United States in 2005–2009. Neuro. Oncol. 2012, 14 (Suppl 5), v1–v49. 10.1093/neuonc/nos218. [DOI] [PMC free article] [PubMed] [Google Scholar]
- Shoemaker R. H. The NCI60 Human Tumour Cell Line Anticancer Drug Screen. Nat. Rev. Cancer 2006, 6 (10), 813–823. 10.1038/nrc1951. [DOI] [PubMed] [Google Scholar]
- Barretina J.; Caponigro G.; Stransky N.; Venkatesan K.; Margolin A. a; Kim S.; Wilson C. J.; Lehár J.; Kryukov G. V.; Sonkin D.; Reddy A.; Liu M.; Murray L.; Berger M. F.; Monahan J. E.; Morais P.; Meltzer J.; Korejwa A.; Jané-Valbuena J.; Mapa F. A.; Thibault J.; Bric-Furlong E.; Raman P.; Shipway A.; Engels I. H.; Cheng J.; Yu G. K.; Yu J.; Aspesi P.; de Silva M.; Jagtap K.; Jones M. D.; Wang L.; Hatton C.; Palescandolo E.; Gupta S.; Mahan S.; Sougnez C.; Onofrio R. C.; Liefeld T.; MacConaill L.; Winckler W.; Reich M.; Li N.; Mesirov J. P.; Gabriel S. B.; Getz G.; Ardlie K.; Chan V.; Myer V. E.; Weber B. L.; Porter J.; Warmuth M.; Finan P.; Harris J. L.; Meyerson M.; Golub T. R.; Morrissey M. P.; Sellers W. R.; Schlegel R.; Garraway L. a. The Cancer Cell Line Encyclopedia Enables Predictive Modelling of Anticancer Drug Sensitivity. Nature 2012, 483 (7391), 603–607. 10.1038/nature11003. [DOI] [PMC free article] [PubMed] [Google Scholar]
- Garnett M. J.; Edelman E. J.; Heidorn S. J.; Greenman C. D.; Dastur A.; Lau K. W.; Greninger P.; Thompson I. R.; Luo X.; Soares J.; Liu Q.; Iorio F.; Surdez D.; Chen L.; Milano R. J.; Bignell G. R.; Tam A. T.; Davies H.; Stevenson J. A.; Barthorpe S.; Lutz S. R.; Kogera F.; Lawrence K.; McLaren-Douglas A.; Mitropoulos X.; Mironenko T.; Thi H.; Richardson L.; Zhou W.; Jewitt F.; Zhang T.; O’Brien P.; Boisvert J. L.; Price S.; Hur W.; Yang W.; Deng X.; Butler A.; Choi H. G.; Chang J. W.; Baselga J.; Stamenkovic I.; Engelman J. A.; Sharma S. V.; Delattre O.; Saez-Rodriguez J.; Gray N. S.; Settleman J.; Futreal P. A.; Haber D. a; Stratton M. R.; Ramaswamy S.; McDermott U.; Benes C. H. Systematic Identification of Genomic Markers of Drug Sensitivity in Cancer Cells. Nature 2012, 483 (7391), 570–575. 10.1038/nature11005. [DOI] [PMC free article] [PubMed] [Google Scholar]
- Li A.; Walling J.; Kotliarov Y.; Center A.; Steed M. E.; Ahn S. J.; Rosenblum M.; Mikkelsen T.; Zenklusen J. C.; Fine H. A. Genomic Changes and Gene Expression Profiles Reveal That Established Glioma Cell Lines Are Poorly Representative of Primary Human Gliomas. Mol. Cancer Res. 2008, 6 (1), 21–30. 10.1158/1541-7786.MCR-07-0280. [DOI] [PubMed] [Google Scholar]
- Lee J.; Kotliarova S.; Kotliarov Y.; Li A.; Su Q.; Donin N. M.; Pastorino S.; Purow B. W.; Christopher N.; Zhang W.; Park J. K.; Fine H. A. Tumor Stem Cells Derived from Glioblastomas Cultured in bFGF and EGF More Closely Mirror the Phenotype and Genotype of Primary Tumors than Do Serum-Cultured Cell Lines. Cancer Cell 2006, 9 (5), 391–403. 10.1016/j.ccr.2006.03.030. [DOI] [PubMed] [Google Scholar]
- Pollard S. M.; Yoshikawa K.; Clarke I. D.; Danovi D.; Stricker S.; Russell R.; Bayani J.; Head R.; Lee M.; Bernstein M.; Squire J. A.; Smith A.; Dirks P. Glioma Stem Cell Lines Expanded in Adherent Culture Have Tumor-Specific Phenotypes and Are Suitable for Chemical and Genetic Screens. Cell Stem Cell 2009, 4 (6), 568–580. 10.1016/j.stem.2009.03.014. [DOI] [PubMed] [Google Scholar]
- Danovi D.; Folarin A. A.; Baranowski B.; Pollard S. M. High Content Screening of Defined Chemical Libraries Using Normal and Glioma-Derived Neural Stem Cell Lines. Methods Enzymol. 2012, 506, 311–329. [DOI] [PubMed] [Google Scholar]
- Hasselbach L. A.; Irtenkauf S. M.; Lemke N. W.; Nelson K. K.; Berezovsky A. D.; Carlton E. T.; Transou A. D.; Mikkelsen T.; deCarvalho A. C. Optimization of High Grade Glioma Cell Culture from Surgical Specimens for Use in Clinically Relevant Animal Models and 3D Immunochemistry. J. Visualized Exp. 2014, 83, e51088. 10.3791/51088. [DOI] [PMC free article] [PubMed] [Google Scholar]
- Chen D.; Frezza M.; Schmitt S.; Kanwar J.; P Dou Q. Bortezomib as the First Proteasome Inhibitor Anticancer Drug: Current Status and Future Perspectives. Curr. Cancer Drug Targets 2011, 11 (3), 239–253. 10.2174/156800911794519752. [DOI] [PMC free article] [PubMed] [Google Scholar]
- Beier D.; Schulz J. B.; Beier C. P.. Chemoresistance of Glioblastoma Cancer Stem Cells--Much More Complex than Expected Mol. Cancer 2011, 10 ((128)), . [DOI] [PMC free article] [PubMed]
- Faber A. C.; Coffee E. M.; Costa C.; Dastur A.; Ebi H.; Hata A. N.; Yeo A. T.; Edelman E. J.; Song Y.; Tam A. T.; Boisvert J. L.; Milano R. J.; Roper J.; Kodack D. P.; Jain R. K.; Corcoran R. B.; Rivera M. N.; Ramaswamy S.; Hung K. E.; Benes C. H.; Engelman J. A. mTOR Inhibition Specifically Sensitizes Colorectal Cancers with KRAS or BRAF Mutations to BCL-2/BCL-XL Inhibition by Suppressing MCL-1. Cancer Discovery 2014, 4 (1), 42–52. 10.1158/2159-8290.CD-13-0315. [DOI] [PMC free article] [PubMed] [Google Scholar]
- Keith C. T.; Borisy A. A.; Stockwell B. R. Multicomponent Therapeutics for Networked Systems. Nat. Rev. Drug Discovery 2005, 4 (1), 71–78. 10.1038/nrd1609. [DOI] [PubMed] [Google Scholar]
- Bliss C. I. The Toxicity of Poisons Applied Joints. Ann. Appl. Biol. 1939, 26 (3), 585–615. 10.1111/j.1744-7348.1939.tb06990.x. [DOI] [Google Scholar]
Associated Data
This section collects any data citations, data availability statements, or supplementary materials included in this article.


