

Significance
Widely available accurate estimates of malaria exposure are essential for targeting and evaluation of public health interventions. Antibody responses to the malaria parasite can provide information on past exposure, but to date, most such measurements have been based on responses to a small number of parasite proteins chosen by convenience rather than utility and have not provided quantitative information on an individual’s exposure. Our results generated by screening hundreds of responses in children with known exposure histories indicate that responses to a few appropriately selected antigens can provide such information. This new approach can be transformed into high-throughput, low-cost, field-based assays useful for surveillance of malaria and has the potential to be translated into similar tools for other infectious diseases.
Keywords: Plasmodium falciparum malaria, antigen discovery, serology, immunoepidemiology, epidemiology
Abstract
Tools to reliably measure Plasmodium falciparum (Pf) exposure in individuals and communities are needed to guide and evaluate malaria control interventions. Serologic assays can potentially produce precise exposure estimates at low cost; however, current approaches based on responses to a few characterized antigens are not designed to estimate exposure in individuals. Pf-specific antibody responses differ by antigen, suggesting that selection of antigens with defined kinetic profiles will improve estimates of Pf exposure. To identify novel serologic biomarkers of malaria exposure, we evaluated responses to 856 Pf antigens by protein microarray in 186 Ugandan children, for whom detailed Pf exposure data were available. Using data-adaptive statistical methods, we identified combinations of antibody responses that maximized information on an individual’s recent exposure. Responses to three novel Pf antigens accurately classified whether an individual had been infected within the last 30, 90, or 365 d (cross-validated area under the curve = 0.86–0.93), whereas responses to six antigens accurately estimated an individual’s malaria incidence in the prior year. Cross-validated incidence predictions for individuals in different communities provided accurate stratification of exposure between populations and suggest that precise estimates of community exposure can be obtained from sampling a small subset of that community. In addition, serologic incidence predictions from cross-sectional samples characterized heterogeneity within a community similarly to 1 y of continuous passive surveillance. Development of simple ELISA-based assays derived from the successful selection strategy outlined here offers the potential to generate rich epidemiologic surveillance data that will be widely accessible to malaria control programs.
Many countries have extensive programs to reduce the burden of Plasmodium falciparum (Pf), the parasite responsible for most malaria morbidity and mortality (1). Effectively using limited resources for malaria control or elimination and evaluating interventions require accurate measurements of the risk of being infected with Pf (2–15). To reflect the rate at which individuals are infected with Pf in a useful way, metrics used to estimate exposure in a community need to account for dynamic changes over space and time, especially in response to control interventions (16–18).
A variety of metrics can be used to estimate Pf exposure, but tools that are more precise and low cost are needed for population surveillance. Existing metrics have varying intrinsic levels of precision and accuracy and are subject to a variety of extrinsic factors, such as cost, time, and availability of trained personnel (19). For example, entomological measurements provide information on mosquito to human transmission for a community but are expensive, require specially trained staff, and lack standardized procedures, all of which reduce precision and/or make interpretation difficult (19–22). Parasite prevalence can be measured by detecting parasites in the blood of individuals from a cross-sectional sample of a community and is, therefore, relatively simple and inexpensive to perform, but results may be imprecise, especially in areas of low transmission (19, 23), and biased by a number of factors, including immunity and access to antimalarial treatment (5, 6, 19, 23–25). The burden of symptomatic disease in a community can be estimated from routine health systems data; however, such data are frequently unreliable (5, 26–28) and generally underestimate the prevalence of Pf infection in areas of intense transmission. Precise and quantitative information about exposure at an individual level can be reliably obtained from cohort studies by measuring the incidence of asymptomatic and/or symptomatic Pf infection (i.e., by measuring the molecular force of infection) (29–35). Unfortunately, the expense of cohort studies limits their use to research settings. The end result is that most malaria-endemic regions lack reliable, timely data on Pf exposure, limiting the capabilities of malaria control programs to guide and evaluate interventions.
Serologic assays offer the potential to provide incidence estimates for symptomatic and asymptomatic Pf infection, which are currently obtained from cohort studies, at the cost of cross-sectional studies (36–38). Although Pf infections are transient, a record of infection remains detectable in an individual’s antibody profile. Thus, appropriately chosen antibody measurements integrated with age can provide information about an individual’s exposure history. Antibodies can be measured by simple ELISAs and obtained from dried blood spots, which are easy to collect, transport, and store (39–41). Serologic responses to Pf antigens have been explored as potential epidemiological tools (42–45), and estimated rates of seroconversion to well-characterized Pf antigens accurately reflect stable rates of exposure in a community, whereas distinct changes in these rates are obtained from successful interventions (22, 39, 41, 46–53). However, current serologic assays are not designed to detect short-term or gradual changes in Pf exposure or measure exposure to infection at an individual level. The ability to calibrate antibody responses to estimates of exposure in individuals could allow for more flexible sampling of a population (e.g., not requiring age stratification), improve accuracy of exposure estimates from small sample sizes, and better characterize heterogeneity in exposure within a community.
Different Pf antigens elicit antibody responses with different magnitudes and kinetics, providing a large and diverse set of potential biomarkers for exposure (38, 54–58). We hypothesized that new and more highly informative serologic biomarkers better able to characterize an individual’s recent exposure history could be identified by analyzing antibody responses to a large number of candidate Pf antigens in participants with well-characterized exposure histories. To test this hypothesis, we probed plasma from participants in two cohort studies in Uganda against a protein microarray containing 856 Pf antigens. The primary aim of this analysis was to identify responses to select antigens that were most informative of recent exposure using robust, data-adaptive statistical methods. Each participant’s responses to these selected antigens were used as predictors for two primary outcomes of their recent exposure to Pf: (i) days since last Pf infection and (ii) the incidence of symptomatic malaria in the last year. These individual-level estimates were then aggregated across a population to assess community-level malaria exposure. The selection strategy presented here identified accurate biomarkers of exposure for children living in areas of moderate to high Pf exposure and illustrates the utility of this flexible and broadly applicable approach.
Results
Study Populations and Clinical Outcomes.
Participants consisted of 186 children from cohort studies in two districts of Uganda: Kanungu, where transmission is moderate (annual entomological inoculation rate = 27), and Tororo, where transmission is intense (annual entomological inoculation rate = 125) (59). All participants were followed by active and passive surveillance for at least 1 y before the collection of the plasma samples analyzed here, allowing evaluation of recent exposure. Consistent with the higher intensity of Pf exposure in Tororo, 95% of participants from this site were infected with Pf in the last year, whereas only 64% of Kanungu participants had an infection detected (Table 1). Tororo participants had, on average, a higher incidence of malaria in the last year (median = 7.8 episodes per person-year) than participants from Kanungu (median = 1.1 episodes per person-year). Similarly, among participants who had a Pf infection detected in the previous year, participants from Tororo were more recently infected with Pf (median = 28 d before the date of plasma collection) than those living in Kanungu (median = 264 d).
Table 1.
Descriptive statistics of the study sites and participants
| Characteristic | Kanungu | Tororo |
| No. of participants | 107 | 79 |
| Median age, y (range) | 5.2 (3.1–6.8) | 4.0 (3.9–4.4) |
| Female sex (%) | 51 | 42 |
| Median monthly female Anophelene counts per household, n (range) | 2 (0–29) | n/a |
| Median malaria incidence in the last year, ppy (range) | 1.1 (0.0–8.5) | 7.8 (0.0–19.0) |
| Parasitemic at time of sample collection, n (%) | 9 (8) | 13 (16) |
| Median Pf density at time of sample collection* (range) | 12,800 (64–68,240) | 53,340 (2,880–247,700) |
| Participants having at least one infection in the last 30 d, n (%) | 20 (19) | 43 (54) |
| Participants having at least one infection in the last 90 d, n (%) | 37 (35) | 64 (81) |
| Participants having at least one infection in the last 365 d, n (%) | 69 (64) | 75 (95) |
| Median days since last Pf infection† (range) | 264 (0–340) | 28 (0–332) |
n/a, not available; ppy, per person-year.
Only participants who were parasitemic at the time of sample collection were included.
Only participants who had at least one Pf infection recorded in the previous year were included.
Pf-Specific Antibody Profiles Showed Decreased Responses with Increased Days Since Infection.
Of 856 Pf antigen probes on the microarray, 655 met the minimal antibody reactivity criteria for inclusion (Dataset S1). Recent infection with Pf was associated with greater breadth and intensity of response [P < 0.001 for Spearman’s correlations between both breadth (r = −0.72) and intensity (r = −0.52) and days since last infection]. Notably, the overall breadth and intensity of anti-Pf antibody responses were comparable between the two sites among participants whose days since last Pf infection were similar (Fig. 1). As such, data from both sites were combined for all subsequent analyses. Visualization of individual participants’ antibody profiles across sites showed increased antibody reactivity in participants who were more recently infected (Fig. 2). Linear regression showed that mean antibody response decreased significantly over time after Pf infection (R2 = 0.23, P < 0.001), consistent with published findings (57, 58, 60–66).
Fig. 1.

Breadth and intensity of antibody responses decrease with days since infection. Breadth of response for each participant was calculated as the percentage of antibody responses that were reactive (at least 2 SDs above malaria-naïve controls) to 655 included Pf antigens. Mean intensity for each participant was calculated from normalized intensities of antibody responses. Breadth of responses did not significantly differ between participants from the two sites after stratified by days since infection, although participants from Tororo were, on average, more recently infected. Intensity of responses also did not differ, except for in participants who were not infected with Pf within the last year (P = 0.008, Mann–Whitney test with Bonferroni correction).
Fig. 2.

Heat maps of intensities of antibody responses to all 655 reactive Pf antigens show that responses are generally higher in participants who were most recently infected. Among participants who did not have an infection detected in the year before sample collection, the oldest participants had higher overall responses.
Antibody Responses Most Predictive of an Individual’s Exposure to Pf.
To identify antibody responses to Pf antigens that were most informative of an individual’s recent exposure to Pf, a flexible prediction method that made few assumptions about the nature of the relationship between Pf exposure and antibody intensity (details in Materials and Methods) was used to algorithmically identify top candidate antigens and model the ability of responses to the selected antigens to predict exposure. Our goal was to identify Pf antigens inducing antibody responses that combined produced the best predictions of an individual’s (i) days since last Pf infection and (ii) incidence of symptomatic malaria in the last year. To ensure unbiased estimates of prediction accuracy, the entire process—including antibody selection and model selection and fitting—was automated and cross-validated. In other words, for every participant, predicted exposure was calculated based on choosing antibody responses and fitting their relationship to exposure in other participants, resulting in a conservative estimate of prediction accuracy.
Although the microarray approach used in this study allowed us to screen responses to a large number of Pf antigens, ideally, information regarding exposure could be generated from responses to a limited number of antigens. To determine the tradeoff between the number of responses measured and the accuracy in predicting an individual’s prior exposure, we evaluated R2 values when allowing the model to select between 1 and 30 antibody responses measured as either continuous (antibody intensity) or binary (reactive vs. nonreactive) variables (Fig. 3). Because microscopy is often performed during cross-sectional surveys, we evaluated the information serology provided in addition to whether the participant had parasites detectable by microscopy at the time of sampling. Microscopy together with continuous antibody responses to a single selected antigen explained more than 60% of the variance in predicting days since an individual was last infected, whereas data from microscopy alone explained only 20% of the variance (Fig. 3). Microscopy together with continuous responses to three antigens explained 66% of the variance, and only marginal improvements in prediction accuracy were obtained when responses to additional antigens were included. When dichotomized, responses to a single antigen provided less information than those based on continuous measurements, but this loss of information could be compensated for by adding additional antigens; prediction accuracy was similar for continuous and binary data after responses to at least 20 antigens were included. Randomly selected dichotomized antibody responses also provided information but not nearly as efficiently, with continuous responses to 1 algorithmically selected antigen providing more accurate predictions than binary responses to 30 randomly selected antigens. Predicting the incidence of symptomatic malaria in the prior year using data on participants’ age combined with responses to increasing numbers of Pf antigens produced analogous results, although binary and continuous responses to selected antigens provided similar information, and maximum accuracy was not reached until six responses were included. Together, these data indicate that accurate predictions of an individual’s recent exposure to malaria can be obtained from measuring antibody responses to a small number of selected antigens.
Fig. 3.

Relationship between prediction accuracy and antibody responses to the number of Pf antigens included in the prediction model. The y axis indicates accuracy of cross-validated predictions measured as R2 or percentage of variance explained in the outcome being predicted. (Left) Models predicting days since last infection used baseline microscopy results and antibody response data to 0 (microscopy only) to 30 antigens. (Right) Models predicting malaria incidence in the last year used each participant’s age and antibody response data to 0 (age only) to 30 antigens. Antibody responses selected based on their ability to predict the outcome in the training set (selected) performed better than antigens chosen at random (random), despite selection and prediction being performed on independent sets of samples. Antibody responses evaluated as continuous variables performed better than binary responses for days since infection but similarly for incidence predictions.
Responses to the top antigens selected for predicting both exposure metrics in individuals were generally high and followed the expected trend (P < 0.001 for Spearman’s correlation between both exposure metrics and mean intensity of responses to the top 10 antigens) of increased intensity in participants with higher exposure (Fig. 4 and Figs. S1 and S2); 6 of the top 10 responses identified as most predictive of days since last infection were also identified as highly predictive of malaria incidence (Table 2), which is not surprising given that these two metrics of exposure are closely related. Of note, among responses commonly used in the past to evaluate an individual’s exposure [apical membrane antigen 1 (AMA1), merozoite surface protein 1 (MSP1), MSP2, and circumsporozoite protein (CSP)] (37, 40, 66–69), none were within the top 10 responses predictive of days since infection in this setting, and only MSP2 and CSP were within the top 10 responses predictive of malaria incidence in our participants. Additional characteristics of proteins targeted by the most informative antibody responses are provided in Tables S1 and S2.
Fig. 4.

Mean intensity of antibody responses for participants grouped by exposure outcome: (A) days since last infection (0 to <30 d, n = 59; 30 to <90 d, n = 42; 90–365 d, n = 43; no Pf infection detected in the last year, n = 42) and (B) malaria incidence in the last year (0, n = 47; 1 to <2, n = 39; 2 to <5, n = 42; 5 to <8, n = 34; ≥8, n = 24). (Right) Responses against the top 10 antigens selected for each exposure metric were highly immunogenic and showed more consistent associations with exposure by design than (Left) overall responses. Spearman’s ρ values for correlations between the exposure metric and an individual’s mean antibody response to the set of antigens indicated are presented in each plot.
Fig. S1.

(A) Intensity of antibody responses to the top 10 Pf antigens predicting days since last infection decreases over time. Each boxplot’s title indicates rank, gene identification, and annotation. (B) Days since a participant was last infected with Pf were estimated from linear models that included microscopy and responses to one of these top 10 antigens as covariates. Based on these predictions, ROC curves classified whether individuals were infected within the last 30, 90, and 365 d. Areas under the curve (AUCs) were calculated for each ROC curve.
Fig. S2.

(A) Intensity of antibody responses to each of the top 10 Pf antigens predicting malaria incidence in the last year increase with increasing exposure. Each boxplot’s title indicates rank, gene identification, and annotation. (B) For each participant, incidence last year was estimated from linear models that included age and responses to one of these top 10 antigens as covariates. Predicted incidences for each participant were averaged across subjects from each study site to calculate population mean incidences for Kanungu and Tororo. Observed population mean incidence was 1.5 cases per person-year in Kanungu and 7.1 cases per person-year in Tororo.
Table 2.
Most informative serologic markers of malaria exposure
| Rank | Gene identification | Description |
| Antigens predicting days since an individual was last infected with Pf | ||
| 1 | PF3D7_1002000* | Plasmodium exported protein, hyp2 |
| 2 | PF3D7_0402400 | Plasmodium exported protein, GEXP18 |
| 3 | PF3D7_1106300* | Exonuclease, putative |
| 4 | PF3D7_0711700 | Erythrocyte membrane protein 1 |
| 5 | PF3D7_0800300* | Erythrocyte membrane protein 1 |
| 6 | PF3D7_0501100.1 | Heat shock protein 40, type II |
| 7 | PF3D7_0423700* | Early transcribed membrane protein 4 |
| 8 | PF3D7_1020800* | Dihydrolipoamide acyltransferase component E2 |
| 9 | PF3D7_0731600* | Acyl-CoA synthetase |
| 10 | PF3D7_1002100 | PF70 protein, PF70 |
| Antigens predicting an individual’s malaria incidence in the last year | ||
| 1 | PF3D7_1002000* | Plasmodium exported protein, hyp2 |
| 2 | PF3D7_1020800* | Dihydrolipoamide acyltransferase component E2 |
| 3 | PF3D7_0731600* | Acyl-CoA synthetase |
| 4 | PF3D7_0532100 | Early transcribed membrane protein 5 |
| 5 | PF3D7_0801000 | Plasmodium exported protein |
| 6 | PF3D7_0304600 | CSP |
| 7 | PF3D7_0206800 | MSP2 |
| 8 | PF3D7_0800300* | Erythrocyte membrane protein 1 |
| 9 | PF3D7_1106300* | Exonuclease, putative |
| 10 | PF3D7_0423700* | Early transcribed membrane protein 4 |
Antigen was within the top 10 for predicting both days since last infection and malaria incidence in the last year.
Table S1.
Gene ontology of antigens selected for predicting days since an individual was last infected with Pf
| Rank | Gene identification | Description | Stage expressed* | Cellular component† | Function | |||||||||
| L | S | IE | M | G | HC | MC | CS | I | A | SCV | ||||
| 1 | PF3D7_1002000 | Plasmodium exported protein, hyp2 | X | X | X | X | ||||||||
| 2 | PF3D7_0402400 | Plasmodium exported protein, GEXP18 | X | X | X | X | Nucleotide binding | |||||||
| 3 | PF3D7_1106300 | Exonuclease, putative | X | X | Exonuclease activity; nucleic acid binding | |||||||||
| 4 | PF3D7_0711700 | Erythrocyte membrane protein 1 | X | X | X | X | Cell adhesion molecule binding; receptor activity; antigenic variation | |||||||
| 5 | PF3D7_0800300 | Erythrocyte membrane protein 1 | X | X | X | Cell adhesion molecule binding; receptor activity; antigenic variation | ||||||||
| 6 | PF3D7_0501100.1 | Heat shock protein 40, type II | X | X | X | X | X | Heat shock protein binding; unfolded protein binding | ||||||
| 7 | PF3D7_0423700 | Early transcribed membrane protein 4 | X | X | X | |||||||||
| 8 | PF3D7_1020800 | Dihydrolipoamide acyltransferase component E2 | X | X | X | Dihydrolipoyllysine residue acetyltransferase activity; pyruvate dehydrogenase (acetyl-transferring) activity | ||||||||
| 9 | PF3D7_0731600 | Acyl-CoA synthetase | X | X | X | X | AMP binding; long-chain fatty acid-CoA ligase activity; catalytic activity | |||||||
| 10 | PF3D7_1002100 | PF70 protein | X | X | X | |||||||||
| Top 20 | PF3D7_0223300 | Erythrocyte membrane protein 1 | ||||||||||||
| PF3D7_0532100 | Early transcribed membrane protein 5 | X | X | |||||||||||
| PF3D7_0702300 | Sporozoite threonine and asparagine-rich protein | X | X | X | X | |||||||||
| PF3D7_0800200 | Erythrocyte membrane protein 1 | X | X | X | X | X | Cell adhesion molecule binding; receptor activity; antigenic variation | |||||||
| PF3D7_0801000 | Plasmodium exported protein | X | X | X | X | |||||||||
| PF3D7_0936300 | Ring-exported protein 3 | X | X | |||||||||||
| PF3D7_1033200 | Early transcribed membrane protein 10.2 | X | X | X | X | X | ||||||||
| PF3D7_1129100 | Parasitophorous vacuolar protein 1 | X | X | X | X | X | GTPase activator activity; protein binding | |||||||
| PF3D7_1300300 | Erythrocyte membrane protein 1 | X | X | X | X | Cell adhesion molecule binding; receptor activity; antigenic variation | ||||||||
| PF3D7_1353100 | Plasmodium exported protein | X | X | X | X | |||||||||
| Top 30 | PF3D7_0304600 | CSP | X | X | ||||||||||
| PF3D7_0414700 | GTP binding protein, putative | X | X | X | GTP binding; ferrous iron transmembrane transporter activity | |||||||||
| PF3D7_0420700 | Erythrocyte membrane protein 1 | X | X | X | Cell adhesion molecule binding; receptor activity; antigenic variation | |||||||||
| PF3D7_0532400 | Plasmodium exported protein, PHISTb | X | X | X | ||||||||||
| PF3D7_0620400 | MSP10 | X | X | X | X | Attachment of GPI anchor to protein | ||||||||
| PF3D7_0808600 | Erythrocyte membrane protein 1 | X | X | X | Cell adhesion molecule binding; receptor activity; antigenic variation | |||||||||
| PF3D7_1024800 | Conserved Plasmodium protein | X | X | X | X | X | X | Hydrolase activity | ||||||
| PF3D7_1133400 | AMA1 | X | X | X | X | X | Host cell surface binding; protein binding | |||||||
| PF3D7_1438100 | Secretory complex protein 62 | X | X | X | X | X | X | Protein binding; protein transporter activity; intracellular signal transduction | ||||||
| PF3D7_1477500 | Plasmodium exported protein | X | X | X | ||||||||||
GPI, glycosylphosphatidylinositol.
Stage expressed by mass specification: liver (L), sporozoite (S), intraerythrocytic (IE), merozoite (M), and gametocyte (G).
Cellular component: exported to host cell (HC), Maurer’s cleft (MC), membrane/cell surface (CS), intracellular/cytoplasm/nucleus (I), apicoplast (A), and symbiont-containing vacuole (SCV).
Table S2.
Gene ontology of antigens selected for predicting an individual’s malaria incidence in the last year
| Rank | Gene identification | Description | Stage expressed* | Cellular component† | Function | |||||||||
| L | S | IE | M | G | HC | MC | CS | I | A | SCV | ||||
| 1 | PF3D7_1002000 | Plasmodium exported protein, hyp2 | X | X | X | X | ||||||||
| 2 | PF3D7_1020800 | Dihydrolipoamide acyltransferase component E2 | X | X | X | Dihydrolipoyllysine-residue acetyltransferase activity; pyruvate dehydrogenase (acetyl-transferring) activity | ||||||||
| 3 | PF3D7_0731600 | Acyl-CoA synthetase | X | X | X | X | AMP binding; long-chain fatty acid-CoA ligase activity; catalytic activity | |||||||
| 4 | PF3D7_0532100 | Early transcribed membrane protein 5 | X | X | ||||||||||
| 5 | PF3D7_0801000 | Plasmodium exported protein, PHISTc | X | X | X | X | ||||||||
| 6 | PF3D7_0304600 | CSP | X | X | ||||||||||
| 7 | PF3D7_0206800 | MSP2 | X | X | X | Attachment of GPI anchor to protein; cell adhesion | ||||||||
| 8 | PF3D7_0800300 | Erythrocyte membrane protein 1 | X | X | X | Cell adhesion molecule binding; receptor activity; antigenic variation | ||||||||
| 9 | PF3D7_1106300 | exonuclease, putative | X | X | Exonuclease activity; nucleic acid binding | |||||||||
| 10 | PF3D7_0423700 | Early transcribed membrane protein 4 | X | X | X | |||||||||
| Top 20 | PF3D7_0207000 | MSP4 | X | |||||||||||
| PF3D7_0402400 | Plasmodium exported protein, GEXP18 | X | X | X | X | Nucleotide binding | ||||||||
| PF3D7_0501100.1 | Heat shock protein 40, type II | X | X | X | X | X | Heat shock protein binding; unfolded protein binding | |||||||
| PF3D7_0532400 | Plasmodium exported protein, PHISTb | X | X | X | ||||||||||
| PF3D7_0702300 | Sporozoite threonine and asparagine-rich protein, | X | X | X | X | |||||||||
| PF3D7_0711700 | Erythrocyte membrane protein 1 | X | X | X | X | Cell adhesion molecule binding; receptor activity; antigenic variation | ||||||||
| PF3D7_0936300 | Ring-exported protein 3 | X | X | |||||||||||
| PF3D7_1002100 | PF70 protein | X | X | X | ||||||||||
| PF3D7_1036400 | Liver stage antigen 1 | X | ||||||||||||
| PF3D7_1129100 | Parasitophorous vacuolar protein 1 | X | X | X | X | X | GTPase activator activity; protein binding | |||||||
| Top 30 | PF3D7_0223300 | Erythrocyte membrane protein 1 | ||||||||||||
| PF3D7_0620400 | MSP10 | X | X | X | X | |||||||||
| PF3D7_0800200 | Erythrocyte membrane protein 1 | X | X | X | X | X | Cell adhesion molecule binding; receptor activity; antigenic variation | |||||||
| PF3D7_0930300 | MSP1 | X | X | X | X | X | X | Attachment of GPI anchor to protein; pathogenesis | ||||||
| PF3D7_1024800 | Conserved Plasmodium protein | X | X | X | X | X | X | Hydrolase activity | ||||||
| PF3D7_1100800 | Maurer’s cleft two transmembrane protein | X | X | X | X | Translocation of peptides or proteins into host | ||||||||
| PF3D7_1133400 | AMA1 | X | X | X | X | X | Host cell surface binding; protein binding | |||||||
| PF3D7_1300300 | Erythrocyte membrane protein 1 | X | X | X | X | Cell adhesion molecule binding; receptor activity; antigenic variation | ||||||||
| PF3D7_1401400 | Early transcribed membrane protein 14.1 | X | X | X | X | |||||||||
| PF3D7_1410400 | Rhoptry-associated protein 1 | X | X | X | X | X | ||||||||
GPI, glycosylphosphatidylinositol.
Stage expressed by mass specification: liver (L), sporozoite (S), intraerythrocytic (IE), merozoite (M), and gametocyte (G).
Cellular component: exported to host cell (HC), Maurer’s cleft (MC), membrane/cell surface (CS), intracellular/cytoplasm/nucleus (I), apicoplast (A), and symbiont-containing vacuole (SCV).
Accuracy of Selected Responses in Predicting Exposure in Specific Cases.
One valuable way a serologic assay could be used by a malaria control program would be to determine whether individuals had been infected with Pf in the recent past. To investigate the ability of selected antibody responses to correctly classify an individual as being infected within the last 30, 90, or 365 d, we compared each individual’s actual infection status in that timeframe with cross-validated predictions of days since infection using microscopy and continuous responses to three antigens. Receiver operating characteristic (ROC) curves showed that measuring these responses accurately classified recent infection status for all three timeframes (Fig. 5) (cross-validated area under the ROC curve ranged from 0.86 to 0.93). Because selection of responses was cross-validated, the responses measured in each participant were selected in a different group of individuals, and there was some stochastic variation in which three responses were used for predictions in any given participant. This variation allowed for unbiased and generalizable estimation of prediction accuracy, and selection closely followed the ranking in Table 2. Similar results were obtained when linear models that included microscopy and responses to the top three antigens (PF3D7_1002000, PF3D7_0402400, and PF3D7_1106300) as predictors were used to estimate days since an individual was last infected (Fig. 5).
Fig. 5.
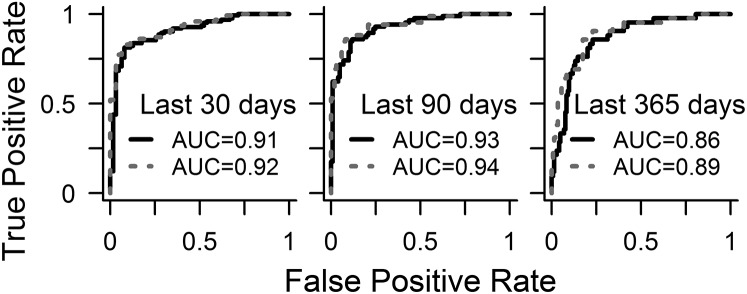
ROC curves for predictions of days since infection using responses to three antigens and microscopy data were able to accurately classify whether an individual was infected within the last 30, 90, or 365 d as indicated by the high area under the curve (AUC) values. Solid lines represent SuperLearner predictions, in which both antigen selection and model fitting were cross-validated; dashed lines represent predictions from linear models, in which the included antigens (PF3D7_1002000, PF3D7_0402400, and PF3D7_1106300) were preselected as the top three most predictive of days since last infection. An AUC of 0.5 indicates a classifier that performs no better than random, whereas an AUC of 1 indicates a perfect classifier.
Accurate predictions of recent exposure for multiple individuals obtained from serology can be aggregated to estimate average recent exposure in a community. Taking the average of cross-validated predictions of malaria incidence for each individual from Kanungu or Tororo, which were obtained by measuring continuous responses to six antigens at a single time point, was an excellent indicator of observed incidence in the last year at that site (predicted vs. actual cases per person-year were 1.1 [95% confidence interval (95% CI) = 0.9–1.3] vs. 1.5 [95% CI = 1.1–1.8] in Kanungu and 5.4 [95% CI = 4.8–5.9] vs. 7.1 [95% CI = 6.1–8.0] in Tororo). To extrapolate the potential for serology to estimate malaria incidence by testing small numbers of participants from communities with varying exposure, actual participants were sampled to represent testing 20 or 100 individuals from a community, with a mean observed incidence ranging from 0.5 to 4.0 cases per person-year. Mean predicted incidence was calculated using serology data from the same individuals in each sampled community. These simulations indicated that measuring antibody responses to a few antigens in a small subset of a community has the potential to provide accurate data on exposure (Fig. 6).
Fig. 6.

Representative communities with population mean malaria incidences ranging from 0.5 to 4.0 episodes per person-year were created by subsampling actual study participants after Poisson distributions. Analyses of actual participant data for individuals assigned to each of these simulated communities showed that serologic analysis of a small number of individuals produced accurate predictions of mean incidence for the community. Predicted community incidences were aggregated from cross-validated estimates for each individual, which were produced using antibody responses to six antigens. More details are available in Materials and Methods.
A third use of individual-level estimates of exposure obtained from a serologic assay would be to identify heterogeneity in recent exposure within a community. Household global positioning system (GPS) coordinates were collected for each participant in Kanungu, and elevation data for each household were used as a proxy for malaria exposure. In Kanungu, elevation was significantly correlated with the substantial variation in monthly household female Anophelene catches (P < 0.001 for Spearman’s correlation), with households at lower elevations in the north of the district having higher numbers of mosquitoes driving malaria transmission (Fig. 7). Mean mosquito counts were significantly higher in 36 households below 1,100 m compared with 35 houses above this elevation (7.8 vs. 2.0; P < 0.001 for Mann–Whitney test). Each individual’s malaria incidence in the last year—as measured by passive surveillance—followed a geographic pattern that was also significantly correlated with household elevation (P < 0.001 for Spearman’s correlation), with measured incidence significantly higher among participants living in houses below vs. above 1,100 m (2.2 vs. 0.8 cases per person-year; P = 0.001 for Mann–Whitney test). Similarly, predicted incidence in the last year—based on responses to six antigens from a single cross-sectional sample from each individual—correlated well with household elevation (P < 0.001 for Spearman’s correlation) and was able to detect geographic heterogeneity in exposure, predicting 1.4 vs. 0.9 cases per person-year in houses below and above 1,100 m, respectively (P = 0.005 for Mann–Whitney test). Predictions of incidence based on serology correlated more tightly with elevation than observed incidence measurements, possibly because an individual’s incidence of malaria is confounded by the interplay between exposure and immunity (Fig. 7B). Although accurate fine-scale assessments of geographic heterogeneity require denser sampling than was carried out here, these results indicate that individual incidence predictions from serology may be used to map out the heterogeneous distribution of malaria across a community.
Fig. 7.

(A) Geographic heterogeneity in Pf exposure is captured by serologic predictions of incidence. (Left) Average monthly counts of female Anopheline mosquitos, (Center) observed malaria incidence over 1 y, and (Right) cross-validated predictions of incidence using antibody responses to six antigens taken at a single time point are plotted for each study household in Kanungu, Uganda, with colors indicating the tertile for each household. Some households contain more than one included study participant; in these cases, the household mean is plotted for observed and predicted incidence. Small black dots represent households that were not sampled. (B) Scatterplots of (Left) household elevation (a proxy for Pf exposure) vs. mean mosquito counts and (Center) observed or (Right) predicted malaria incidence in the last year. All three metrics are significantly associated with elevation (P < 0.001 for Spearman’s correlation). Individuals residing in households at low elevations but having no episodes of clinical malaria in the last year are likely highly exposed and immune; serologic predictions of incidence suggest that these individuals were, in fact, exposed to Pf.
Performance of Selected Antigens in a Different Population.
We used previously published array data from 94 Malian children (70) ages 2–7 y old to determine whether the antigens selected in our Ugandan cohorts could also estimate an individual’s exposure to malaria in a different population. Of note, this separate validation set represents individuals with different genetic backgrounds living in a different epidemiologic setting comprised of highly seasonal malaria transmission. Only plasma samples collected at the end of the 6-mo malaria season were included in the analysis. The Mali array contained 4 of the top 10 antigens (PF3D7_0711700, PF3D7_0800300, PF3D7_0501101.1, and PF3D7_0731600) inducing responses best able to predict days since last infection in Ugandan children. These four antigens were also highly immunogenic in Malian children (Fig. 8A). Responses to these antigens were more closely associated with days since infection than overall responses (r = −0.39, P < 0.001 vs. r = −0.24, P = 0.02 for Spearman’s correlations between days since infection and mean response to top vs. all antigens), similar to what was seen in Ugandan children and providing additional support for the generalizability of our approach. Estimated days since last Pf infection obtained from linear models using microscopy data and responses to one antigen (PF3D7_0711700) as predictors were able to classify an individual as being infected within the last 30 or 90 d (Fig. 8B). Note that, because 96% of this cohort was infected in the prior year, we did not classify individuals by whether they were infected within the last 365 d.
Fig. 8.

Plasma samples from Malian children were used to probe microarrays that contained 4 of the top 10 antigens inducing responses in Ugandan children that were predictive of days since last infection. (A) Mean intensity of antibody responses in Malian participants grouped by days since last infection (0 to <30 d, n = 47; 30 to <90 d, n = 41; >90 d, n = 6). (Right) Responses to antigens within the top 10 selected in Ugandans were highly immunogenic in Malian participants and also showed more consistent associations with exposure than (Left) overall responses. Spearman’s ρ for correlations between an individual’s days since last Pf infection and mean antibody response to the set of antigens indicated are presented in each plot. (B) ROC curves for predictions of days since infection from linear models using one antigen (PF3D7_0711700) and microscopy data were able to classify whether an individual from Mali was infected within the last 30 or 90 d. AUC, area under the curve.
Discussion
With the limited resources available for malaria control and elimination, it is imperative to be able to accurately and efficiently evaluate malaria exposure in different communities, so that these resources can be used carefully and in a targeted way. In this study, we show the utility of an innovative approach to identify a number of promising and novel serologic biomarkers of recent Pf exposure. Detailed individual histories of Pf infection obtained from cohort participants were used to select the most informative antibody responses to hundreds of antigen candidates using data-adaptive statistical models. Our results, confirmed through rigorous cross-validation, show that accurate predictions of an individual’s exposure history can be produced by measuring antibody responses to just a few Pf antigens selected using this approach. Evaluation in multiple scenarios suggests that these serologic data are capable of providing precise and accurate estimates of exposure for individuals and communities.
Serologic surveys have been used to estimate Pf exposure for over 40 y. With the push toward elimination and the advent of standardized assays and analytical approaches, such as evaluating rates of seroconversion to specific Pf antigens, serology has recently become more attractive as an epidemiologic tool (22, 36, 39, 41–53, 71, 72). The antigenic targets for such assays have been mostly limited to a small set of readily available recombinant proteins, generally selected for recognition by high titers of antibodies in immune individuals and not for their ability to provide quantitative information regarding exposure (73, 74). Recent studies have evaluated responses to multiple antigens simultaneously, suggesting that certain responses may be more informative of exposure in particular settings (58, 75, 76). A fundamental distinction between prior efforts and the approach taken in this study is that, here, recent Pf exposure in individuals was used to identify the most informative antibody responses among hundreds of candidates. This approach allowed for accurate quantitative calibration of the relationships between identified responses and independent measures of exposure in individuals in contrast to the coarser population-level relationships established by existing serology assays. The power of obtaining these individual-level estimates is illustrated by their ability to accurately identify individuals with infection in the recent past, with recent defined by relevant thresholds spanning 1 y, obtain precise estimates of malaria incidence in a community from cross-sectional samples from as few as 20 individuals, and accurately estimate heterogeneity in recent exposure within a community using data from a single time point.
A commonly perceived limitation of the protein array platform used in this study is the use of an Escherichia coli-based cell-free expression system, in which some conformational epitopes may not be presented because of improper protein folding. Although this limitation may have resulted in the lack of identification of some potential biomarkers, this concern is largely mitigated by the ability to screen hundreds of responses simultaneously, many of which likely provide similar information. Indeed, the identification of antigen targets that may be subsequently easier to produce is of potential benefit. Furthermore, although some potential biomarkers may have been missed, our results suggest that increasing the number of antigens beyond a few good candidates may be unnecessary. Of note, the array used in this study also included purified, validated recombinant proteins for commonly used antigens, such as AMA1 and MSP1, at a wide range of dilutions, and none of these constructs were identified as among the most informative in our study.
Importantly, although the approach for discovery outlined here should be generalizable to a broad range of exposure settings and age ranges, the specific serologic biomarkers identified may not be as useful in other transmission contexts. Additional evaluation is needed to assess whether the serologic biomarkers identified here are cross-reactive with other Plasmodium species (38) and whether the genetic background of parasites in certain areas may affect responses to selected antigens, which are currently based on the Pf3D7 strain reference sequence (77). Interestingly, among the top 38 antigens predictive of exposure, 7 map to PfEMP1 proteins, and at least 5 more are predicted to be exported (Tables S1 and S2), indicating that genetic variation between Pf strains may be an important factor to consider. However, consistent with the previously published finding that intracellular domains of PfEMP1 proteins are more highly recognized by antibodies than hypervariable extracellular fragments (78), all seven PfEMP1 peptide fragments selected in our cohorts correspond to highly conserved intracellular domains. It will be of interest in future studies to evaluate the relative contribution of measuring responses to different variants of particular antigens in evaluating exposure (77).
Additionally, dynamics of antibody acquisition and maintenance vary based on exposure intensity and age; thus, the degree to which some serologic biomarkers predict exposure will likely vary in these contexts (39, 57, 75, 79). Our study only evaluated participants ages 3–7 y old living in two areas of Uganda with moderate or high transmission and ages 2–7 y old living in an area with intense seasonal transmission in Mali. The Pf biomarkers identified here are likely to be of value in similar settings but require additional validation in these settings and age groups and others. In particular, assessment of serologic responses in communities before and after implementation of malaria control measures will be needed to validate the utility of responses in evaluating the impact of these interventions. Replicating the approach outlined here in a broader array of epidemiologic settings will provide an efficient means of identifying a set or sets of biomarkers appropriate across these contexts.
If the validation approaches above can be confirmed, additional steps are then needed to translate the novel biomarkers identified here and in future studies into high-throughput serologic assays for routine surveillance (38). Detailed characterization of the kinetics of identified responses within individuals over time will enable development of more tailored and precise statistical models to estimate recent exposure in contrast to the more flexible techniques used here for biomarker identification (80–83). Target antigens will need to be expressed as standardized, purified reagents to allow for consistent measurement of responses. Finally, simple, inexpensive assay platforms (e.g., based on ELISA or portable lateral flow devices) will need to be optimized to allow serologic assessments of malaria exposure to be performed on field samples, such as dried blood spots or whole blood obtained from finger pricks in appropriate settings. Simple assays derived from such an approach have the potential to generate rich epidemiologic surveillance data that would be widely accessible to malaria control programs.
The potential to obtain more accurate estimates of Pf exposure from small sample sizes makes the already promising use of serology as a key malaria surveillance tool more attractive. In areas requiring wide-scale malaria control, collecting national serologic data (e.g., as part of a malaria indicator survey) could improve targeting of control interventions to broad areas with the highest exposure risk. In areas of lower transmission, focal surveys could allow for interventions targeted to smaller-scale hotspots at the level of villages or groups of households (69, 84). In settings nearing malaria elimination, serology could identify individuals infected in the recent past, allowing identification of geographic or demographic risk factors and ultimately, certifying that elimination has occurred (85, 86). Finally, repeated evaluation of recent exposure over time could be used to assess the impact of control interventions in reducing exposure and detect reintroduction of Pf transmission after local elimination.
In addition to their utility in surveillance, serologic estimates of exposure can provide a valuable research tool. Because it is difficult to measure protection against malaria without knowing the underlying rate of infection, studies of naturally acquired or vaccine-induced immunity are confounded by heterogeneous Pf exposure (87–91). The ability to estimate an individual’s recent exposure at the beginning of a study and/or rates of infection during follow-up would be useful in assessing protection. To be valuable in this context, consideration would need to be taken to identify biomarkers of exposure not directly involved in mediating immune protection or not strongly influenced by blood-stage immunity. Additionally, serologic outcomes may provide a cost-effective means for measuring the effect of new interventions on a study population, especially when it is not practical to perform detailed, continuous clinical or parasitological surveillance of all participants. Given the broad utility of serology, identifying the serologic biomarkers that provide the most accurate estimates of exposure seems a worthwhile investment.
Materials and Methods
Ethical Approval.
Written informed consent was obtained from the parents or guardians of all study participants. Ethical approval was obtained from the Uganda National Council of Science and Technology and the Institutional Review Boards of the University of California, San Francisco, Makerere University, and the Centers for Disease Control and Prevention. The Tororo Child Cohort (TCC) is registered at ClinicalTrials.gov (NCT00527800).
Study Sites, Participants, and Clinical End Points.
Samples for this investigation were obtained from Ugandan children enrolled in either the TCC Study or the Kanungu site of the Program for Resistance, Immunology, and Surveillance of Malaria Cohort Study. For all children included in this analysis, follow-up was complete for the year before sample collection. The details of these two longitudinal studies have been described elsewhere (92, 93). Briefly, the TCC Study was conducted from 2007 to 2012 in Tororo, a rural district in southeastern Uganda with intense perennial transmission (59, 94), where children were enrolled in infancy and followed until 5 y of age. For this study, we included all children born to HIV-negative mothers who remained in the study until 4 y of age and for whom a plasma sample within 4 mo of the participant’s fourth birthday was available (all collected from November of 2010 to November of 2011). The Program for Resistance, Immunology, and Surveillance of Malaria Study took place from 2011 to 2013 in the Kihihi subcounty of Kanungu, a rural district in southwestern Uganda with moderate seasonal transmission (93). For this study, we included all children in the cohort who were 3–7 y of age after 1 y of follow-up and had plasma available at this time point (July of 2012 to September of 2012). For Kanungu participants, GPS coordinates of households were recorded, and female Anophelene mosquito counts for each house were determined by monthly Centers for Disease Control and Prevention light trap counts (59).
Children at both Ugandan study sites were followed for all medical problems with continuous passive surveillance. Children who presented with a documented fever (≥38.0 °C) or history of fever in the previous 24 h had blood obtained by finger prick for a thick smear. If the thick smear was positive for asexual Pf parasites, the patient was diagnosed with malaria and given artemisinin-based combination therapy. In addition, active surveillance for parasitemia by thick smear was performed monthly in Tororo and one time every 3 mo in Kanungu; children were not treated for parasitemia if asymptomatic. For each participant, malaria incidence in the previous year was calculated as the number of symptomatic malaria episodes occurring 365 d before sample collection; 14 d of follow-up were removed from total time at risk after every treatment with antimalarial medication. Days since last infection were calculated as the number of days before the date of plasma collection when Pf parasites were most recently detected, if at all, in the prior year. When an individual’s last detected infection was asymptomatic and a negative smear was obtained in the visit immediately before, a date falling directly between these two visit dates was used to account for differences in the active surveillance sampling frames between the two sites. For participants who were infected within the 2 wk before plasma collection, recorded days since last infection were set to 14 to account for the boosting of antibody responses immediately after an infection.
Protein Microarray Chip Fabrication, Probing, and Data Normalization.
In total, 856 antigens corresponding to 520 unique Pf proteins were selected for inclusion based on associations with exposure and immunogenicity in larger microarray studies conducted at the University of California, Irvine (70, 95, 96); 40 of these antigen probes were dilutions of 12 unique purified Pf proteins (97, 98), but none of these probes were selected as informative biomarkers of exposure in any analysis. ORFs from Pf3D7 reference sequences were derived from the Plasmodium genomic sequence database (www.plasmodb.org) for the remaining 816 recombinant protein probes on the array. Fabrication of protein microarrays involved (i) PCR amplification of each complete or partial Pf ORF, (ii) in vivo recombination cloning in E. coli, (iii) in vitro transcription/translation, and (iv) microarray chip printing. Peptide antigens ranged from 50 to 1,013 aa in length, with a median of 572 aa in length. Processing of plasma samples, which included a 1/200 dilution in buffer containing E. coli lysate, and production and probing of arrays to quantify total IgG intensities (ODs) have been described previously (70).
Data analyses were performed with R 3.1.0 (99). After subtracting slide background, mean empty E. coli vector (no DNA, where an empty plasmid vector was placed into the transcription/translation reaction) intensity was subtracted from each spot to adjust for any cross-reaction effects from the E. coli vector used to print the arrays. Next, intensities for each spot underwent inverse hyperbolic sine transformation to yield a Gaussian distribution while avoiding the normalization properties of the variance stabilizing normalization. Because individual microarray slides or sample pads might be brighter or darker than others during scanning, leading to biased estimates of antibody intensity, data were normalized after transformation using the robust linear model (RLM) (100, 101). Essentially, a robust statistical model using the “sandwich estimator” was fit to the data to estimate fixed effects for each slide and each pad based on the negative (no DNA) and positive (human IgG) control probes. Estimates of the slide and pad effects from the RLM were then subtracted from each probe’s intensity to remove any variation solely caused by differences among the slides or pads. After RLM normalization, the data were further normalized using a generalized additive model to minimize nonlinear differences in antibody intensity detected between two batches of slides parameterized on a third batch of slides containing a subset of samples from the first two batches. Visual inspection of principle components on samples from all three batches indicated that normalized results showed no appreciable batch effect. Only antigen fragment spots for which transformed and normalized intensity values were higher than 2 SDs above the mean of transformed and normalized no DNA control spot intensities were analyzed further. Normalized microarray data are found in Dataset S2.
Breadth and Intensity of Antibody Responses.
In total, 201 nonreactive Pf antigens, for which fewer than 10% of Ugandan children had responses at least 1 SD above the mean intensity of 28 Pf-naïve adults from North America, were removed from additional analysis. The 655 reactive Pf antigens included in analyses are listed in Dataset S1. Antibody response data were dichotomized, with antibody intensities at least 2 SDs above the mean intensity of Pf-naïve controls considered to be reactive. For each participant, the breadth of the antibody response was calculated as the proportion of reactive responses against 655 Pf antigens included in the analysis. Additionally, the mean intensity of the antibody response against each of 655 reactive antigens was calculated for each participant. Bonferroni-corrected Mann–Whitney tests were used to compare mean breadth and intensity of response among participants stratified by days since last infection.
Identification and Evaluation of Responses Informative of Exposure.
To evaluate how informative responses to each Pf antigen were at estimating recent malaria exposure both alone and combined, we modeled the ability of these antibody responses to predict two different metrics of an individual’s Pf exposure: (i) days since last infection and (ii) incidence of malaria in the prior year. Separate models estimating each log-transformed outcome were fit using the SuperLearner algorithm (87, 102–104), which was chosen to balance two requirements: (i) that relationships between antibody responses and Pf exposure be allowed to reflect natural, possibly nonlinear relationships as closely as possible, thus best reflecting the information present in antibody responses, and (ii) that the entire process was fully automated, specifying the modeling procedure a priori to allow for cross-validation and avoiding introduction of bias created by manually choosing the best-fitting model procedure. In addition to antibody responses to 655 reactive antigens, microscopy at the time of sample collection was included as a covariate in models predicting log days since last infection, and age of participants was included as a covariate in models predicting log malaria incidence in the last year.
The SuperLearner is a flexible, data-adaptive ensembling approach that minimizes assumptions by allowing a potentially large number of candidate models to be evaluated, and it makes predictions based on the weighted average of estimates from each component model. Nested within this framework, top antibody responses were selected before model fitting. The number of antibody responses selected was prespecified for each model: models that incremented between selecting 1 and 30 responses were fit to evaluate the additional information obtained by allowing responses to a larger number of antigens to be chosen. Responses to top antigens were chosen using hierarchical criteria: first, lasso regression (105) was used to identify one-third of the responses chosen to work combined to predict exposure; second, the remaining responses were selected by iteratively choosing the best response as ranked by variable importance measures from random forest regression (106) and then choosing the best response as ranked by P values from Spearman’s correlations with exposure. After feature selection, the SuperLearner predicted exposure (either log days since last infection or log incidence in the prior year) for each individual using a weighted average of five models: conventional multiple regression with all selected covariates in the model, lasso regression, random forests, support vector machines (107), and neural networks (108). Weights for each component model in the SuperLearner were calculated by nonnegative least squares regression, minimizing the cross-validated risk of the final estimator (103, 104).
To produce unbiased estimates of prediction accuracy, the entire SuperLearner process—including feature selection and model fitting—was automated and cross-validated; 20-fold cross-validation was used, in which the dataset was divided into 20 mutually exclusive subsets of as nearly equal size as possible, and 19 subsets were then used for training the estimators, with predictions made on the hold-out validation set used to assess the performance of these estimators. This process of subsetting the data into different training and validation sets was repeated a total of 20 times to produce cross-validated predictions of the exposure metric for each individual. Note that, because the feature selection procedure was performed 20 different times as part of each cross-validation process, it is possible that different subsets of individuals had models fit using responses to different antigens selected as covariates. SuperLearner cross-validated predictions of exposure for each individual were used as the primary means by which we evaluated prediction accuracy and comprise all predictions in the results unless otherwise noted (e.g., where illustrating the prediction accuracy of a specific antibody response). R2 values to evaluate prediction accuracy for each of two exposure metrics in individuals were calculated as , where represents the actual value of the exposure metric (days since infection or incidence of malaria) for individual , and represents the cross-validated prediction for that individual.
ROC curves (109) were used to evaluate the performance of models for classifying whether an individual was infected within a given time period. Correlations between entomologic data and actual or predicted incidence were determined using Spearman’s rank correlation. After stratifying Kanungu participants’ households by elevation, Mann–Whitney tests were used to compare mean female Anophelene catches, incidence, and incidence predictions from serology in households at low vs. high elevation.
To estimate the precision and accuracy of community estimates of exposure at various sample sizes, 5,000 representative communities were created by subsampling actual study participants. Each individual participant had a measured incidence and a cross-validated prediction of incidence generated from a SuperLearner model using six antibody responses as described above. Participants were sampled with replacement, such that true individual incidences within the simulated community followed a Poisson distribution and the simulated communities had a range of population mean malaria incidences (0.5–4.0 episodes per person-year). Mean predicted incidence for each simulated community was calculated by averaging incidence predictions for each individual within a simulated community.
Previously published clinical and microarray data from Malian participants (70) were used to evaluate the performance of selected responses in a different study population. Only plasma samples from participants ages 2–7 y old collected at the end of the 6-mo malaria season were included in this secondary analysis. Participants were followed for ∼8 mo before sample collection. Microarray data were normalized as previously described (70), and linear models were used to evaluate the ability of responses selected in Ugandan participants to estimate exposure in the Malian population.
Supplementary Material
Acknowledgments
We thank the individuals who participated in this study and their families. We also thank Rie Sasaki, Li Liang, and Jozelyn Pablo for cloning and generating the microarray data, Robin Anders and Christine Langer for providing recombinant proteins, and Nathan Woody for image production. We thank the study team and the Makerere University–University of California, San Francisco Research Collaboration and Infectious Diseases Research Collaboration for administrative and technical support. This research has been supported by the President’s Emergency Plan for AIDS Relief through Centers for Disease Control and Prevention Cooperative Agreement Number OCCU024421, the NIH as part of International Centers of Excellence in Malaria Research Program U19AI089674, and the Doris Duke Charitable Foundation. J.S. and P.D.C. are supported by the Division of Intramural Research, National Institute of Allergy and Infectious Diseases, NIH. J.G.B. was supported by the National Health and Medical Research Council of Australia. B.G. is the recipient of a Doris Duke Clinical Scientist Development Award. The Burnet Institute is supported by National Health and Medical Research Council Independent Research Institutes Infrastructure Support Scheme and a Victoria State Government Operational Infrastructure Support Grant.
Footnotes
The authors declare no conflict of interest.
This article is a PNAS Direct Submission. J.C.R. is a guest editor invited by the Editorial Board.
Data deposition: The microarray data reported in this paper can be found in Dataset S2.
This article contains supporting information online at www.pnas.org/lookup/suppl/doi:10.1073/pnas.1501705112/-/DCSupplemental.
References
- 1.Mendis K, et al. From malaria control to eradication: The WHO perspective. Trop Med Int Health. 2009;14(7):802–809. doi: 10.1111/j.1365-3156.2009.02287.x. [DOI] [PubMed] [Google Scholar]
- 2.Woolhouse ME, et al. Heterogeneities in the transmission of infectious agents: Implications for the design of control programs. Proc Natl Acad Sci USA. 1997;94(1):338–342. doi: 10.1073/pnas.94.1.338. [DOI] [PMC free article] [PubMed] [Google Scholar]
- 3.Carter R, Mendis KN, Roberts D. Spatial targeting of interventions against malaria. Bull World Health Organ. 2000;78(12):1401–1411. [PMC free article] [PubMed] [Google Scholar]
- 4.Carter R. Spatial simulation of malaria transmission and its control by malaria transmission blocking vaccination. Int J Parasitol. 2002;32(13):1617–1624. doi: 10.1016/s0020-7519(02)00190-x. [DOI] [PubMed] [Google Scholar]
- 5.Smith DL, Dushoff J, Snow RW, Hay SI. The entomological inoculation rate and Plasmodium falciparum infection in African children. Nature. 2005;438(7067):492–495. doi: 10.1038/nature04024. [DOI] [PMC free article] [PubMed] [Google Scholar]
- 6.Smith DL, Guerra CA, Snow RW, Hay SI. Standardizing estimates of the Plasmodium falciparum parasite rate. Malar J. 2007;6:131. doi: 10.1186/1475-2875-6-131. [DOI] [PMC free article] [PubMed] [Google Scholar]
- 7.Cibulskis RE, et al. Estimating trends in the burden of malaria at country level. Am J Trop Med Hyg. 2007;77(6) Suppl:133–137. [PubMed] [Google Scholar]
- 8.Hay SI, Smith DL, Snow RW. Measuring malaria endemicity from intense to interrupted transmission. Lancet Infect Dis. 2008;8(6):369–378. doi: 10.1016/S1473-3099(08)70069-0. [DOI] [PMC free article] [PubMed] [Google Scholar]
- 9.Kelly-Hope LA, McKenzie FE. The multiplicity of malaria transmission: A review of entomological inoculation rate measurements and methods across sub-Saharan Africa. Malar J. 2009;8:19. doi: 10.1186/1475-2875-8-19. [DOI] [PMC free article] [PubMed] [Google Scholar]
- 10.Coleman M, et al. Using the SaTScan method to detect local malaria clusters for guiding malaria control programmes. Malar J. 2009;8(1):68. doi: 10.1186/1475-2875-8-68. [DOI] [PMC free article] [PubMed] [Google Scholar]
- 11.Moonen B, et al. Operational strategies to achieve and maintain malaria elimination. Lancet. 2010;376(9752):1592–1603. doi: 10.1016/S0140-6736(10)61269-X. [DOI] [PMC free article] [PubMed] [Google Scholar]
- 12.Bousema T, et al. Hitting hotspots: Spatial targeting of malaria for control and elimination. PLoS Med. 2012;9(1):e1001165. doi: 10.1371/journal.pmed.1001165. [DOI] [PMC free article] [PubMed] [Google Scholar]
- 13.Bousema T, et al. The impact of hotspot-targeted interventions on malaria transmission: Study protocol for a cluster-randomized controlled trial. Trials. 2013;14(1):36. doi: 10.1186/1745-6215-14-36. [DOI] [PMC free article] [PubMed] [Google Scholar]
- 14.Sturrock HJW, et al. Reactive case detection for malaria elimination: Real-life experience from an ongoing program in Swaziland. PLoS One. 2013;8(5):e63830. doi: 10.1371/journal.pone.0063830. [DOI] [PMC free article] [PubMed] [Google Scholar]
- 15.WHO 2013 WHO World Malaria Report 2013. Available at www.who.int/malaria/publications/world_malaria_report_2013/report/en/. Accessed September 25, 2014.
- 16.Akachi Y, Atun R. Effect of investment in malaria control on child mortality in sub-Saharan Africa in 2002-2008. PLoS One. 2011;6(6):e21309. doi: 10.1371/journal.pone.0021309. [DOI] [PMC free article] [PubMed] [Google Scholar]
- 17.O’Meara WP, Mangeni JN, Steketee R, Greenwood B. Changes in the burden of malaria in sub-Saharan Africa. Lancet Infect Dis. 2010;10(8):545–555. doi: 10.1016/S1473-3099(10)70096-7. [DOI] [PubMed] [Google Scholar]
- 18.Oduro AR, et al. Seroepidemiological and parasitological evaluation of the heterogeneity of malaria infection in the Gambia. Malar J. 2013;12:222. doi: 10.1186/1475-2875-12-222. [DOI] [PMC free article] [PubMed] [Google Scholar]
- 19.Tusting LS, Bousema T, Smith DL, Drakeley C. Measuring changes in Plasmodium falciparum transmission: Precision, accuracy and costs of metrics. In: Rollinson D, editor. Advances in Parasitology. Academic; London: 2014. pp. 151–208. [DOI] [PMC free article] [PubMed] [Google Scholar]
- 20.Hay SI, Rogers DJ, Toomer JF, Snow RW. Annual Plasmodium falciparum entomological inoculation rates (EIR) across Africa: Literature survey, Internet access and review. Trans R Soc Trop Med Hyg. 2000;94(2):113–127. doi: 10.1016/s0035-9203(00)90246-3. [DOI] [PMC free article] [PubMed] [Google Scholar]
- 21.Mbogo CM, et al. Spatial and temporal heterogeneity of Anopheles mosquitoes and Plasmodium falciparum transmission along the Kenyan coast. Am J Trop Med Hyg. 2003;68(6):734–742. [PubMed] [Google Scholar]
- 22.Wong J, et al. Standardizing operational vector sampling techniques for measuring malaria transmission intensity: Evaluation of six mosquito collection methods in western Kenya. Malar J. 2013;12:143. doi: 10.1186/1475-2875-12-143. [DOI] [PMC free article] [PubMed] [Google Scholar]
- 23.O’Meara WP, Collins WE, McKenzie FE. Parasite prevalence: A static measure of dynamic infections. Am J Trop Med Hyg. 2007;77(2):246–249. [PMC free article] [PubMed] [Google Scholar]
- 24.Hay SI, Snow RW. The Malaria Atlas Project: Developing global maps of malaria risk. PLoS Med. 2006;3(12):e473. doi: 10.1371/journal.pmed.0030473. [DOI] [PMC free article] [PubMed] [Google Scholar]
- 25.Gething PW, et al. A new world malaria map: Plasmodium falciparum endemicity in 2010. Malar J. 2011;10(1):378. doi: 10.1186/1475-2875-10-378. [DOI] [PMC free article] [PubMed] [Google Scholar]
- 26.Trape JF, Rogier C. Combating malaria morbidity and mortality by reducing transmission. Parasitol Today. 1996;12(6):236–240. doi: 10.1016/0169-4758(96)10015-6. [DOI] [PubMed] [Google Scholar]
- 27.Ghani AC, et al. Loss of population levels of immunity to malaria as a result of exposure-reducing interventions: Consequences for interpretation of disease trends. PLoS One. 2009;4(2):e4383. doi: 10.1371/journal.pone.0004383. [DOI] [PMC free article] [PubMed] [Google Scholar]
- 28.Cibulskis RE, Aregawi M, Williams R, Otten M, Dye C. Worldwide incidence of malaria in 2009: Estimates, time trends, and a critique of methods. PLoS Med. 2011;8(12):e1001142. doi: 10.1371/journal.pmed.1001142. [DOI] [PMC free article] [PubMed] [Google Scholar]
- 29.Bekessy A, Molineaux L, Storey J. Estimation of incidence and recovery rates of Plasmodium falciparum parasitaemia from longitudinal data. Bull World Health Organ. 1976;54(6):685–693. [PMC free article] [PubMed] [Google Scholar]
- 30.Singer B, Cohen JE. Estimating malaria incidence and recovery rates from panel surveys. Math Biosci. 1980;49(3-4):273–305. [Google Scholar]
- 31.Beier JC, et al. Plasmodium falciparum incidence relative to entomologic inoculation rates at a site proposed for testing malaria vaccines in western Kenya. Am J Trop Med Hyg. 1994;50(5):529–536. doi: 10.4269/ajtmh.1994.50.529. [DOI] [PubMed] [Google Scholar]
- 32.Rogier C, et al. Plasmodium falciparum clinical malaria: Lessons from longitudinal studies in Senegal. Parassitologia. 1999;41(1-3):255–259. [PubMed] [Google Scholar]
- 33.Owusu-Agyei S, et al. Incidence of symptomatic and asymptomatic Plasmodium falciparum infection following curative therapy in adult residents of northern Ghana. Am J Trop Med Hyg. 2001;65(3):197–203. doi: 10.4269/ajtmh.2001.65.197. [DOI] [PubMed] [Google Scholar]
- 34.Baird JK, et al. Seasonal malaria attack rates in infants and young children in northern Ghana. Am J Trop Med Hyg. 2002;66(3):280–286. doi: 10.4269/ajtmh.2002.66.280. [DOI] [PubMed] [Google Scholar]
- 35.Mueller I, et al. Force of infection is key to understanding the epidemiology of Plasmodium falciparum malaria in Papua New Guinean children. Proc Natl Acad Sci USA. 2012;109(25):10030–10035. doi: 10.1073/pnas.1200841109. [DOI] [PMC free article] [PubMed] [Google Scholar]
- 36.Drakeley C, Cook J. Chapter 5. Potential contribution of sero-epidemiological analysis for monitoring malaria control and elimination: Historical and current perspectives. Adv Parasitol. 2009;69:299–352. doi: 10.1016/S0065-308X(09)69005-9. [DOI] [PubMed] [Google Scholar]
- 37.Cook J, et al. Using serological measures to monitor changes in malaria transmission in Vanuatu. Malar J. 2010;9(1):169. doi: 10.1186/1475-2875-9-169. [DOI] [PMC free article] [PubMed] [Google Scholar]
- 38.Elliott SR, et al. Research priorities for the development and implementation of serological tools for malaria surveillance. F1000Prime Rep. 2014;6:100–113. doi: 10.12703/P6-100. [DOI] [PMC free article] [PubMed] [Google Scholar]
- 39.Corran P, Coleman P, Riley E, Drakeley C. Serology: A robust indicator of malaria transmission intensity? Trends Parasitol. 2007;23(12):575–582. doi: 10.1016/j.pt.2007.08.023. [DOI] [PubMed] [Google Scholar]
- 40.Corran PH, et al. Dried blood spots as a source of anti-malarial antibodies for epidemiological studies. Malar J. 2008;7:195. doi: 10.1186/1475-2875-7-195. [DOI] [PMC free article] [PubMed] [Google Scholar]
- 41.Stewart L, et al. Rapid assessment of malaria transmission using age-specific sero-conversion rates. PLoS One. 2009;4(6):e6083. doi: 10.1371/journal.pone.0006083. [DOI] [PMC free article] [PubMed] [Google Scholar]
- 42.Bruce-Chwatt LJ, Dodge JS, Draper CC, Topley E, Voller A. Sero-epidemiological studies on population groups previously exposed to malaria. Lancet. 1972;1(7749):512–515. doi: 10.1016/s0140-6736(72)90176-6. [DOI] [PubMed] [Google Scholar]
- 43.Bruce-Chwatt LJ, Draper CC, Avramidis D, Kazandzoglou O. Sero-epidemiological surveillance of disappearing malaria in Greece. J Trop Med Hyg. 1975;78(9):194–200. [PubMed] [Google Scholar]
- 44.Esposito F, et al. Prevalence and levels of antibodies to the circumsporozoite protein of Plasmodium falciparum in an endemic area and their relationship to resistance against malaria infection. Trans R Soc Trop Med Hyg. 1988;82(6):827–832. doi: 10.1016/0035-9203(88)90007-7. [DOI] [PubMed] [Google Scholar]
- 45.Ramasamy R, Nagendran K, Ramasamy MS. Antibodies to epitopes on merozoite and sporozoite surface antigens as serologic markers of malaria transmission: Studies at a site in the dry zone of Sri Lanka. Am J Trop Med Hyg. 1994;50(5):537–547. doi: 10.4269/ajtmh.1994.50.537. [DOI] [PubMed] [Google Scholar]
- 46.Grab B, Pull JH. WHO 1974 Statistical Considerations in Serological Surveys of Population with Particular Reference to Malaria. Available at apps.who.int//iris/handle/10665/65700. Accessed December 13, 2014.
- 47.Drakeley CJ, et al. Estimating medium- and long-term trends in malaria transmission by using serological markers of malaria exposure. Proc Natl Acad Sci USA. 2005;102(14):5108–5113. doi: 10.1073/pnas.0408725102. [DOI] [PMC free article] [PubMed] [Google Scholar]
- 48.Cook J, et al. Serological markers suggest heterogeneity of effectiveness of malaria control interventions on Bioko Island, equatorial Guinea. PLoS One. 2011;6(9):e25137. doi: 10.1371/journal.pone.0025137. [DOI] [PMC free article] [PubMed] [Google Scholar]
- 49.Badu K, et al. Marked variation in MSP-119 antibody responses to malaria in western Kenyan highlands. BMC Infect Dis. 2012;12:50. doi: 10.1186/1471-2334-12-50. [DOI] [PMC free article] [PubMed] [Google Scholar]
- 50.Bretscher MT, et al. Measurement of Plasmodium falciparum transmission intensity using serological cohort data from Indonesian schoolchildren. Malar J. 2013;12:21. doi: 10.1186/1475-2875-12-21. [DOI] [PMC free article] [PubMed] [Google Scholar]
- 51.Supargiyono S, et al. Seasonal changes in the antibody responses against Plasmodium falciparum merozoite surface antigens in areas of differing malaria endemicity in Indonesia. Malar J. 2013;12:444. doi: 10.1186/1475-2875-12-444. [DOI] [PMC free article] [PubMed] [Google Scholar]
- 52.Arnold BF, et al. Serological measures of malaria transmission in Haiti: Comparison of longitudinal and cross-sectional methods. PLoS One. 2014;9(4):e93684. doi: 10.1371/journal.pone.0093684. [DOI] [PMC free article] [PubMed] [Google Scholar]
- 53.von Fricken ME, et al. Age-specific malaria seroprevalence rates: A cross-sectional analysis of malaria transmission in the Ouest and Sud-Est departments of Haiti. Malar J. 2014;13:361. doi: 10.1186/1475-2875-13-361. [DOI] [PMC free article] [PubMed] [Google Scholar]
- 54.Meraldi V, et al. Natural antibody response to Plasmodium falciparum Exp-1, MSP-3 and GLURP long synthetic peptides and association with protection. Parasite Immunol. 2004;26(6-7):265–272. doi: 10.1111/j.0141-9838.2004.00705.x. [DOI] [PubMed] [Google Scholar]
- 55.Gray JC, et al. Profiling the antibody immune response against blood stage malaria vaccine candidates. Clin Chem. 2007;53(7):1244–1253. doi: 10.1373/clinchem.2006.081695. [DOI] [PubMed] [Google Scholar]
- 56.Osier FHA, et al. Breadth and magnitude of antibody responses to multiple Plasmodium falciparum merozoite antigens are associated with protection from clinical malaria. Infect Immun. 2008;76(5):2240–2248. doi: 10.1128/IAI.01585-07. [DOI] [PMC free article] [PubMed] [Google Scholar]
- 57.Akpogheneta OJ, et al. Duration of naturally acquired antibody responses to blood-stage Plasmodium falciparum is age dependent and antigen specific. Infect Immun. 2008;76(4):1748–1755. doi: 10.1128/IAI.01333-07. [DOI] [PMC free article] [PubMed] [Google Scholar]
- 58.Stanisic DI, et al. Acquisition of antibodies against Plasmodium falciparum merozoites and malaria immunity in young children and the influence of age, force of infection, and magnitude of response. Infect Immun. 2015;83(2):646–660. doi: 10.1128/IAI.02398-14. [DOI] [PMC free article] [PubMed] [Google Scholar]
- 59.Kilama M, et al. Estimating the annual entomological inoculation rate for Plasmodium falciparum transmitted by Anopheles gambiae s.l. using three sampling methods in three sites in Uganda. Malar J. 2014;13:111. doi: 10.1186/1475-2875-13-111. [DOI] [PMC free article] [PubMed] [Google Scholar]
- 60.Kinyanjui SM, Bull P, Newbold CI, Marsh K. Kinetics of antibody responses to Plasmodium falciparum-infected erythrocyte variant surface antigens. J Infect Dis. 2003;187(4):667–674. doi: 10.1086/373994. [DOI] [PubMed] [Google Scholar]
- 61.Boutlis CS, et al. Immunoglobulin G (IgG) responses to Plasmodium falciparum glycosylphosphatidylinositols are short-lived and predominantly of the IgG3 subclass. J Infect Dis. 2003;187(5):862–865. doi: 10.1086/367897. [DOI] [PubMed] [Google Scholar]
- 62.Bousema JT, Drakeley CJ, Sauerwein RW. Sexual-stage antibody responses to P. falciparum in endemic populations. Curr Mol Med. 2006;6(2):223–229. doi: 10.2174/156652406776055140. [DOI] [PubMed] [Google Scholar]
- 63.Kinyanjui SM, Conway DJ, Lanar DE, Marsh K. IgG antibody responses to Plasmodium falciparum merozoite antigens in Kenyan children have a short half-life. Malar J. 2007;6:82. doi: 10.1186/1475-2875-6-82. [DOI] [PMC free article] [PubMed] [Google Scholar]
- 64.Doolan DL, Dobaño C, Baird JK. Acquired immunity to malaria. Clin Microbiol Rev. 2009;22(1):13–36. doi: 10.1128/CMR.00025-08. [DOI] [PMC free article] [PubMed] [Google Scholar]
- 65.Moncunill G, et al. High antibody responses against Plasmodium falciparum in immigrants after extended periods of interrupted exposure to malaria. PLoS One. 2013;8(8):e73624. doi: 10.1371/journal.pone.0073624. [DOI] [PMC free article] [PubMed] [Google Scholar]
- 66.Ondigo BN, et al. Estimation of recent and long-term malaria transmission in a population by antibody testing to multiple Plasmodium falciparum antigens. J Infect Dis. 2014;210(7):1123–1132. doi: 10.1093/infdis/jiu225. [DOI] [PMC free article] [PubMed] [Google Scholar]
- 67.Bousema T, et al. Serologic markers for detecting malaria in areas of low endemicity, Somalia, 2008. Emerg Infect Dis. 2010;16(3):392–399. doi: 10.3201/eid1603.090732. [DOI] [PMC free article] [PubMed] [Google Scholar]
- 68.Wong J, et al. Serological markers for monitoring historical changes in malaria transmission intensity in a highly endemic region of Western Kenya, 1994-2009. Malar J. 2014;13(1):451. doi: 10.1186/1475-2875-13-451. [DOI] [PMC free article] [PubMed] [Google Scholar]
- 69.Bejon P, et al. Stable and unstable malaria hotspots in longitudinal cohort studies in Kenya. PLoS Med. 2010;7(7):e1000304. doi: 10.1371/journal.pmed.1000304. [DOI] [PMC free article] [PubMed] [Google Scholar]
- 70.Crompton PD, et al. A prospective analysis of the Ab response to Plasmodium falciparum before and after a malaria season by protein microarray. Proc Natl Acad Sci USA. 2010;107(15):6958–6963. doi: 10.1073/pnas.1001323107. [DOI] [PMC free article] [PubMed] [Google Scholar]
- 71.Voller A, O’Neill P. Immunofluorescence method suitable for large-scale application to malaria. Bull World Health Organ. 1971;45(4):524–529. [PMC free article] [PubMed] [Google Scholar]
- 72.Druilhe P, et al. Levels of antibodies to Plasmodium falciparum sporozoite surface antigens reflect malaria transmission rates and are persistent in the absence of reinfection. Infect Immun. 1986;53(2):393–397. doi: 10.1128/iai.53.2.393-397.1986. [DOI] [PMC free article] [PubMed] [Google Scholar]
- 73.Vekemans J, Ballou WR. Plasmodium falciparum malaria vaccines in development. Expert Rev Vaccines. 2008;7(2):223–240. doi: 10.1586/14760584.7.2.223. [DOI] [PubMed] [Google Scholar]
- 74.Felgner PL, et al. Pre-erythrocytic antibody profiles induced by controlled human malaria infections in healthy volunteers under chloroquine prophylaxis. Sci Rep. 2013;3:3549. doi: 10.1038/srep03549. [DOI] [PMC free article] [PubMed] [Google Scholar]
- 75.Baum E, et al. Protein microarray analysis of antibody responses to Plasmodium falciparum in western Kenyan highland sites with differing transmission levels. PLoS One. 2013;8(12):e82246. doi: 10.1371/journal.pone.0082246. [DOI] [PMC free article] [PubMed] [Google Scholar]
- 76.Noland GS, et al. Low prevalence of antibodies to preerythrocytic but not blood-stage Plasmodium falciparum antigens in an area of unstable malaria transmission compared to prevalence in an area of stable malaria transmission. Infect Immun. 2008;76(12):5721–5728. doi: 10.1128/IAI.00591-08. [DOI] [PMC free article] [PubMed] [Google Scholar]
- 77.Bailey JA, et al. Seroreactivity to a large panel of field-derived Plasmodium falciparum apical membrane antigen 1 and merozoite surface protein 1 variants reflects seasonal and lifetime acquired responses to malaria. Am J Trop Med Hyg. 2015;92(1):9–12. doi: 10.4269/ajtmh.14-0140. [DOI] [PMC free article] [PubMed] [Google Scholar]
- 78.Travassos MA, et al. Seroreactivity to Plasmodium falciparum erythrocyte membrane protein 1 intracellular domain in malaria-exposed children and adults. J Infect Dis. 2013;208(9):1514–1519. doi: 10.1093/infdis/jit339. [DOI] [PMC free article] [PubMed] [Google Scholar]
- 79.Ondigo BN, et al. Standardization and validation of a cytometric bead assay to assess antibodies to multiple Plasmodium falciparum recombinant antigens. Malar J. 2012;11:427. doi: 10.1186/1475-2875-11-427. [DOI] [PMC free article] [PubMed] [Google Scholar]
- 80.Simonsen J, et al. Sero-epidemiology as a tool to study the incidence of Salmonella infections in humans. Epidemiol Infect. 2008;136(7):895–902. doi: 10.1017/S0950268807009314. [DOI] [PMC free article] [PubMed] [Google Scholar]
- 81.Simonsen J, et al. Estimation of incidences of infectious diseases based on antibody measurements. Stat Med. 2009;28(14):1882–1895. doi: 10.1002/sim.3592. [DOI] [PubMed] [Google Scholar]
- 82.de Melker HE, Versteegh FGA, Schellekens JFP, Teunis PFM, Kretzschmar M. The incidence of Bordetella pertussis infections estimated in the population from a combination of serological surveys. J Infect. 2006;53(2):106–113. doi: 10.1016/j.jinf.2005.10.020. [DOI] [PubMed] [Google Scholar]
- 83.Kretzschmar M, Teunis PFM, Pebody RG. Incidence and reproduction numbers of pertussis: Estimates from serological and social contact data in five European countries. PLoS Med. 2010;7(6):e1000291. doi: 10.1371/journal.pmed.1000291. [DOI] [PMC free article] [PubMed] [Google Scholar]
- 84.Sturrock HJW, et al. Targeting asymptomatic malaria infections: Active surveillance in control and elimination. PLoS Med. 2013;10(6):e1001467. doi: 10.1371/journal.pmed.1001467. [DOI] [PMC free article] [PubMed] [Google Scholar]
- 85.Cotter C, et al. The changing epidemiology of malaria elimination: New strategies for new challenges. Lancet. 2013;382(9895):900–911. doi: 10.1016/S0140-6736(13)60310-4. [DOI] [PMC free article] [PubMed] [Google Scholar]
- 86.WHO WHO procedures for certification of malaria elimination. Wkly Epidemiol Rec. 2014;89(29):321–325. [PubMed] [Google Scholar]
- 87.Greenhouse B, et al. Antibodies to Plasmodium falciparum antigens predict a higher risk of malaria but protection from symptoms once parasitemic. J Infect Dis. 2011;204(1):19–26. doi: 10.1093/infdis/jir223. [DOI] [PMC free article] [PubMed] [Google Scholar]
- 88.Bejon P, et al. Analysis of immunity to febrile malaria in children that distinguishes immunity from lack of exposure. Infect Immun. 2009;77(5):1917–1923. doi: 10.1128/IAI.01358-08. [DOI] [PMC free article] [PubMed] [Google Scholar]
- 89.Bejon P, et al. Effect of the pre-erythrocytic candidate malaria vaccine RTS,S/AS01E on blood stage immunity in young children. J Infect Dis. 2011;204(1):9–18. doi: 10.1093/infdis/jir222. [DOI] [PMC free article] [PubMed] [Google Scholar]
- 90.Bousema T, Kreuels B, Gosling R. Adjusting for heterogeneity of malaria transmission in longitudinal studies. J Infect Dis. 2011;204(1):1–3. doi: 10.1093/infdis/jir225. [DOI] [PMC free article] [PubMed] [Google Scholar]
- 91.Jagannathan P, et al. IFNγ/IL-10 co-producing cells dominate the CD4 response to malaria in highly exposed children. PLoS Pathog. 2014;10(1):e1003864. doi: 10.1371/journal.ppat.1003864. [DOI] [PMC free article] [PubMed] [Google Scholar]
- 92.Wanzira H, et al. Longitudinal outcomes in a cohort of Ugandan children randomized to artemether-lumefantrine versus dihydroartemisinin-piperaquine for the treatment of malaria. Clin Infect Dis. 2014;59(4):509–516. doi: 10.1093/cid/ciu353. [DOI] [PubMed] [Google Scholar]
- 93.Kamya MR, et al. Malaria transmission, infection, and disease at three sites with varied transmission intensity in Uganda: Implications for malaria control. Am J Trop Med Hyg. 2015;92(5):903–912. doi: 10.4269/ajtmh.14-0312. [DOI] [PMC free article] [PubMed] [Google Scholar]
- 94.Okello PE, et al. Variation in malaria transmission intensity in seven sites throughout Uganda. Am J Trop Med Hyg. 2006;75(2):219–225. [PubMed] [Google Scholar]
- 95.Doolan DL, et al. Profiling humoral immune responses to P. falciparum infection with protein microarrays. Proteomics. 2008;8(22):4680–4694. doi: 10.1002/pmic.200800194. [DOI] [PMC free article] [PubMed] [Google Scholar]
- 96.Trieu A, et al. Sterile protective immunity to malaria is associated with a panel of novel P. falciparum antigens. Mol Cell Proteomics. 2011;10(9):007948. doi: 10.1074/mcp.M111.007948. [DOI] [PMC free article] [PubMed] [Google Scholar]
- 97.Richards JS, et al. Identification and prioritization of merozoite antigens as targets of protective human immunity to plasmodium falciparum malaria for vaccine and biomarker development. J Immunol. 2013;191(2):795–809. doi: 10.4049/jimmunol.1300778. [DOI] [PMC free article] [PubMed] [Google Scholar]
- 98.Osier FH, et al. Opsonic phagocytosis of Plasmodium falciparum merozoites: Mechanism in human immunity and a correlate of protection against malaria. BMC Med. 2014;12:108. doi: 10.1186/1741-7015-12-108. [DOI] [PMC free article] [PubMed] [Google Scholar]
- 99.R Core Team 2014 R: A Language and Environment for Statistical Computing. Available at www.R-project.org. Accessed November 1, 2014.
- 100.Wang J, et al. 2014 robust: Robust Library. Available at cran.r-project.org/web/packages/robust/index.html. Accessed November 1, 2014.
- 101.Sboner A, et al. Robust-linear-model normalization to reduce technical variability in functional protein microarrays. J Proteome Res. 2009;8(12):5451–5464. doi: 10.1021/pr900412k. [DOI] [PubMed] [Google Scholar]
- 102.Polley E, van der Laan M. 2013 SuperLearner: Super Learner Prediction. Available at cran.r-project.org/web/packages/SuperLearner/index.html. Accessed November 1, 2014.
- 103.van der Laan MJ, Polley EC, Hubbard AE. Super learner. Stat Appl Genet Mol Biol. 2007;6(2007):Article25. doi: 10.2202/1544-6115.1309. [DOI] [PubMed] [Google Scholar]
- 104.Van der Laan M, Polley E, Hubbard A. 2007 Super Learner. UC Berkeley Division of Biostatistics Working Paper Series. Available at biostats.bepress.com/ucbbiostat/paper222. Accessed November 1, 2014.
- 105.Friedman J, Hastie T, Tibshirani R. Regularization paths for generalized linear models via coordinate descent. J Stat Softw. 2010;33(1):1–22. [PMC free article] [PubMed] [Google Scholar]
- 106.Liaw A, Wiener M. Classification and regression by randomForest. R News Newsl R Proj. 2002;2(3):18–22. [Google Scholar]
- 107.Meyer D, Dimitriadou E, Hornik K, Weingessel A, Leisch F. 2014 e1071: Misc Functions of the Department of Statistics (e1071), TU Wien. Available at cran.r-project.org/web/packages/e1071/index.html. Accessed November 1, 2014.
- 108.Venables WN, Ripley BD. 2002 Modern Applied Statistics with S. Available at www.stats.ox.ac.uk/pub/MASS4. Accessed November 1, 2014.
- 109.Sing T, Sander O, Beerenwinkel N, Lengauer T. ROCR: Visualizing classifier performance in R. Bioinformatics. 2005;21(20):3940–3941. doi: 10.1093/bioinformatics/bti623. [DOI] [PubMed] [Google Scholar]
Associated Data
This section collects any data citations, data availability statements, or supplementary materials included in this article.