Significance
Human cerebral small vessel disease (SVD) comprises age-associated intracerebral hemorrhages and global cognitive impairment, including vascular dementia. Human SVD presents in either familial or sporadic manifestation, involving either monogenic Mendelian defects or multitrait genetic variants. To better characterize the genetic and molecular mechanisms underlying SVD, appropriate animal models are needed. The SrfiECKO mouse model presented here resembles human SVD pathology with regard to intracerebral hemorrhage formation and vascular dementia, including variability in onset and progression of cerebral symptoms. The Serum Response Factor (SRF)/Myocardin Related Transcription Factor (MRTF) are shown to regulate the expression of genes, which are essential for the maintenance of blood–brain barrier function and cerebral microvessel integrity. These findings suggest impairment of SRF/MRTF-mediated gene control as a molecular mechanism contributing to human SVD.
Keywords: blood–brain barrier, cerebral microbleeds, conditional gene knockout, stroke mouse model, transcription
Abstract
Intracerebral hemorrhagic stroke and vascular dementia are age- and hypertension-associated manifestations of human cerebral small vessel disease (SVD). Cerebral microvessels are formed by endothelial cells (ECs), which are connected through tight junctions, adherens junctions, and stabilizing basement membrane structures. These endothelial connections ensure both vessel stability and blood–brain barrier (BBB) functions, the latter enabling selective exchange of ions, bioactive molecules, and cells between the bloodstream and brain tissue. SrfiECKO mice, permitting conditional EC-specific depletion of the transcription factor Serum Response Factor (SRF), suffer from loss of BBB integrity and intracerebral hemorrhaging. Cerebral microbleeds and larger hemorrhages developed upon postnatal and adult depletion of either SRF or its cofactors Myocardin Related Transcription Factor (MRTF-A/-B), revealing essential requirements of ongoing SRF/MRTF activity for maintenance of cerebral small vessel integrity. In vivo magnetic resonance imaging allowed detection, localization, and time-resolved quantification of BBB permeability and hemorrhage formation in SrfiECKO brains. At the molecular level, direct and indirect SRF/MRTF target genes, encoding structural components of tight junctions (Claudins and ZO proteins), adherens junctions (VE-cadherin, α-Actinin), and the basement membrane (Collagen IV), were down-regulated upon SRF depletion. These results identify SRF and its MRTF cofactors as major transcriptional regulators of EC junctional stability, guaranteeing physiological functions of the cerebral microvasculature. We hypothesize that impairments in SRF/MRTF activity contribute to human SVD pathology.
Stroke causes more than one of every 20 human deaths in the United States, whereby stroke pathology presents as ischemic (87%), intracerebral hemorrhagic (10%), or subarachnoid hemorrhagic (3%) (1). Intracerebral hemorrhage is a component of human cerebral small vessel disease (SVD), an age- and hypertension-associated cerebral morbidity with increasing incidence, occurring in familial and sporadic manifestations (2). Intracerebral hemorrhage displays lesions of variable volume, including macro- and microhemorrhages (microbleeds), readily visualized by magnetic resonance imaging (MRI) (3). Microbleeds are considered indicators of intracerebral hemorrhage risk in stroke medicine (4).
The cerebral microvasculature is built by endothelial cell (EC) interactions, involving tight junctions, adherens junctions, and EC basement membrane structures, thereby forming the blood–brain barrier (BBB) of capillaries for selective exchange between the blood and the brain parenchyme (for review, see refs. 2, 3, and 5).
Serum Response Factor (SRF), a ubiquitously expressed transcription factor, activates expression of target genes dependent upon recruitment of one of at least two classes of cofactors, the Ternary Complex Factors (TCFs) or the Myocardin Related Transcription Factors (MRTFs) (6–9). Previously, by using SrfiECKO and Mrtf-a(−/−)Mrtf-biECKO mice, an endothelial role of murine SRF and its MRTF cofactors was shown for retinal angiogenesis (10, 11).
The above inducible mouse lines were used to analyze the cerebral vasculature in detail. Depletion of SRF or MRTF-A/-B at postnatal days induced cerebral hemorrhages at early postnatal age. Similarly, adult depletion of SRF caused SrfiECKO animals to develop symptoms characteristic of SVD associated with cerebral hemorrhagic stroke. With time, brain hemorrhages increased progressively in number and were observed in all brain areas. MRI identified multiple perivascular blood extravasations of variable size and allowed lesion localization and quantitation. MRI further indicated vessel leakiness before the formation of blood-borne hemosiderin deposits. Structural components of tight junctions, adherens junctions, and the basement membrane were down-regulated in brains of SrfiECKO mice, identifying SRF/MRTF transcriptional control as a regulator of EC junction integrity.
Results
Lethal Brain Hemorrhaging upon Conditional EC-Specific Deletion of Srf in Postnatal and Adult Mice.
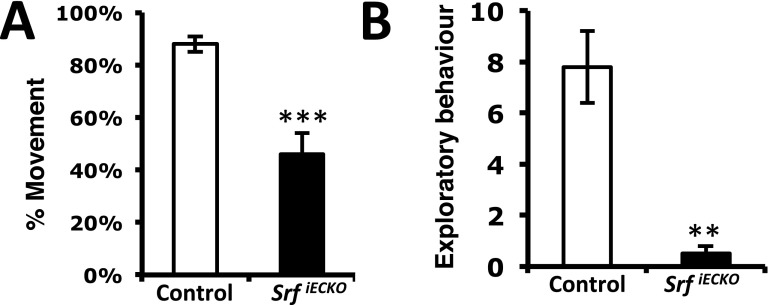
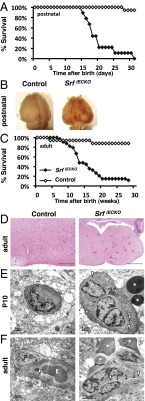
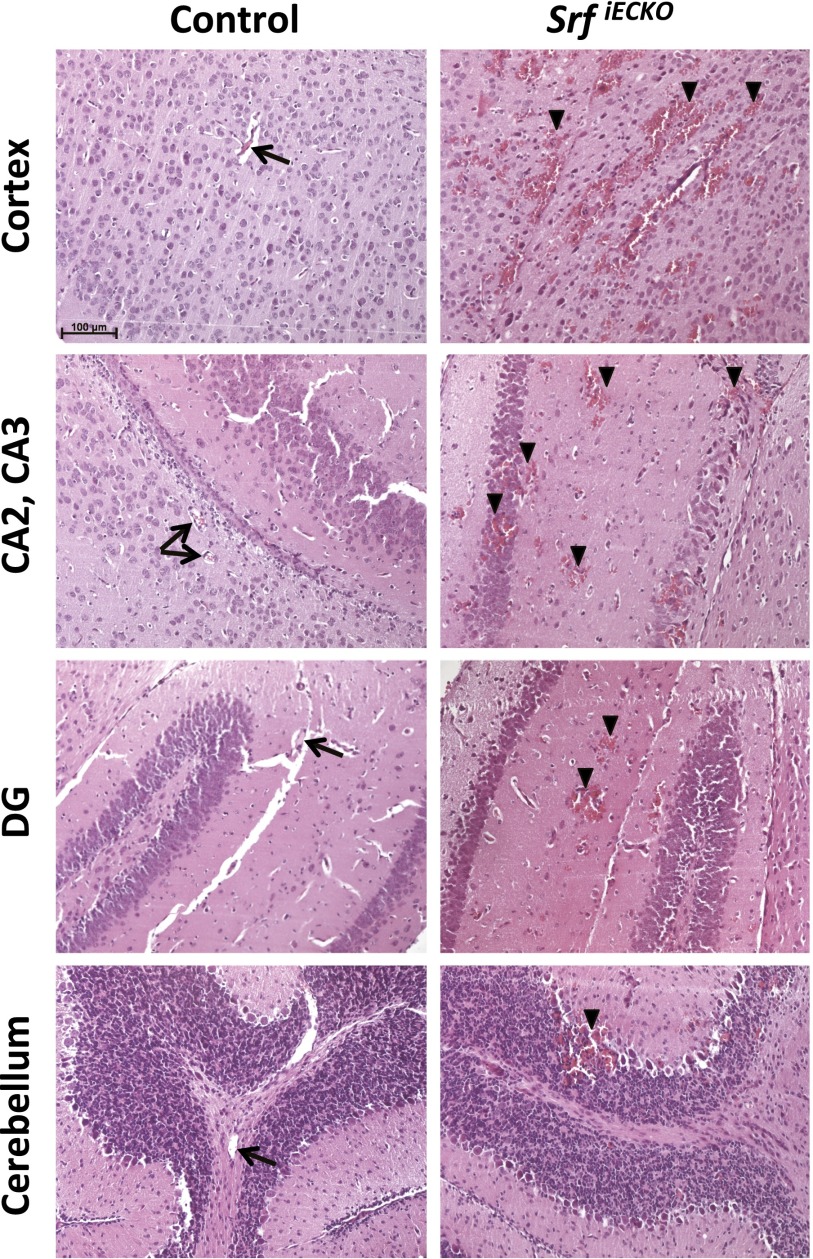
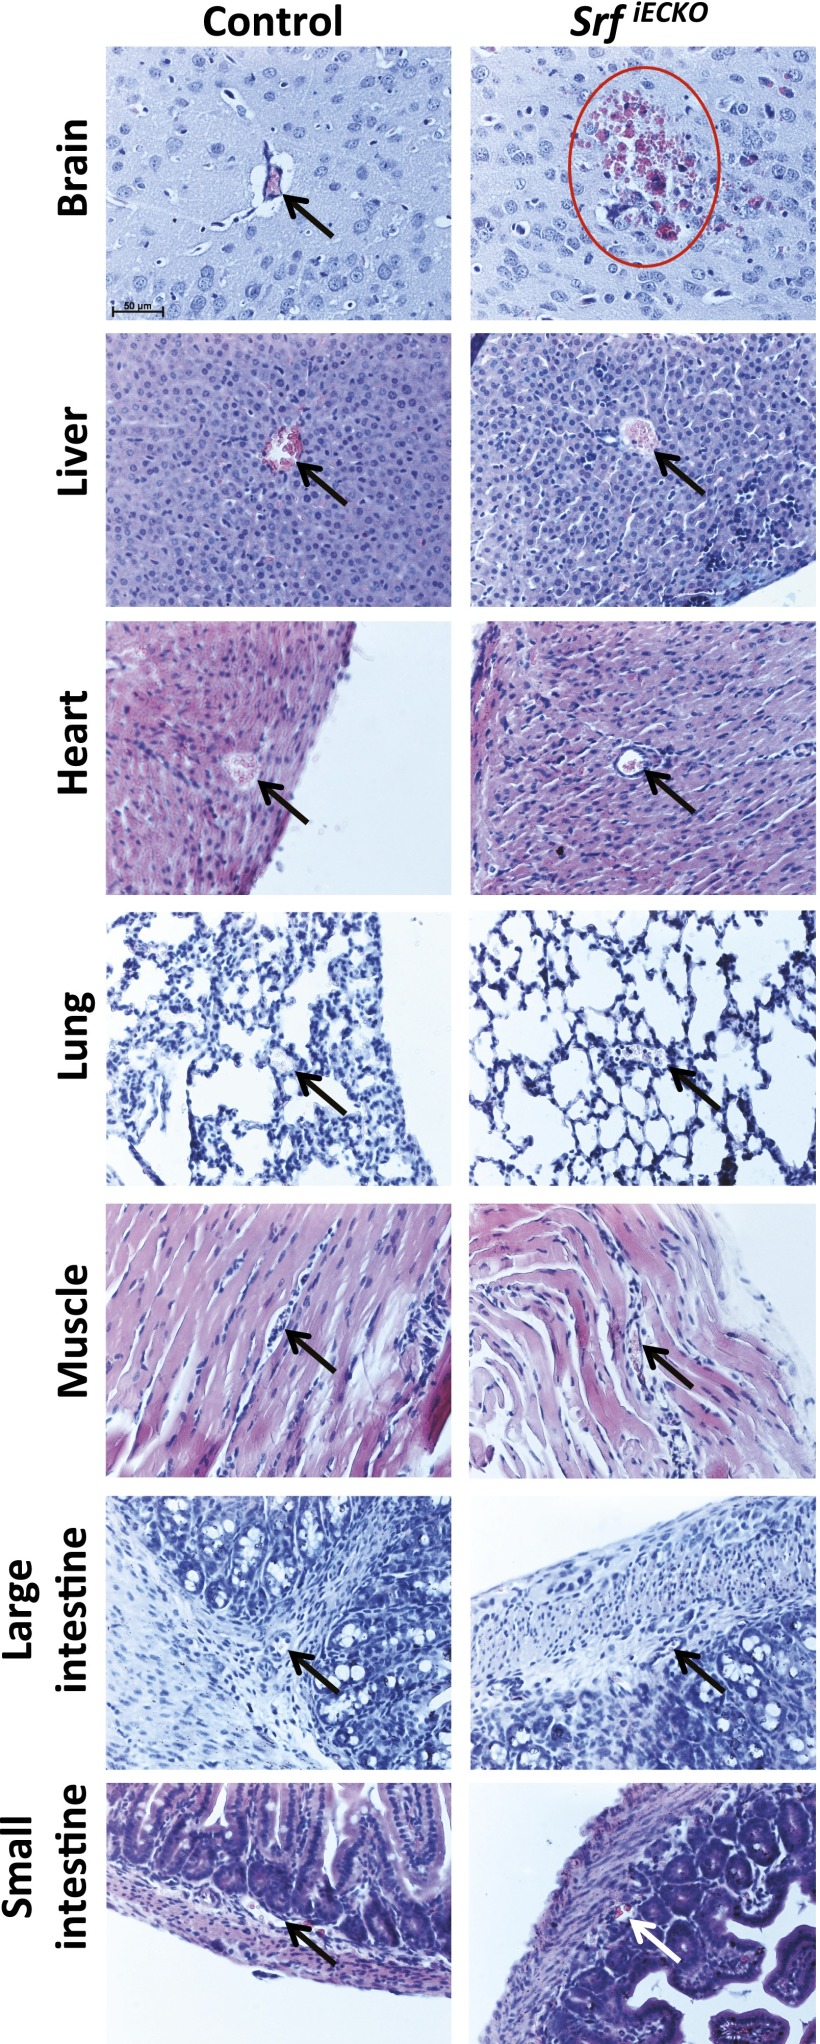
Tamoxifen-induced EC-specific deletion of the Srf gene in SrfiECKO animals elicited behavioral abnormalities (11) at varying times of onset, including reduced movement and lowered exploratory behavior after postnatal Srf deletion (Fig. S1). Mean survival of postnatally deleted animals was 17 d (Fig. 1A), irrespective of sex. Lethal symptoms included physical deterioration, hemiplegia, and ataxia. Brains dissected at age postnatal day 17 (P17) from postnatally deleted SrfiECKO animals revealed multiple bleedings (Fig. 1B). Hemorrhages were observed as early as P6. All brain areas displayed hemorrhages, including cortex, hippocampus, and cerebellar lobes (Fig. S2). Bleedings were found only in postnatal brains and in no other organ investigated (Fig. S3).
Fig. S1.
EC-specific Srf deletion results in less movement and exploratory behavior. (A) After EC-specific Srf deletion induced at P1–4, SrfiECKO animals exhibit lower mobility, as measured in a 1-min interval at age P14. (B) EC-specific Srf deletion at P1–4 induced less exploratory behavior, as determined at P14. Data are presented as means ± SEM. **P < 0.01; ***P < 0.001.
Fig. 1.
Premature death and cerebral hemorrhages in SrfiECKO animals. (A) Kaplan–Meier plot (percent survival) of control (n = 16) and SrfiECKO (n = 9) animals upon postnatal Srf deletion. (B) Brains revealing hemorrhages in SrfiECKO mice (P17). (C) Kaplan–Meier plot (percent survival) of control (n = 16) and SrfiECKO (n = 33) animals upon adult Srf deletion. (D) H&E staining of adult control and SrfiECKO brain sections, revealing multiple hemorrhages in SrfiECKO brains (representative acute-stage animal shown). [Scale bars, 200 μm (Left) and 1,000 μm (Right).] (E) Electron microscopic images highlight intact blood vessels in P10 control animals and hemorrhages in SrfiECKO brains. (Scale bars, 1 μm.) (F) Electron microscopic images highlight intact blood vessels in adult control animals and hemorrhages in SrfiECKO brains. (Scale bars, 2 μm.) Arrows highlight obliterated vessel lumen; arrowheads point to tight junctions; white asterisks mark extravasated erythrocytes. E, intraluminal erythrocyte; P, pericyte.
Fig. S2.
Hemorrhages in SrfiECKO animals can be observed throughout the brain. H&E staining on paraffin sections of P10 control and SrfiECKO animals is shown. Hemorrhages are observed in all brain areas of SrfiECKO animals, but not control animals—i.e., cortex, different regions of the hippocampus, and several cerebellar lobes. Arrows point toward intact blood vessels; arrowheads indicate bleedings. (Scale bar, 100 μm.)
Fig. S3.
Hemorrhages in SrfiECKO animals can specifically be observed in brain, but not other organs, at P10. H&E staining on paraffin sections of P10 control and SrfiECKO animals is shown. Hemorrhages are observed only in brains of SrfiECKO animals, but not in other organs such as liver, heart, lung, muscle, and large and small intestine. Arrows point toward intact blood vessels; red circle indicates bleeding. (Scale bar, 50 μm.)
When inducing EC-specific deletion of Srf in the adult, SrfiECKO animals first displayed mild behavioral abnormalities in distinct initial phases of variable onset. Here, animals presented with hunched posture, ruffled fur, and long-legged walking motion. After an intermittent period of symptom-free behavior, animals entered an acute stage, displaying severe symptoms, including ataxia, hemiplegia, lethargy, and physical deterioration. Adult-deleted SrfiECKO animals, but not control animals, showed reduced survival (Fig. 1C); both female and male animals were affected equally. Brain paraffin sectioning of affected adult animals revealed multiple locations of hemorrhage of different volume (Fig. 1D), likely causing the observed lethality. Microvessel bleeding occurred primarily in the brain rather than other organs, which may be explained by preferential expression of SRF in brain microvessels (12). Electron microscopic analysis of brain hemorrhages in both postnatally and adult-deleted animals revealed blood leakage into the surrounding brain tissue (Fig. 1 E and F). Whereas erythrocytes were confined to the lumen of ECs in control brains, red blood cells were found in the surrounding brain parenchyma in SrfiECKO brains (Fig. 1 E and F). Tight junctions were found in both control and mutant brain vessels (Fig. 1 E and F).
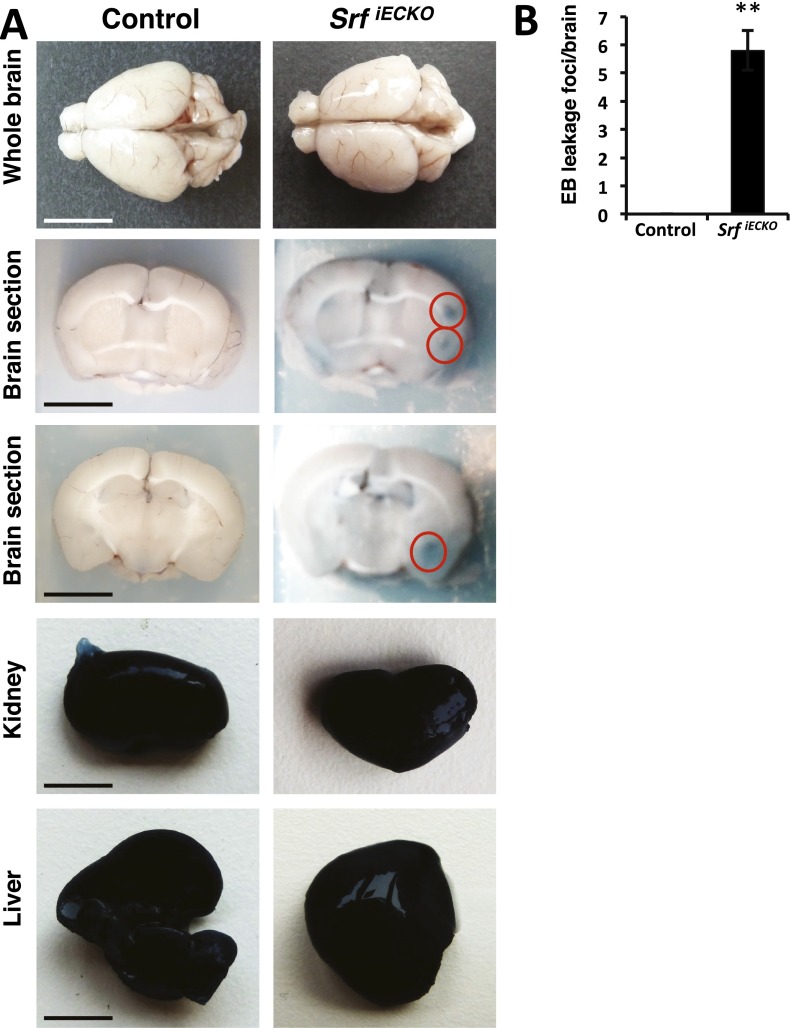
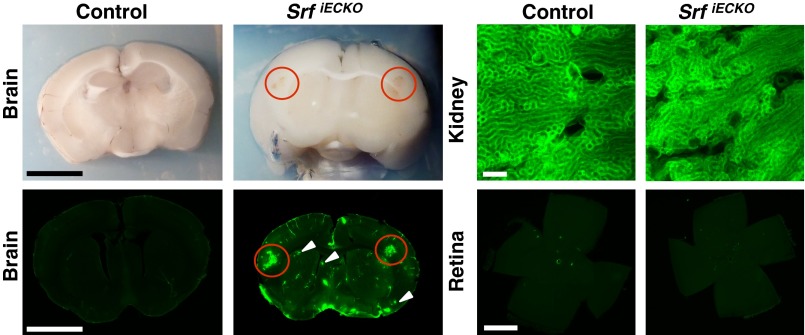
At sites of hemorrhage in adult animals, vessel luminal content was released locally into the surrounding brain tissue, as revealed by tracing of the intraperitoneally applied dye Evans Blue (EB) (Fig. S4) and by detection of intracardially perfused Sulfo-NHS-LC-Biotin using streptavidin fluorescence (Fig. 2). Luminal content extravasation was seen in adult SrfiECKO brains at spatially confined regions, most often in cortex and striatum (compare H&E-stained tissue sections) (Fig. 1D). High-resolution fluorescence images revealed both larger-volume hemorrhages (red circles) and microbleeds (white arrowheads). Kidney, an organ composed of fenestrated endothelium, served as positive control. No retinal fluorescence was seen (Fig. 2), congruent with our previous scanning laser ophthalmoscopy studies demonstrating absence of vascular dye leakage in SrfiECKO retinae (11). Collectively, our data clearly reveal a requirement of endothelial SRF activity in both young and adult mice for maintenance of brain microvascular integrity.
Fig. S4.
EB extravasation at specific sites of hemorrhage. (A) Adult control (n = 6) and SrfiECKO (n = 8) brains are compared after 24-h circulation of EB. SrfiECKO animals, but not control animals, exhibit EB staining at leakages in localized brain areas (red circles). In kidneys and livers, overall extravasation occurred in all animals due to fenestrated organ endothelium. [Scale bars, 1 cm (brains and livers) and 50 mm (kidneys).] (B) Quantitation of EB leakage areas per brain after vibratome sectioning of control and SrfiECKO whole brains. Data are presented as means ± SEM. **P < 0.01.
Fig. 2.
Extravasation at localized sites of hemorrhage. Sulfo-NHS-LC-Biotin extravasations at localized sites of hemorrhage in SrfiECKO, but not control brains, as visualized by blood coloring in brightfield (Upper Left) and fluorescence imaging (Lower Left) of an identical brain section. (Scale bars, 1 cm.) Red circles indicate larger-volume extravasations; white arrowheads indicate microbleeds. (Upper Right) Kidneys, composed of fenestrated endothelium, display constitutive dye extravasation. (Scale bar, 200 μm.) (Lower Right) Retinal flat-mounts evidence lack of extravasation in the retina (n = 4). (Scale bar, 1,000 μm.)
In Vivo Time-Resolved Detection and Quantitation of Brain Hemorrhages and BBB Permeability Using MRI.
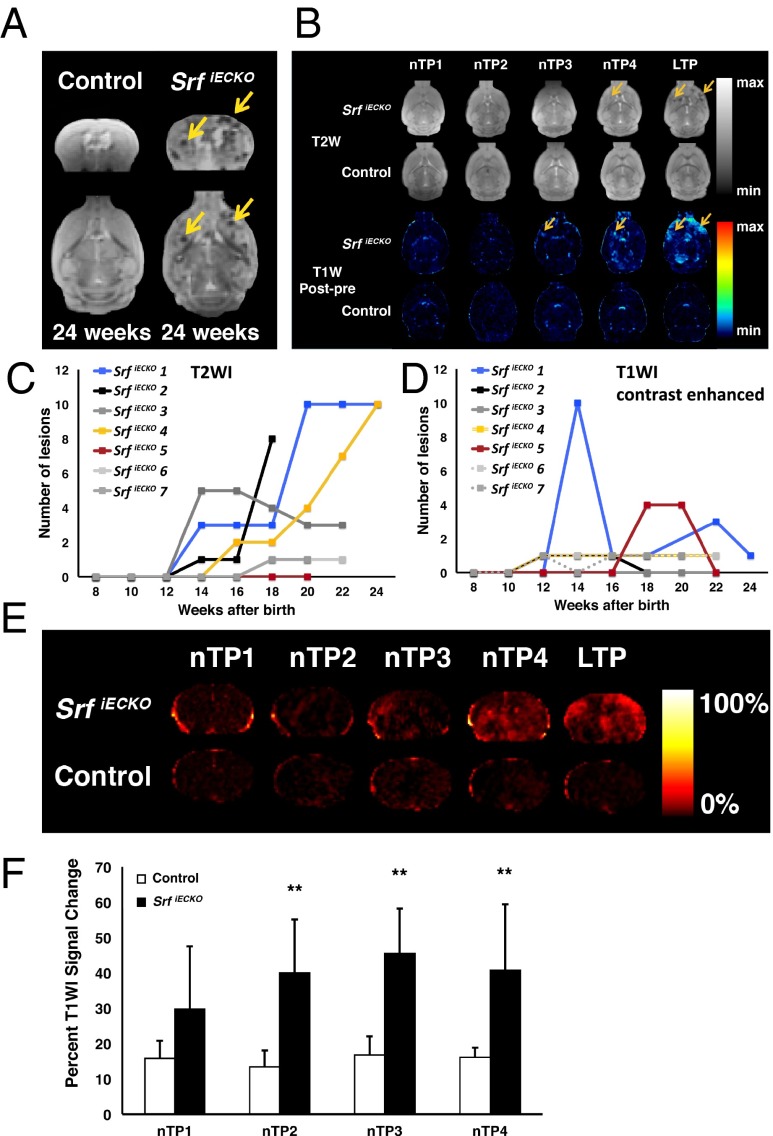
To identify BBB disruption in vivo, SrfiECKO and control animals were subjected to MRI, using T2-weighted imaging (T2WI) and contrast-enhanced T1-weighted imaging (T1WI). Multiple hemorrhages at various brain regions, not seen in control animals, were detected in adult-deleted SrfiECKO mice at 24 wk of age (Fig. 3A). To monitor onset and progression of brain hemorrhage formation during the lifetime of SrfiECKO mice, experimental animals were deleted for Srf at 6 wk of age and imaged longitudinally by T2WI every 2 wk from week 8 onward (normalized time point 1; nTP1) until the age of 24 wk (late time point; LTP). Clearly, hypointense lesions increased in number and distributed over entire brains of SrfiECKO mice, which was not evidenced in controls (Fig. 3 B, Upper). Quantification (Fig. 3C) shows T2WI lesions to begin after week 12 of age and increase subsequently in most SrfiECKO mice studied.
Fig. 3.
Identification and quantification over time of hemorrhagic lesions and BBB permeability by MRI. (A) T2W MR images of control and SrfiECKO animals, revealing stroke regions in SrfiECKO animals (arrows), in coronal (Upper) and transversal (Lower) sections. (B) Transversal slides of T2WI (Upper) and T1WI (Lower) subtractions of SrfiECKO and control animals. The T2WI of SrfiECKO mice exemplifies the extent of hypointense signal produced by hemorrhages. Controls presented no lesions. Arrows point toward lesion areas. Time points of analysis (nTP and LTP) are defined in SI Materials and Methods. (C and D) Time course (from week 8 to 24) of presence of T2WI (C) and T1WI (D) lesions in seven individual animals, as exemplified for one animal in B, Upper. Mice 2 and 7 died after weeks 18 and 20 of age, respectively. (E) Global T1WI signal change, an indicator of BBB permeability, elicited upon contrast agent application. (F) Quantified percent global T1WI signal change at time points indicated in E was significant at nTP2, nTP3, and nTP4. Controls presented no significant signal change. Statistical analysis: Mauchly’s test: no sphericity abnormalities (P = 0.35); ANOVA: significant overall difference (P < 0.01); Tukey’s test: significant differences at nTP2, nTP3, and nTP4. **P < 0.01. Data are presented as means ± SEM.
Subtracted T1WI measurements of SrfiECKO mice, but not control animals, revealed the appearance of hyperintense diffuse lesions occurring in the entire brain (olfactory bulb, cortex, striatum, pons, and cerebellum) (Fig. 3 B, Lower). These lesions varied in number between animals and were mostly observed from week 12 onward (Fig. 3D). Individual lesions detected by T1WI occasionally disappeared during the course of MRI and—in some cases—recurred (Fig. 3D).
To quantify general BBB permeability and/or capillary leakage before and after appearance of T1WI lesions, we measured the percentage of global signal change elicited by contrast agent application (Fig. 3 E and F). There were significant differences in signal change between control and experimental animals at normalized time points nTP2, nTP3, and nTP4 and a nonsignificant trend at nTP1. Thus, MRI (both T2WI and T1WI) proved valuable to detect, localize, and quantify in vivo both onset and progression of hemorrhagic lesions. Furthermore, the T1WI study suggests that global changes in BBB permeability occur even before nTP4, the time point at which lesions were first identified macroscopically.
Adult SrfiECKO Animals Recover Transiently from Initial Symptoms and Succumb Subsequently to Lethal Stroke.
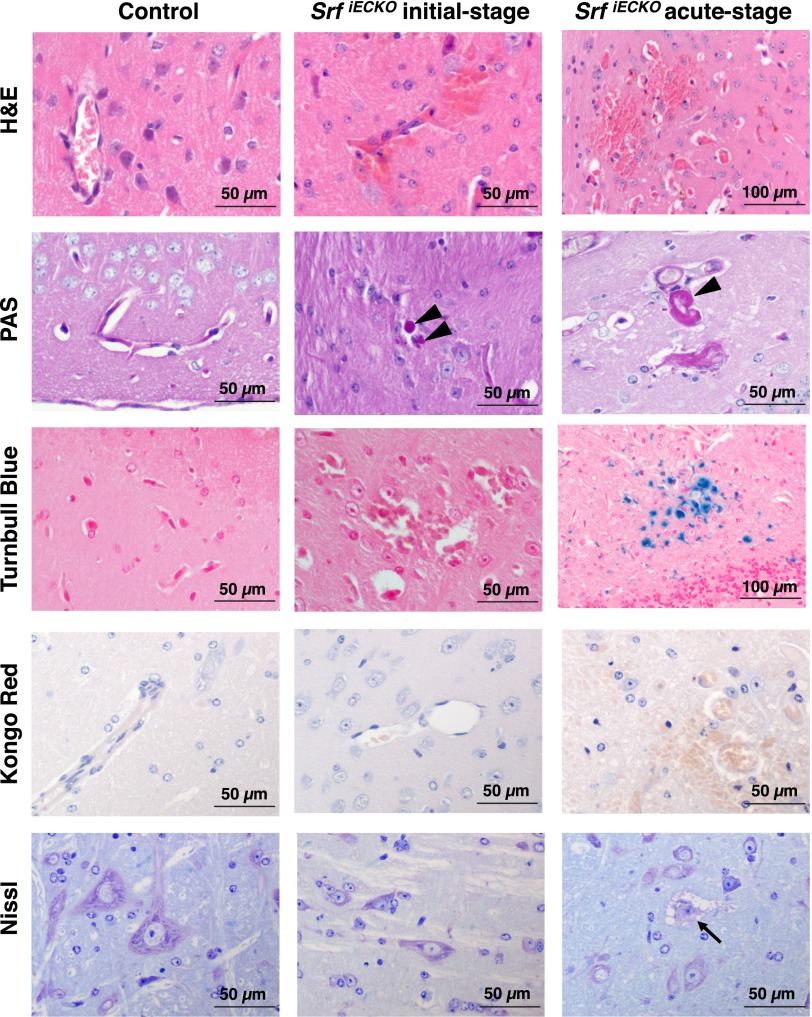
Brains of initial-stage animals revealed multifocal microhemorrhages with extravasation of erythrocytes (Fig. S5, Center), but no significant infiltration with macrophages or glial cells or activation of inflammation. Mild plasma extravasation (arrowheads) was visible by Periodic Acid Schiff (PAS) reactivity. The lack of Turnbull Blue staining in initial-stage brains indicated absence of older bleeds. Amyloid plaque formation—as seen in cerebral amyloid angiopathy (13)—was not detectable by Kongo Red staining in any of the tested animals. Furthermore, Nissl staining did not reveal signs of neuronal degeneration in mildly affected, initial-stage animals.
Fig. S5.
Adult SrfiECKO animals display common and differential pathological characteristics at initial vs. acute stages. Adult control (Left), initial-stage SrfiECKO (Center), and acute-stage SrfiECKO (Right) animals are compared regarding disease-associated processes. H&E staining reveals brain hemorrhages in initial-and acute-stage SrfiECKO animals, with erythrocytes being localized in the surrounding tissue outside blood vessels. PAS reactivity (arrowheads) shows plasma extravasation in both SrfiECKO disease stages. Turnbull Blue staining, indicating aged iron deposits, is seen in acute-stage SrfiECKO brains only. Kongo Red, a marker for amyloid plaques, which occur in cerebral amyloid angiopathy patients, is negative in control and both SrfiECKO stages. Nissl staining indicates neuronal degeneration only in the acute-stage SrfiECKO animals (arrow). (Scale bars, 50 and 100 μm, as indicated in the images.)
In contrast, in acute-stage animals, multiple sites of hemorrhage were associated with inflammation and infiltration of glial cells, as revealed by H&E staining (Fig. S5, Right). Prominent PAS-positive plasma extravasations displayed regions of Turnbull Blue staining (Fig. S5, Right), indicative of hemorrhages having occurred approximately several days before sample asservation. Neuronal degeneration was identified by cellular swelling, cytoplasmic vacuolization, nuclear chromatin condensation (karyopyknosis), and loss of Nissl substance (Fig. S5, Right).
SRF Cofactors MRTF, but Not TCF, Are Essential for a Functional Cerebral Endothelium.
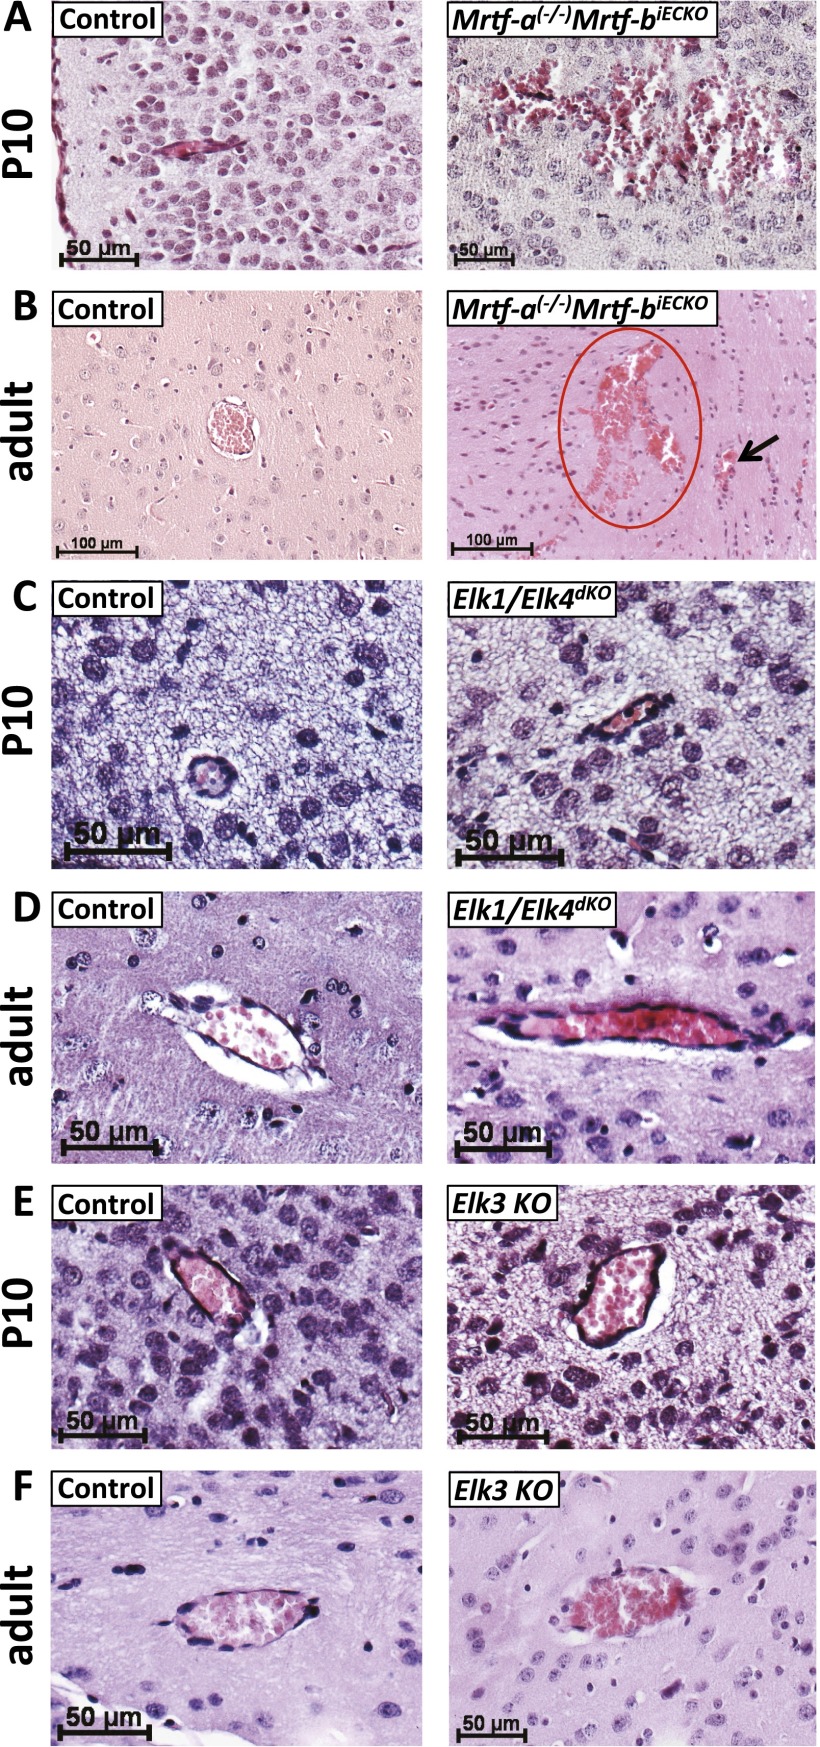
To identify SRF cofactors potentially required by SRF to ensure the integrity of postnatal and adult cerebral vasculature, we performed knockout studies on all five genes encoding known SRF cofactors—i.e., MRTFs (Mrtf-a and Mrtf-b) or TCFs (Elk1, Elk3, and Elk4). Mrtf-a(−/−)Mrtf-biECKO mice (11) showed hemorrhages of different volume, highly reminiscent of those displayed by SrfiECKO mice (Fig. S6 A and B), strongly suggesting that MRTFs are the relevant endothelial SRF cofactors in vivo to ensure appropriate formation and functioning of the cerebral endothelium.
Fig. S6.
MRTF cofactors of SRF, but not TCFs, are required for proper functioning of the cerebral endothelium. (A and B) P10 (A) and adult (B) Mrtf-a(−/−)Mrtf-biECKO mice, but not control littermates, exhibit cerebral bleedings comparable to SrfiECKO. (C and D) Elk1/Elk4 constitutive double-knockout mice were indistinguishable from control P10 (C) and adult (D) littermates. Basement membranes look normal, and no erythrocytes are found in the surrounding brain parenchyma. (E and F) Elk3 knockout blood vessels did not show any signs of hemorrhage at P10 (E) and adult (F) ages. (n = 5 mice for each genotype and age). Red circle indicates larger volume extravasation; arrow points to MBs. [Scale bars: 50 μm (A and C–F) and 100 μm (B).]
We next investigated the constitutive Elk1/Elk4 double-knockout (14) and Elk3 single-knockout mouse models (15). By analyzing the cerebral vasculature of both P10 and adult animals, no hemorrhages were observed in Elk knockout mouse brains (Fig. S6 C–F), demonstrating that TCF-type SRF cofactors Elk1, Elk3, and Elk4 were not required for formation and maintenance of the cerebral vasculature.
SrfiECKO Cerebral Microvessels Have Impaired Basement Membrane Structure and Elevated Astrocyte Recruitment.
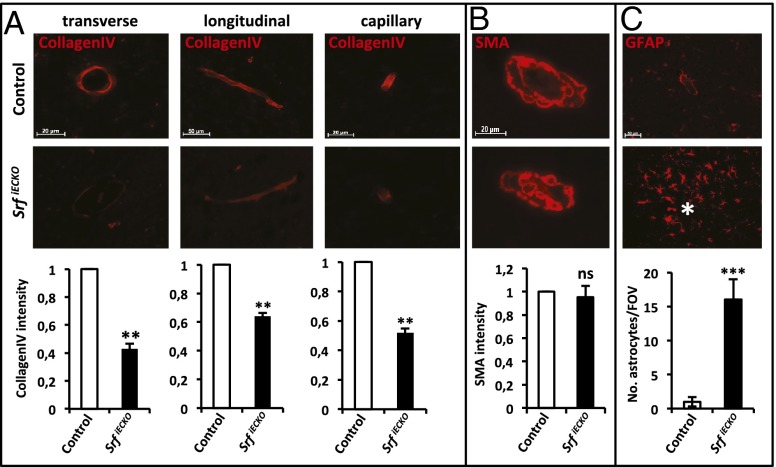
Cerebral microvessel stability is dependent upon intact endothelial basement membrane structure and mural cell coverage. Regarding basement membrane structure, Collagen IV staining intensity was reduced on blood vessels of SrfiECKO animals (P10) compared with control sections (Fig. 4A), in agreement with reduced Collagen IV (Col4) RNA levels in both postnatal and adult SrfiECKO knockout brains (Fig. 5 A and D). Vessel coverage by vascular smooth muscle cells, investigated by using smooth muscle actin staining, was unchanged (Fig. 4B). Staining for glial fibrillary protein revealed an accumulation of activated astrocytes at locations of hemorrhaged blood vessels in SrfiECKO brains (Fig. 4C). Importantly, no accumulation of astrocytes was evident near intact blood vessels in SrfiECKO brains, indicating a specific astrocyte response to signals emanating from ruptured vessels in SrfiECKO animals.
Fig. 4.
SrfiECKO cerebral microvessels show reduced collagen IV staining and elevated astrocyte recruitment. (A) Collagen IV staining of P10 cerebral microvessels in control (Upper) and SrfiECKO (Middle) brains, as quantified by immunofluorescence signal intensity (Lower). (Left) Transverse section. (Scale bar, 20 μm.) (Center) Longitudinal section. (Scale bar, 50 μm.) (Right) Capillary. (Scale bar, 20 μm.) (B) Smooth muscle actin (SMA) staining of adult control (Upper) and SrfiECKO (Middle) brains revealed no significant difference in smooth muscle cell presence (Lower). (Scale bar, 20 μm.) (C) Astrocytes stained by glial fibrillary acidic protein (GFAP) accumulate specifically around lesion sites in adult SrfiECKO brains (Middle; hemorrhage highlighted by asterisk). Quantification of astrocyte number per field of view (n = 5; Lower). (Scale bar, 50 μm.) Data are presented as means ± SEM. **P < 0.01; ***P < 0.001; ns, not significant.
Fig. 5.
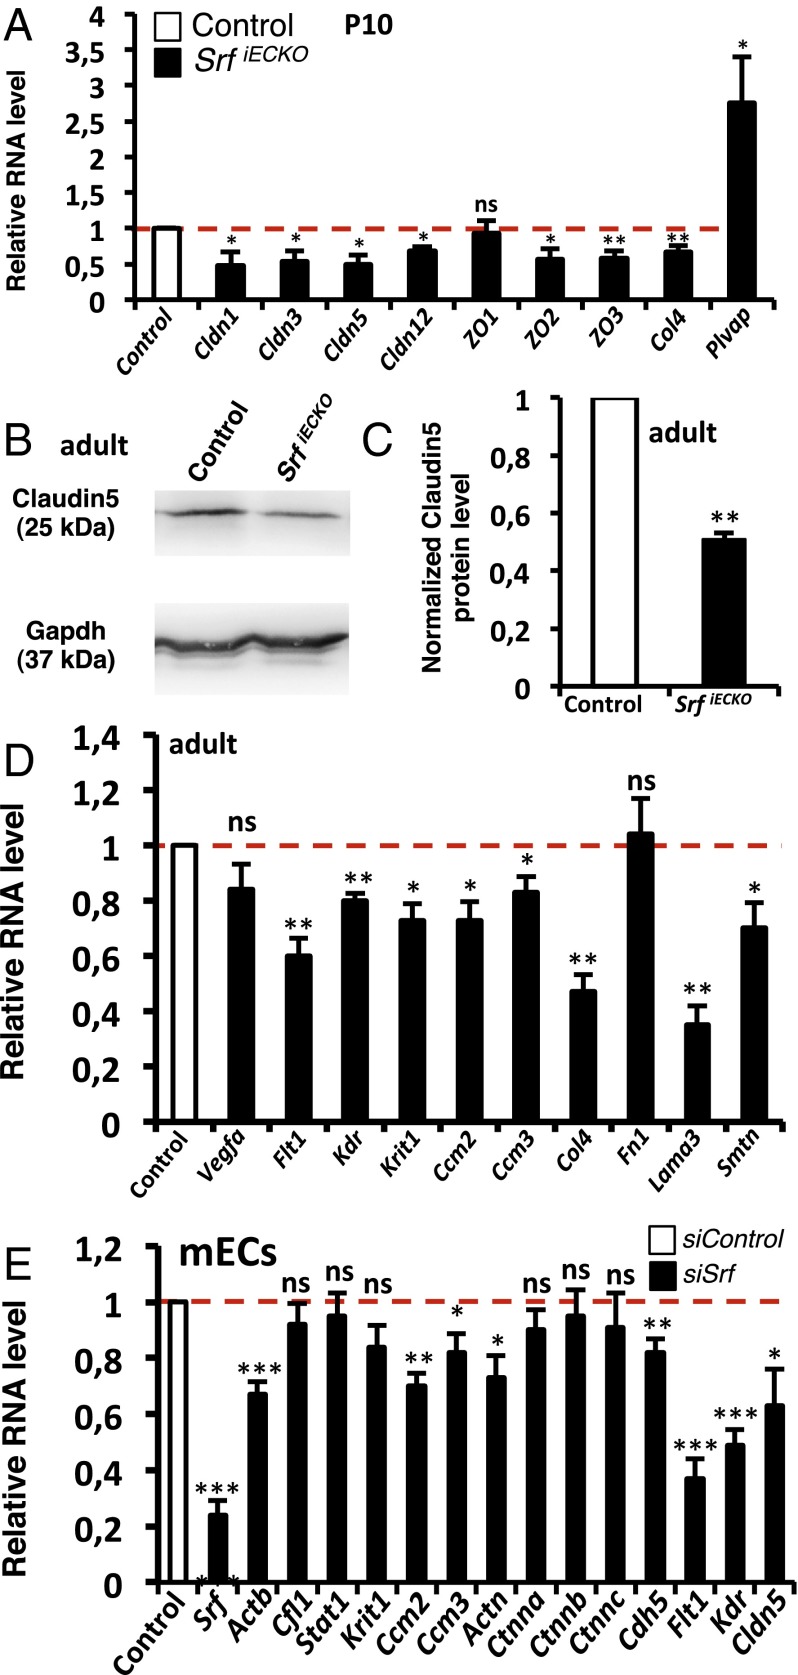
Hemorrhaging correlates with down-regulation of tight junctions, adherens junctions, and basement membrane components. (A) Relative RNA levels (P10; whole brain) of tight junction components (Claudins and ZOs), Collagen IV, and Plvap in control vs. SrfiECKO animals (n > 5). (B) Western blot (adult, whole brain) of control vs. SrfiECKO animals for Claudin5 protein expression. Loading control: Gapdh. (C) Western blot quantitation (adult, whole brain) of Claudin5 in control vs. SrfiECKO animals (n = 3). (D) Relative RNA levels of Vegfa, angiogenic receptors, different Ccms, and components of the basement membrane (adult, whole brain) of control vs. SrfiECKO animals (n > 5). (E) mECs treated with control siRNA or siRNA against Srf; quantitative RT-PCR analysis (n = 5) for selected target genes. Data are presented as means ± SEM. *P < 0.05; **P < 0.01; ***P < 0.001; ns not significant.
Reduced EC Junction Components in SrfiECKO Brains.
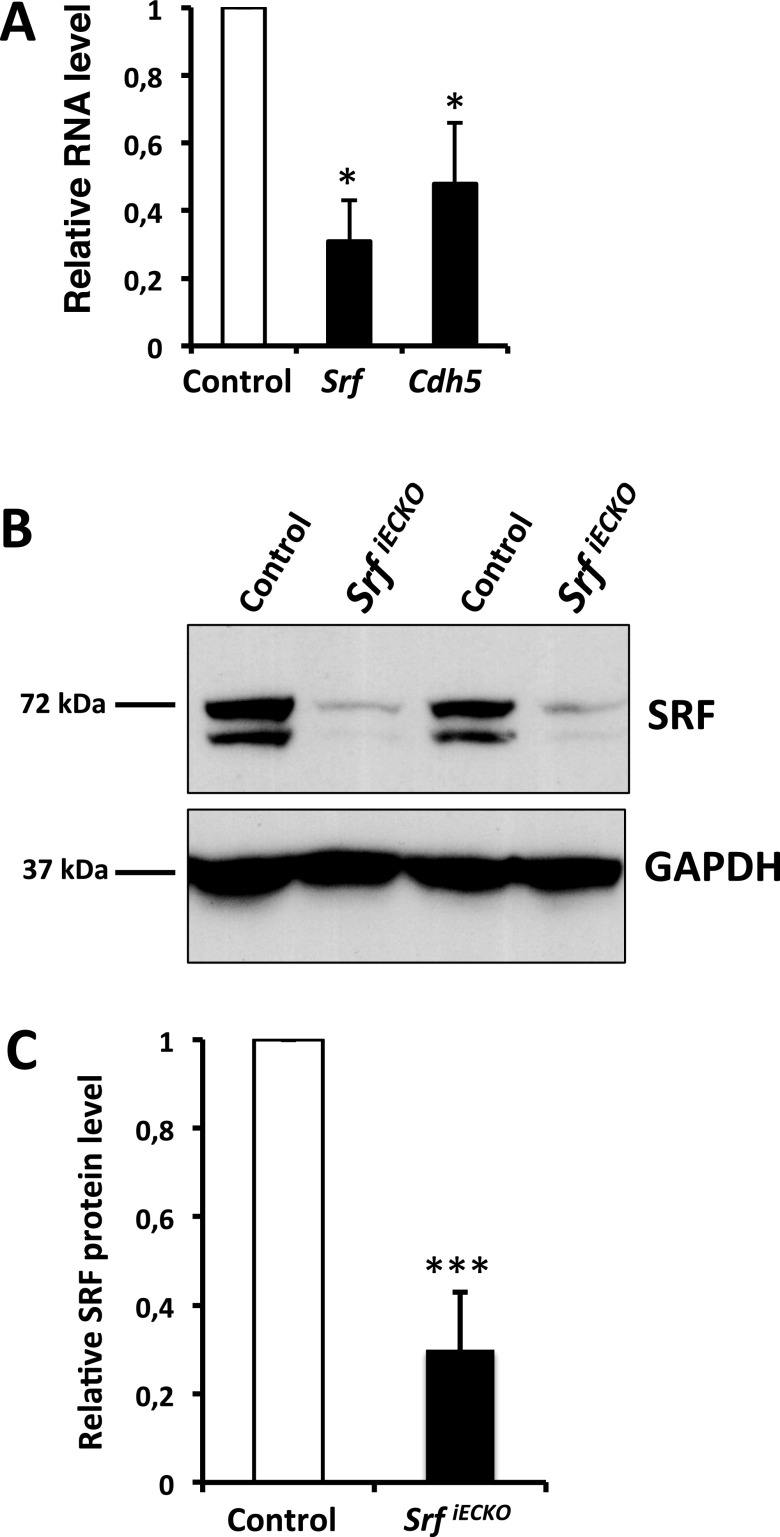
The integrity of the BBB depends on functional EC-connecting adherens junctions and tight junctions. We found that VE-Cadherin (Cdh5), a known SRF target gene encoding the main EC structural component of adherens junctions, was down-regulated in purified cerebral ECs from P10 SrfiECKO animals, in close association with SRF depletion (Fig. S7). Regarding genes encoding tight junction proteins, Claudin1, 3, 5, and 12, as well as ZO2 and ZO3, were significantly down-regulated in P10 whole brain tissue on the RNA level, whereas ZO1 expression was not altered (Fig. 5A). Also, RNA expression of the basement membrane component Col4 was reduced in SrfiECKO whole brain tissue, whereas plasma lemma vesicle associated protein (Plvap), a marker for BBB breakdown (16), was significantly increased (Fig. 5A). Claudin5 protein expression was significantly down-regulated in adult SrfiECKO brain lysates (Fig. 5 B and C). In acute-phase brain tissue of adult SrfiECKO animals, RNA levels of vascular endothelial growth factor a (Vegfa), an indicator of hypoxia, were unchanged, whereas RNA levels of known SRF targets—namely, angiogenic receptor genes Vegfr-1 (Flt1) and Vegfr-2 (Kdr) and Smoothelin-b (Smtn)—were significantly down-regulated. RNA levels of the cerebral cavernous malformation genes Ccm1 (Krit1), Ccm2, and Ccm3, as well as Lamininα3 (Lama3), were down-regulated (Fig. 5D).
Fig. S7.
Expression of Srf and Cdh5 on RNA level and SRF protein in the knockout model. (A) Relative RNA level of Srf and Cdh5 in magnetic beads enriched ECs of P10 control vs. SrfiECKO brains (n = 3 independent experiments). (B) Western Blotting of two representative pairs of P10 control vs. SrfiECKO whole brain lysates. SRF was detected by using the 2C5 antibody; GAPDH served as a loading control. (C) Quantitation of five pairs of P10 control vs. SrfiECKO whole brain lysates of Western blotting analysis as shown in B (n = 5). Data are presented as means ± SEM. *P < 0.05; ***P < 0.001.
We complemented the above tissue expression studies by analyses of cultured mouse ECs (mECs) transfected with siRNA against Srf. Here, we found that Srf and the SRF target genes β-actin (Actb), Vegfr-1, and Vegfr-2 were significantly down-regulated, as well as the adherens junction components α-Actinin (Actn) and Cdh5 and the tight junction component Claudin5 (Fig. 5E). Cofilin (Cfl1) served as negative control, and Stat1 was used as an indicator of the IFN response associated with siRNA treatment, which was not induced in our experimental setup (Fig. 5E). Expression of Ccm2 and Ccm3, but not Ccm1, was dependent on SRF expression (Fig. 5E). α-, β-, and γ-Catenin (Ctnna, Ctnnb, and Ctnnc, respectively) were unaffected. These findings suggest that the observed hemorrhages in brains of SrfiECKO animals is due—at least in part—to impaired expression of EC junctional proteins, basement membrane components, or junction-associated proteins like CCMs, which were previously associated with stroke in murine and human systems (17).
Together, EC-specific Srf deletion results in multifocal hemorrhages, likely induced by a general weakening of the BBB due to transcriptional down-regulation of tight junction, adherens junction, and basement membrane structural proteins. The Srf mouse model serves as a genetic platform to study hemorrhagic stroke in a noninvasive manner—not requiring anesthesia or surgery—to explore strategies for early diagnoses and therapeutical treatments of BBB pathologies, including stroke.
Discussion
Human SVD accounts for at least 20% of all ischemic and hemorrhagic stroke (3), with intracerebral hemorrhage and microbleeds being vascular lesions serving as SVD markers (2, 3, 18). The genetic basis of human SVD-associated intracerebral hemorrhage is beginning to be understood, with autosomal-dominant single gene disorders being identified for the APP gene in cerebral amyloid angiopathy, the COL4A1 gene in COL4A1-related intracerebral hemorrhage, and the CCM genes in stroke-prone cerebral cavernous malformations (18). In addition, non-Mendelian risk factors for hemorrhagic stroke associate with genomic loci encoding the PMF1/SLC25A44, APOE, and COL4A2 genes (18). We demonstrate here that, in mice, independent null mutations in genes encoding the transcription factors SRF and MRTF-A/-B, but not Elk1, Elk3, and Elk4, cause lethal symptoms of hemorrhagic stroke. These symptoms are highly reminiscent of those observed in human patients suffering from SVD. We therefore hypothesize that deficiencies in SRF/MRTF activity may contribute to human intracerebral hemorrhage pathology. EC-specific Srf deletion in adult mice may serve as an animal model for cerebral microvascular dysfunction.
MRI has proven highly valuable in clinical human stroke management (3). Specifically, identification of cerebral microbleeds by T2*-weighted MRI has been associated with vessel fragility, blood extravasation, and future risk of primary or recurrent intracerebral hemorrhage (3, 4). Similarly, in SrfiECKO animals, MRI analysis using both T2WI and contrast-enhanced T1WI allowed identification of microbleeds, intracerebral hemorrhages, and vessel permeability. T2WI allowed the detection and localization of microbleeds in SrfiECKO animals, presenting as lesions of hypointense signal produced by superparamagnetic hemosiderin deposits (3, 19, 20) (Fig. 3B). Progressive temporal increase in microbleed number was generally observed (Fig. 3C), as described for human stroke patients (21). T2*-weighted images or Susceptibility Weighted Images are used clinically to identify microbleeds and are therefore recommended in future studies for better quantification of microbleed volumes. Microbleeds were also identified by Magnevist-enhanced T1WI (Fig. 3B), which revealed dynamic changes in signal over time (Fig. 3D), as also seen in human patients (22). The temporal changes of T1WI lesions might reflect the progression in behavioral phenotype of the animals, which displayed an initial mild-symptom stage and a recovery phase, followed by an acute lethal stage (Fig. 3 and Fig. S5).
Some T1WI lesions preceded the appearance of corresponding T2WI lesions at identical locations (Fig. 3B, differential arrow at nTP3). Such T1WI lesions may therefore indicate ongoing microbleeding during measurement. Indeed, Magnevist is a gadolinium-based contrast agent commonly used for detection of a disrupted BBB and/or abnormal vascularity (23, 24). Therefore, T1WI lesion distribution and pattern of appearance may reflect general small-vessel fragility in SrfiECKO animals.
Such general vessel fragility may associate with vascular permeability in SrfiECKO brains. Indeed, there are significant differences between control and SrfiECKO animals at nTP2, nTP3, and nTP4. Even at nTP1, there is a trend for higher percent change in the SrfiECKO (Fig. 3 E and F). This finding suggests that there is global increase of either contrast agent stagnancy or BBB permeability, with the latter allowing extravasation of contrast agent before and/or during vessel rupture. Global vessel permeability, as indicated by leakage of the low-molecular-weight MRI tracer Magnevist, was not revealed by EB or Sulfo-NHS-LC-Biotin staining, which only extravasated at localized points of vessel rupture (Fig. 2 and Fig. S4). This result may be due to these dyes forming high-molecular-weight complexes with blood components such as albumin. Together, our MRI data obtained with SrfiECKO mice mirror human cerebral microbleeding and intracerebral hemorrhage (19, 22, 25), supporting the intriguing possibility that SRF deficiency may contribute to human hemorrhagic stroke pathology.
Human cerebral cavernous malformation associates with hemorrhagic stroke, in part caused by mutations in CCM genes (26). Interestingly, Ccm1, Ccm2, and Ccm3 RNA levels were significantly decreased in brains of adult SrfiECKO animals (Fig. 5D). However, we note the complete absence of cavernae in SrfiECKO brains, indicating that SrfiECKO mice do not provide a model of human cerebral cavernous malformation.
Microbleeds of SrfiECKO mice are similarly found in human cerebral amyloid angiopathy (4), indicating a shared feature of vessel fragility. In cerebral amyloid angiopathy, amyloid plaques of neuronal origin deposited in the vessel wall are believed to cause this fragility (4, 27). However, no Kongo Red-positive amyloid plaques were observed in SrfiECKO animals (Fig. S5), ruling out a common cause for microbleed formation in human cerebral amyloid angiopathy and SrfiECKO mice.
Vessel hemorrhaging is likely caused by molecular defects in EC junction structures. First, regarding tight junction components, Claudins and ZO adapter proteins were down-regulated in SrfiECKO brains. Murine genes encoding Claudin12 and ZO-2 are direct SRF/MRTF target genes, as shown for murine fibroblasts (7). Interestingly, Cld5−/− knockout mice show a size-selective BBB permeability (28). Second, regarding adherens junction components, the Cdh5 gene was identified as a direct SRF target gene (11, 12). In line, mouse embryos lacking Cdh5 die at embryonic day 9.5 (E9.5) (29), and disruption of Cdh5 in the adult murine vasculature causes hemorrhaging (29, 30). The adherens junction component Actn, down-regulated in SRF-deficient mECs (Fig. 5E), may be regulated indirectly by SRF. Third, both tight junctions and adherens junctions derive mechanical strength by linkage to cytoskeletal actin microfilaments (5). Actin genes are prototypical SRF/MRTF target genes (8) and Actb RNA was down-regulated in SRF knockdown mECs (Fig. 5E). Fourth, reduced levels of basement membrane proteins may cause small vessel fragility. Indeed, expression of the Col4 gene (encoding Collagen typeIV) was reduced in SrfiECKO P10 brains at RNA (Fig. 5A) and protein (Fig. 4) level and at RNA level in adult SrfiECKO brains (Fig. 5D). Interestingly, mutant Col4a1 mice display intracerebral hemorrhage (31), similar to SrfiECKO animals. In some human SVD patients with intracerebral hemorrhage, mutations in COL4A1 and COL4A2 are found (18, 31), as well as COL4A2 polymorphisms in sporadic intracerebral hemorrhage (32). Thus, the correlation of intracerebral hemorrhage occurrence and Collagen IV deficiency is shared between Col4a1(−/−) mice, SrfiECKO mice, and some human SVD patients.
In conclusion, SrfiECKO and Mrtf-a(−/−)Mrtf-biECKO mice identify the SRF/MRTF transcriptional control module as an essential regulator of cerebral microvascular integrity. The entire assembly of EC junction components—including tight junctions, adherens junctions, their linked actin cytoskeleton, and the basement membrane—are built from key structural proteins encoded by SRF/MRTF target genes. Consistently, SRF/MRTF deficiency in murine ECs causes small vessel fragility and brain hemorrhage. Although SrfiECKO mice demonstrate the essential role of SRF/MRTF in cerebral microvessel stability, SRF/MRTF might fulfill a similar function in the human brain. Accordingly, some hemorrhagic stroke-associated human conditions may be caused by impaired SRF/MRTF activity. Thus, we speculate that the increase in hemorrhagic incidence associated with increasing age of mice (33) and human patients (34) might have a common underlying basis in age-dependent down-regulation of SRF/MRTF activity, potentially exerted either by epigenetic mechanisms (35) reducing SRF/MRTF expression or posttranslational mechanisms impairing SRF/MRTF function (36).
Materials and Methods
Mouse Models.
SrfiECKO and Mrtf-a(−/−)Mrtf-biECKO mice were generated as described (11). Induction of deletion by Tamoxifen is described in SI Materials and Methods. Elk1/Elk4 double-knockout (14) and Elk3 knockout (15) animals were bred as described. Genotyping was performed by PCR of ear biopsies. All animal experiments were approved by the Regierungspraesidium Tuebingen (Germany).
EC Culture and siRNA Treatment.
Immortalized mECs were cultured and transfected (11, 37) as described in SI Materials and Methods.
RNA Isolation, cDNA Synthesis, and Semiquantitative RT-PCR.
For description of methods regarding RNA isolation, cDNA synthesis, and semiquantitative RT-PCR (38), see SI Materials and Methods.
Western Blotting.
Brain tissue was lysed in radioimmunoprecipitation assay buffer, and SRF and Claudin5 protein levels were detected by Western blotting (11, 39), as described in SI Materials and Methods.
MRI.
MR images were acquired by using a Clinscan 7T MR scanner (Bruker Biospin) using a four-channel mouse brain surface coil. For detailed imaging protocols, data analysis, and statistics, see SI Materials and Methods.
Histological H&E and Immunohistochemistry.
For details regarding H&E staining, immunohistochemistry, microscopic analysis, and signal quantitation, see SI Materials and Methods.
Sulfo-NHS-LC-Biotin Labeling.
For staining of luminal protein content and localization of sites of extravasation, Sulfo-NHS-LC-Biotin labeling (40) is described in SI Materials and Methods.
Statistics.
Values are presented as means ± SEM. For comparison of different experiments, values are normalized to the control = 1 or 100%. To test significance, Student’s t tests were used; P < 0.05 was considered statistically significant.
SI Materials and Methods
Tamoxifen Injections.
Newborn pups were injected daily on P1–P4 (0.05 mg of tamoxifen, dissolved in sunflower oil) and analyzed from P6 onward at the annotated time points. For adult analysis, mice 4–6 wk of age were injected intraperitoneally with 2 mg of tamoxifen (dissolved in sunflower oil) on five consecutive days and analyzed at different time points ranging from 2 to 28 wk after the last injection.
Behavioral Tests.
Videos of freely acting animals in their home cage were recorded. Movement was measured in seconds and calculated as percent movement of whole video recording time. Events of exploratory behavior were counted during 1-min videos.
EB Labeling.
A total of 100 μL of EB [2% (wt/vol) in PBS; Sigma E-2129] was injected intraperitoneally 24 h before dissection of brains, livers, and kidneys (40). Organs were fixed for 3–4 d in 4% PFA, photographed intact, and embedded in agarose for vibratome sectioning. To quantify number of EB leakage foci per brain, agarose-embedded brains were cut into 50-μm sections on a vibratome. Brain sections were photographed, and macroscopically visible foci of EB leakage were counted.
Sulfo-NHS-LC-Biotin Labeling.
For staining of luminal protein content and localization of sites of extravasation, Sulfo-NHS-LC-Biotin labeling was used. A total of 10–15 mL of 0.5 mg/mL Sulfo-NHS-LC-Biotin (Thermo Scientific 21335) was perfused in deeply anesthetized animals followed by perfusion with 1% PFA (40). After dissection of brains, livers, kidneys, and eyes, organs were postfixed for 3–4 d in 1% PFA, and 100-μm vibratome sections were incubated with Streptavidin-Alexa 488 [1:100 in PBSTC (PBS + 0.5% Triton + 0.1mM CaCl2)]. Eyes were fixed in 4% PFA for 2 h, and retinal flat-mounts were generated as described (11). Sections were embedded in Mowiol.
Purification of ECs.
P10 brains were dissected and freshly homogenized in 0.2% collagenase in PBS at 37 °C for 45 min. Cells were triturated by using a 20 G1 1/2 syringe, passed through a 40-μm cell strainer, pelleted at 1,100 rpm (Megafuge 2.0 R, Heraeus Instruments; rotor #8155, Heraeus Instruments) for 5 min, and resuspended in serum-free endothelial-specific human umbilical vein ECs medium. ECs were bound to magnetic Dynabeads (Invitrogen) coated with anti-CD31 (Pharmingen) for 30 min at 4 °C and separated magnetically from non-ECs.
EC Culture and siRNA Treatment in Vitro.
Immortalized mECs were cultured as described (11, 37). mECs were cultured in medium without penicillin/streptomycin 1 d before siRNA transfection. Transfection was performed at 60% confluency of cells. RNAiMAX reagent (Invitrogen) was used for 5 h at 166 pmol siRNA/dish and RNA was isolated 2 d later for quantitative RT-PCR (qRT-PCR).
Sequences for siGL2 (control):
Sense: CGUACGCGGAAUACUUCGAdTdT,
Antisense: UCGAAGUAUUCCGCGUACGdTdT,
Sequences for siSRF:
Sense: GAUGGAGUUCAUCGACAACAA,
Antisense: GUUGUCGAUGAACUCCAUCUU.
RNA Isolation, cDNA Synthesis, and Semiquantitative RT-PCR.
Tissues were lysed for RNA isolation as recommended (Qiagen; RNeasy), cDNA was synthesized by using random hexamers, and RT-PCR analysis was performed by using specific primers (Purimex) and SYBR green technology in an ABI Prism 7000 cycler (38). Primer mix for one sample included 10 μM forward primer (0.3 μL), 10 μM reverse primer (0.3 μL), and 2.4 μL of water. cDNA mix for one sample included 5 μL of SYBR green and 2 μL of cDNA. For each qRT-PCR, 7 μL of the cDNA mix and 3 μL of the primer mix were combined in the 96-well plates. Primer sequences are in Table S1. Amplification protocol: segment 1: 50 °C, 2 min; segment 2: 95 °C, 10 min; segment 3: 95 °C, 15 s, 60 °C, 1 min, 40 cycles.
Table S1.
Primer sequences for qRT-PCR
| Gene | Primer sequences | |
| Forward | Reverse | |
| Gapdh | TGGATCTGACGTGCCGC | TGCCGTCTTCACCACCTTC |
| Srf | CACGACCTTCAGCAAGAGGAA | CAAAGCCAGTGGCACTCATTC |
| Actb | AGAGAGGTATCCTGACCCTGAAGT | CACGCAGCTCATTGTAGAAGGTGT |
| Kdr | GATGCCCGACTCCCTTTGA | CGAAAGACCACACATCGCTCT |
| Flt1 | AGCCTACCTCACCGTGCAAG | AAAAGAGGGTCGCAGCCAC |
| Vegfa | TCACCAAAGCCAGCACATAG | TTGACCCTTTCCCTTTCCTC |
| Col4 | CGGAGGAAGAAACTGCTCTG | CACCAGTTGGACCCTTGTCT |
| Krit1 | GGGCTTTTATACAGCTCCTGATG | TACTGACGCCCTCACTCAGAC |
| Ccm2 | AAGCCTGGAATTGTGTCGC | CCTTCTCAATATAGTCGCTCAGC |
| Ccm3 | TCACCGAGTCCCTCCTTCG | GCCCGTGCCTTTTCATTTAGG |
| Actn1 | GACCATTATGATTCCCAGCAGAC | CGGAAGTCCTCTTCGATGTTCTC |
| Ctnna | AAGTCTGGAGATTAGGACTCTGG | ACGGCCTCTCTTTTTATTAGACG |
| Ctnnb | ATGGAGCCGGACAGAAAAGC | CTTGCCACTCAGGGAAGGA |
| Ctnnc | TGGCAACAGACATACACCTACG | GGTGGTAGTCTTCTTGAGTGTG |
| Cdh5 | CTGCGAGGCAGAAAGTAACC | ACCCACACCTTCCTCTCCTT |
| Cldn 1 | GATGTGGATGGCTGTCATTG | CGTGGTGTTGGGTAAGAGGT |
| Cldn 3 | GAGATGGGAGCTGGGTTGTA | GTAGTCCTTGCGGTCGTAGG |
| Cldn 5 | CTGGACCACAACATCGTGAC | GCCGGTCAAGGTAACAAAGA |
| Cldn 12 | AACTGGCCAAGTGTCTGGTC | AGACCCCCTGAGCTAGCAAT |
| Z01 | ACCCAGCAAAGGTGTACAGG | CCGTAGGCGATGGTCATAGT |
| Z02 | CGGATTCCAGACAAGGTGTT | CCTTCAGAGACCCAGACTGC |
| Z03 | GGGTGAAGCTAGGCAGTCAG | TCTCAATGAGCCTTCGTGTG |
| Plvap | TCGTGTCGCTCATTCAGTTC | AGGTTAGCCTGTGAGGCAGA |
| Fn1 | GTGTAGCACAACTTCCAATTACGAA | GGAATTTCCGCCTCGAGTCT |
| Lama3 | TTTTTGTGGTGGACGTGAATCT | CACGGGATGCTGTACTTGCA |
| Smtn | TGCCGGTCTCTACTGCATCTAC | TTCCGGCGCAGTTTCGT |
| Cfl1 | TCTGGGCCCCCGAGAAT | TTGATGGCATCCTTGGAGC |
| Stat1 | GCTGGGCGTCTATCCTGTGGT | GCTCAGCTGGTCTGCGTTCA |
Primer sequences for qRT-PCR of mouse tissue RNAs. Shown are forward and reverse sequences for analyzed target genes. Gapdh was used as a housekeeping gene for normalization in all experiments.
MRI.
The animals were anesthetized by using Isoflurane induction at 2% and maintenance at 1.2% vaporized in 100% O2 at a flow rate of 1.5 L/min. Temperature and breathing rate were monitored throughout the acquisitions, with temperature maintained in the range of 37 ± 0.5 °C. The imaging protocol consisted of an anatomical T2WI followed by T1WI before and 5 min after i.v. Magnevist (0.1 mmol per kg of body weight) injection. Acquisitions were made every 2 wk starting at week 8 of age (2 wk after Tamoxifen treatment) for a period of 16 wk on five control and seven SrfiECKO mice.
T2WIs were produced by using a 3D-spoiled turbo spin echo sequence (256 × 161 matrix, 35 × 57 mm2 field of view (FOV), repetition time (TR) = 3,000 ms, echo time (TE) = 205 ms, slice thickness: 0.21 mm). T1WIs were acquired by using a 3D-spoiled gradient spin echo sequence (162 × 192 matrix, 20 × 24 mm2 FOV, TR = 20 ms, TE = 4.64 ms, slice thickness: 0.10 mm).
For MRI data evaluation, image analysis and mapping were performed by using PMOD Software v3.2 (PMOD Technologies Ltd.). T2WI lesions were identified and counted. Postcontrast and precontrast T1WIs were subtracted for contrast-enhanced lesion identification and quantification. T1WI images were further normalized to produce maps of the overall percentage signal change relative to the precontrast image. The maps were calculated by dividing the subtracted T1WI by the corresponding precontrast T1WI and multiplied by 100. In addition, the percent change signal maps were temporally normalized, because the time of lesion appearance varied from mouse to mouse. For temporal normalization, four time points were fixed according to the appearance of lesions on separate T2WI analysis. nTP1 and nTP2 correspond to the acquisitions done at weeks 8 and 10, whereas nTP3 corresponds to the acquisitions done 2 wk before the first identification of T2WI lesions. The time point nTP4 corresponds to the measurements belonging to the first T2WI lesion appearance. Surviving animals underwent final MRI at an age of 24 wk (LTP) before the animals were finally killed and used for postmortem analysis. For each mouse, a template representing the whole brain structure of every normalized map was used to extract the average percent signal change. For statistical analysis, Mauchly’s Sphericity test was performed to determine a valid variance for the groups studied. Repeated-measures analysis of variance and Tukey's Honest Significant Difference tests were performed using SPSS software v22 (IBM Corp.).
Western Blotting.
Brain tissue was lysed in radioimmunoprecipitation assay buffer [50 mM Tris⋅HCl, pH 8, 150 mM NaCl, 1% Nonidet P-40, 0.5% Sodiumdeoxycholat, 0.1% SDS, 1 mM EDTA, protease and phosphatase inhibitors (Roche)], protein content was determined (Bradford assay), and proteins were separated by 10% or 12% SDS/PAGE, for detection of SRF and Claudin5, respectively. Electrotransfer, membrane blocking, washings, and incubations with antibodies were performed according to ref. 11. Primary antibodies were mouse anti-GAPDH at 1:20,000 (Hytest Ltd.), rat anti-SRF (2C5; undiluted) (39), and rabbit anti-Claudin5 at 1:500 (Abcam). Secondary antibodies (GE Healthcare) were anti-mouse IgG HRP-conjugated (1:15,000), anti-rat IgG HRP-conjugated (1:10,000), and anti-rabbit IgG HRP-conjugated (1:20,000). Band intensities were quantified densitometrically and normalized to GAPDH by using PeqLab Fusion software.
Histological H&E and Immunohistochemistry.
Brains were fixed for 3–4 d at 4 °C in 4% formaldehyde in PBS and embedded in paraffin. Individual 6-μm sections were mounted on adhesive glass slides (Superfrost Plus), dewaxed in xylene, rehydration in descending graded ethanol, followed by H&E staining, Periodic Acid Schiff (PAS) reactivity, Turnbull Blue staining (detects ferrous and ferric iron), Kongo Red staining, or Nissl staining. Additional Perls' Prussian Blue staining confirmed detection of ferric iron.
For immunohistochemistry, paraffin sections were blocked in 2% BSA/PBS-T for 1 h at room temperature (RT), followed by incubation with primary antibody overnight at 4 °C. After washing three times with PBS-T for 15 min, secondary antibodies were applied for 1 h at RT. For microscopic analysis, sections were embedded in Mowiol. Primary antibodies were rabbit glial fibrillary acidic protein (GFAP) 1:250 (DAKO), rabbit collagen IV (1:250; Bio-Rad), and anti-smooth muscle actin Cy3-conjugated (1:200; Sigma). Secondary antibody was goat anti-rabbit IgG Alexa Fluor 546 (1:500; Molecular Probes).
Microscopic Analysis and Image Quantitation.
For fluorescent staining analysis, a Zeiss Axiovert 200 M microscope equipped with an AxioCam MRm camera and an ApoTome (Zeiss) was used. Pictures were acquired by using AxioVision Software. Overviews of whole brain sections and retinal flat-mounts were generated at 5× magnification and automatically processed by using MosaiX Software. H&E-stained sections were visualized with a Zeiss Axioplan 2 using an AxioCamHRc camera. Higher magnifications were obtained with 10× and 20× objectives.
Quantitation of Collagen IV and SMA immunofluorescence staining was performed separately on transverse and longitudinal sectioned blood vessels and brain capillaries, measuring mean fluorescence intensities subtracted by background fluorescence intensities for control and SrfiECKO P10 brains. During image acquisition, the same exposure time was applied for all slides analyzed. To quantify the number of astrocytes recruited to sites of hemorrhage, images of intact and ruptured adult blood vessels in control and SrfiECKO brains stained for GFAP were recorded with the same magnification, and GFAP-positive cells were counted in the FOV.
Electron Microscopy.
For electron microscopy, brains were fixed 4 h in 2.5% glutaraldehyde (Paesel and Lorei) in 0.1 M cacodylate buffer (pH 7.4). Specimens were washed in pure cacodylate buffer, postfixed overnight in 1% OsO4 in cacodylate buffer for 1 h, dehydrated in ascending series of ethanol and propyleneoxide, bloc-stained in uranyl-acetate for 4 h, and flat-embedded in Araldite (Serva). By using an ultramicrotome (Ultracut; Leica), semithin (1 µm) and ultrathin sections (50 nm) were cut. Ultrathin sections were stained with lead citrate, mounted on copper grids, and analyzed with a Zeiss EM 10 (Oberkochen) electron microscope. Pictures were scanned at 300 dpi and processed (Adobe Photoshop).
Acknowledgments
We thank R. Treisman for providing Elk1(-/0)::Elk4(−/−) dKO mice, G. Frommer-Kästle for help with electron microscopy, S. Alberti for advice on animal experimentation, and U. Ehrnemann and A. Pagenstecher for clinical advice. C.W. and A.N. were supported by the Dr. Karl-Kuhn-Foundation and Deutsche Forschungsgemeinschaft No120/12-4.
Footnotes
The authors declare no conflict of interest.
This article contains supporting information online at www.pnas.org/lookup/suppl/doi:10.1073/pnas.1509047112/-/DCSupplemental.
References
- 1.Go AS, et al. American Heart Association Statistics Committee and Stroke Statistics Subcommittee Executive summary: Heart disease and stroke statistics--2013 update: A report from the American Heart Association. Circulation. 2013;127(1):143–152. doi: 10.1161/CIR.0b013e318282ab8f. [DOI] [PubMed] [Google Scholar]
- 2.Haffner C, Malik R, Dichgans M. Genetic factors in cerebral small vessel disease and their impact on stroke and dementia. J Cereb Blood Flow Metab. April 22, 2015 doi: 10.1038/jcbfm.2015.71. [DOI] [PMC free article] [PubMed] [Google Scholar]
- 3.Wardlaw JM, Smith C, Dichgans M. Mechanisms of sporadic cerebral small vessel disease: Insights from neuroimaging. Lancet Neurol. 2013;12(5):483–497. doi: 10.1016/S1474-4422(13)70060-7. [DOI] [PMC free article] [PubMed] [Google Scholar]
- 4.Yates PA, et al. Cerebral microbleeds: A review of clinical, genetic, and neuroimaging associations. Front Neurol. 2014;4:205. doi: 10.3389/fneur.2013.00205. [DOI] [PMC free article] [PubMed] [Google Scholar]
- 5.Daneman R, Prat A. The blood-brain barrier. Cold Spring Harb Perspect Biol. 2015;7(1):a020412. doi: 10.1101/cshperspect.a020412. [DOI] [PMC free article] [PubMed] [Google Scholar]
- 6.Cen B, Selvaraj A, Prywes R. Myocardin/MKL family of SRF coactivators: Key regulators of immediate early and muscle specific gene expression. J Cell Biochem. 2004;93(1):74–82. doi: 10.1002/jcb.20199. [DOI] [PubMed] [Google Scholar]
- 7.Esnault C, et al. Rho-actin signaling to the MRTF coactivators dominates the immediate transcriptional response to serum in fibroblasts. Genes Dev. 2014;28(9):943–958. doi: 10.1101/gad.239327.114. [DOI] [PMC free article] [PubMed] [Google Scholar]
- 8.Olson EN, Nordheim A. Linking actin dynamics and gene transcription to drive cellular motile functions. Nat Rev Mol Cell Biol. 2010;11(5):353–365. doi: 10.1038/nrm2890. [DOI] [PMC free article] [PubMed] [Google Scholar]
- 9.Posern G, Treisman R. Actin’ together: Serum response factor, its cofactors and the link to signal transduction. Trends Cell Biol. 2006;16(11):588–596. doi: 10.1016/j.tcb.2006.09.008. [DOI] [PubMed] [Google Scholar]
- 10.Franco CA, et al. SRF selectively controls tip cell invasive behavior in angiogenesis. Development. 2013;140(11):2321–2333. doi: 10.1242/dev.091074. [DOI] [PubMed] [Google Scholar]
- 11.Weinl C, et al. Endothelial SRF/MRTF ablation causes vascular disease phenotypes in murine retinae. J Clin Invest. 2013;123(5):2193–2206. doi: 10.1172/JCI64201. [DOI] [PMC free article] [PubMed] [Google Scholar]
- 12.Franco CA, et al. Serum response factor is required for sprouting angiogenesis and vascular integrity. Dev Cell. 2008;15(3):448–461. doi: 10.1016/j.devcel.2008.07.019. [DOI] [PubMed] [Google Scholar]
- 13.Winkler DT, et al. Spontaneous hemorrhagic stroke in a mouse model of cerebral amyloid angiopathy. J Neurosci. 2001;21(5):1619–1627. doi: 10.1523/JNEUROSCI.21-05-01619.2001. [DOI] [PMC free article] [PubMed] [Google Scholar]
- 14.Costello P, et al. Ternary complex factors SAP-1 and Elk-1, but not net, are functionally equivalent in thymocyte development. J Immunol. 2010;185(2):1082–1092. doi: 10.4049/jimmunol.1000472. [DOI] [PubMed] [Google Scholar]
- 15.Weinl C, et al. Elk3 deficiency causes transient impairment in post-natal retinal vascular development and formation of tortuous arteries in adult murine retinae. PLoS One. 2014;9(9):e107048. doi: 10.1371/journal.pone.0107048. [DOI] [PMC free article] [PubMed] [Google Scholar]
- 16.Shue EH, et al. Plasmalemmal vesicle associated protein-1 (PV-1) is a marker of blood-brain barrier disruption in rodent models. BMC Neurosci. 2008;9:29. doi: 10.1186/1471-2202-9-29. [DOI] [PMC free article] [PubMed] [Google Scholar]
- 17.Cunningham K, et al. Conditional deletion of Ccm2 causes hemorrhage in the adult brain: A mouse model of human cerebral cavernous malformations. Hum Mol Genet. 2011;20(16):3198–3206. doi: 10.1093/hmg/ddr225. [DOI] [PMC free article] [PubMed] [Google Scholar]
- 18.Falcone GJ, Malik R, Dichgans M, Rosand J. Current concepts and clinical applications of stroke genetics. Lancet Neurol. 2014;13(4):405–418. doi: 10.1016/S1474-4422(14)70029-8. [DOI] [PubMed] [Google Scholar]
- 19.Roob G, et al. Frequency and location of microbleeds in patients with primary intracerebral hemorrhage. Stroke. 2000;31(11):2665–2669. doi: 10.1161/01.str.31.11.2665. [DOI] [PubMed] [Google Scholar]
- 20.Tong KA, et al. Susceptibility-weighted MR imaging: A review of clinical applications in children. AJNR Am J Neuroradiol. 2008;29(1):9–17. doi: 10.3174/ajnr.A0786. [DOI] [PMC free article] [PubMed] [Google Scholar]
- 21.Martinez-Ramirez S, Greenberg SM, Viswanathan A. Cerebral microbleeds: Overview and implications in cognitive impairment. Alzheimers Res Ther. 2014;6(3):33. doi: 10.1186/alzrt263. [DOI] [PMC free article] [PubMed] [Google Scholar]
- 22.Lee SH, et al. Dynamic temporal change of cerebral microbleeds: Long-term follow-up MRI study. PLoS One. 2011;6(10):e25930. doi: 10.1371/journal.pone.0025930. [DOI] [PMC free article] [PubMed] [Google Scholar]
- 23.Hynynen K, McDannold N, Vykhodtseva N, Jolesz FA. Noninvasive MR imaging-guided focal opening of the blood-brain barrier in rabbits. Radiology. 2001;220(3):640–646. doi: 10.1148/radiol.2202001804. [DOI] [PubMed] [Google Scholar]
- 24.Tsushima Y, Aoki J, Endo K. Brain microhemorrhages detected on T2*-weighted gradient-echo MR images. AJNR Am J Neuroradiol. 2003;24(1):88–96. [PMC free article] [PubMed] [Google Scholar]
- 25.Fisher M, French S, Ji P, Kim RC. Cerebral microbleeds in the elderly: A pathological analysis. Stroke. 2010;41(12):2782–2785. doi: 10.1161/STROKEAHA.110.593657. [DOI] [PMC free article] [PubMed] [Google Scholar]
- 26.Richardson BT, Dibble CF, Borikova AL, Johnson GL. Cerebral cavernous malformation is a vascular disease associated with activated RhoA signaling. Biol Chem. 2013;394(1):35–42. doi: 10.1515/hsz-2012-0243. [DOI] [PMC free article] [PubMed] [Google Scholar]
- 27.Biffi A, Greenberg SM. Cerebral amyloid angiopathy: A systematic review. J Clin Neurol. 2011;7(1):1–9. doi: 10.3988/jcn.2011.7.1.1. [DOI] [PMC free article] [PubMed] [Google Scholar]
- 28.Nitta T, et al. Size-selective loosening of the blood-brain barrier in claudin-5-deficient mice. J Cell Biol. 2003;161(3):653–660. doi: 10.1083/jcb.200302070. [DOI] [PMC free article] [PubMed] [Google Scholar]
- 29.Carmeliet P, et al. Targeted deficiency or cytosolic truncation of the VE-cadherin gene in mice impairs VEGF-mediated endothelial survival and angiogenesis. Cell. 1999;98(2):147–157. doi: 10.1016/s0092-8674(00)81010-7. [DOI] [PubMed] [Google Scholar]
- 30.Corada M, et al. Vascular endothelial-cadherin is an important determinant of microvascular integrity in vivo. Proc Natl Acad Sci USA. 1999;96(17):9815–9820. doi: 10.1073/pnas.96.17.9815. [DOI] [PMC free article] [PubMed] [Google Scholar]
- 31.Gould DB, et al. Role of COL4A1 in small-vessel disease and hemorrhagic stroke. N Engl J Med. 2006;354(14):1489–1496. doi: 10.1056/NEJMoa053727. [DOI] [PubMed] [Google Scholar]
- 32.Rannikmäe K, et al. METASTROKE Consortium; CHARGE WMH Group; ISGC ICH GWAS Study Collaboration; WMH in Ischemic Stroke GWAS Study Collaboration; International Stroke Genetics Consortium Common variation in COL4A1/COL4A2 is associated with sporadic cerebral small vessel disease. Neurology. 2015;84(9):918–926. doi: 10.1212/WNL.0000000000001309. [DOI] [PMC free article] [PubMed] [Google Scholar]
- 33.Toth P, et al. Aging exacerbates hypertension-induced cerebral microhemorrhages in mice: Role of resveratrol treatment in vasoprotection. Aging Cell. 2015;14(3):400–408. doi: 10.1111/acel.12315. [DOI] [PMC free article] [PubMed] [Google Scholar]
- 34.Bokura H, et al. Microbleeds are associated with subsequent hemorrhagic and ischemic stroke in healthy elderly individuals. Stroke. 2011;42(7):1867–1871. doi: 10.1161/STROKEAHA.110.601922. [DOI] [PubMed] [Google Scholar]
- 35.Pearce WJ. Epigenetics: An expanding new piece of the stroke puzzle. Transl Stroke Res. 2011;2(3):243–247. doi: 10.1007/s12975-011-0094-0. [DOI] [PMC free article] [PubMed] [Google Scholar]
- 36.Collard L, et al. Nuclear actin and myocardin-related transcription factors control disuse muscle atrophy through regulation of Srf activity. J Cell Sci. 2014;127(24):5157–5163. doi: 10.1242/jcs.155911. [DOI] [PubMed] [Google Scholar]
- 37.Benedito R, et al. The notch ligands Dll4 and Jagged1 have opposing effects on angiogenesis. Cell. 2009;137(6):1124–1135. doi: 10.1016/j.cell.2009.03.025. [DOI] [PubMed] [Google Scholar]
- 38.Weinhold B, et al. Srf(-/-) ES cells display non-cell-autonomous impairment in mesodermal differentiation. EMBO J. 2000;19(21):5835–5844. doi: 10.1093/emboj/19.21.5835. [DOI] [PMC free article] [PubMed] [Google Scholar]
- 39.Koegel H, et al. Loss of serum response factor in keratinocytes results in hyperproliferative skin disease in mice. J Clin Invest. 2009;119(4):899–910. doi: 10.1172/JCI37771. [DOI] [PMC free article] [PubMed] [Google Scholar]
- 40.Wang Y, et al. Norrin/Frizzled4 signaling in retinal vascular development and blood brain barrier plasticity. Cell. 2012;151(6):1332–1344. doi: 10.1016/j.cell.2012.10.042. [DOI] [PMC free article] [PubMed] [Google Scholar]


