

Abstract
Background
Smokeless tobacco is consumed in most countries in the world. In view of its widespread use and increasing awareness of the associated risks, there is a need for a detailed assessment of its impact on health. We present the first global estimates of the burden of disease due to consumption of smokeless tobacco by adults.
Methods
The burden attributable to smokeless tobacco use in adults was estimated as a proportion of the disability-adjusted life-years (DALYs) lost and deaths reported in the 2010 Global Burden of Disease study. We used the comparative risk assessment method, which evaluates changes in population health that result from modifying a population’s exposure to a risk factor. Population exposure was extrapolated from country-specific prevalence of smokeless tobacco consumption, and changes in population health were estimated using disease-specific risk estimates (relative risks/odds ratios) associated with it. Country-specific prevalence estimates were obtained through systematically searching for all relevant studies. Disease-specific risks were estimated by conducting systematic reviews and meta-analyses based on epidemiological studies.
Results
We found adult smokeless tobacco consumption figures for 115 countries and estimated burden of disease figures for 113 of these countries. Our estimates indicate that in 2010, smokeless tobacco use led to 1.7 million DALYs lost and 62,283 deaths due to cancers of mouth, pharynx and oesophagus and, based on data from the benchmark 52 country INTERHEART study, 4.7 million DALYs lost and 204,309 deaths from ischaemic heart disease. Over 85 % of this burden was in South-East Asia.
Conclusions
Smokeless tobacco results in considerable, potentially preventable, global morbidity and mortality from cancer; estimates in relation to ischaemic heart disease need to be interpreted with more caution, but nonetheless suggest that the likely burden of disease is also substantial. The World Health Organization needs to consider incorporating regulation of smokeless tobacco into its Framework Convention for Tobacco Control.
Electronic supplementary material
The online version of this article (doi:10.1186/s12916-015-0424-2) contains supplementary material, which is available to authorized users.
Background
Smokeless tobacco (SLT) consists of a number of products containing tobacco, which are consumed—without burning—through the mouth or nose [1]. A diverse range of SLT products are available worldwide, varying in their composition, methods of preparation and consumption, and associated health risks (Table 1) [1]. Its use is most prevalent in South and South-East Asia where one-third of tobacco is consumed in smokeless form [2, 3]. Wrapped in a betel leaf with areca nut, slaked lime, and catechu, SLT is often served at social occasions in this region. Other products (e.g. gutkha, khaini) contain slaked lime, areca nut, flavourings, and aromatic substances [4]. A number of products based on powdered tobacco (e.g. snus) are also consumed in Nordic countries and North America. In other parts of world, the most commonly used SLT products (Table 1) include Chimó (Venezuela), Nass (Uzbekistan, Kyrgyzstan), Tambook (Sudan, Chad), and Snuff (Nigeria, Ghana, South Africa).
Table 1.
Smokeless tobacco products consumed most commonly across the world
| Smokeless tobacco products | Regions (WHO) | Countries (highest consumption) | Other ingredients | Preparation and use | pHa | Nicotinea (mg/g) | Total TSNAa (ng/g) |
|---|---|---|---|---|---|---|---|
| Snus (Swedish) | Europe (Region A) | Nordic countries (Denmark, Finland, Iceland, Norway, Sweden) | Water, sodium carbonate, sodium chloride, moisturisers, flavouring | A heat treatment process; placed between the gum and upper lip | 6.6–7.2 | 7.8–15.2 | 601–723 |
| Plug, Snuff (US), Snus (US) | Americas (Region A and B) | US, Canada, Mexico | Sweeteners, liquorice | Plug; air cured | 4.7–7.8 | 3.9–40.1 | 313–76,500 |
| Dry or moist snuff; finely ground and fire cured | |||||||
| Snus; steam cured | |||||||
| Snuff; kept between lip and gum, dry snuff can be inhaled too | |||||||
| Chimó | Americas (Region B) | Venezuela, Colombia | Sodium bicarbonate, brown sugar, Mamo’n tree ashes | Tobacco paste made from tobacco leaves; placed between the lip or cheek and gum and left there for some time | 6.9–9.4 | 5.3–30.1 | 9390 |
| Nass (Naswar) | Europe (Region B) and Eastern Mediterranean (Region D) | Uzbekistan, Kyrgyzstan, Tajikistan, Afghanistan, Pakistan, Iran | Lime, ash, flavourings (cardamom), indigo | Sundried and powdered; placed between lip or cheek and gum | 8.4–9.1 | 8.9–14.2 | 478–1380 |
| Tambook | Eastern Mediterranean (Region D) and Africa (Region D) | Sudan, Chad | Mixed with moist sodium bicarbonate | Fermented and grounded; placed and kept in mouth | 7.3–10.1 | 9.6–28.2 | 302,000–992,000 |
| Snuff (North and West African) | Africa (Region D) | Nigeria, Ghana, Algeria, Cameroon, Chad, Senegal | Dried tobacco leaves mixed with potassium nitrate and other salts | Dry snuff; finely ground and inhaled as a pinch | 9.0–9.4 | 2.5–7.4 | 1520–2420 |
| Moist snuff is placed in mouth | |||||||
| Snuff (South African) | Africa (Region E) | South Africa | Dried tobacco leaves mixed with ash | Dry snuff; finely ground and inhaled as a pinch | 6.5–10.1 | 1.2–17.2 | 1710–20,500 |
| Khaini | South East Asia (Regions B and D) Western Pacific (Region B) Eastern Mediterranean (Region D) Europe (Region A) | India, Bangladesh, Nepal, Bhutan | Slaked lime, menthol, flavourings, areca nut | Shredded; kept in mouth between lips and gum | 9.6–9.8 | 2.5–4.8 | 21,600–23,900 |
| Zarda | Bangladesh, India, Pakistan, Myanmar, Thailand, Indonesia, Nepal, Maldives, Sri Lanka, UK | Served wrapped in a betel leaf with lime, catechu, areca nuts | Shredded tobacco leaves are boiled with lime and saffron; the mixture is dried then chewed and spat | 5.2–6.5 | 9.5–30.4 | 5490–53,700 | |
| Gutkha | India, Pakistan, Bangladesh, Nepal, Myanmar, Sri Lanka, UK | Betel nut, catechu, flavourings, sweeteners | Commercially manufactured; sucked, chewed, and spat | 7.4–8.9 | 0.2–4.2 | 83–23,900 |
In addition to nicotine, SLT products contain over 30 carcinogens [5] including tobacco-specific nitrosamines (TSNA), arsenic, beryllium, cadmium, nickel, chromium, nitrite, and nitrate. The level of nicotine and carcinogens vary between products (Table 1) [6]. For example, nicotine content among SLT products varies between 0.2 and 40.1 mg/g, compared to commercial filtered cigarettes which contain 16.3 mg/g of nicotine [7]. Their pH also varies, which, being a key determinant of the level of absorption of nicotine and carcinogens, determines its toxicity: the higher the pH, the higher the absorption and, consequently, the higher the toxicity [6]. Such considerations mean that there are substantial variations between different SLT products in the level of risk posed to human health [4, 8–11]. It is therefore important not to consider SLT as a single product, but rather as groups of products with differences in their toxicity and addictiveness depending upon their carcinogen, nicotine, and pH levels. The diversity in SLT toxicity has been an impediment not only in establishing its global risks to human health, but also in agreeing on international policies for its prevention and control. It is therefore perhaps unsurprising that despite several country-specific studies [12–15] no attempt has hitherto been made to estimate its global disease burden.
To overcome these challenges, we developed a novel approach to estimate the global burden associated with the use of SLT products. The determinants of their toxicity (carcinogens and pH) and addictiveness (nicotine) are dependent on preparation methods, ingredients that are added to SLT products, and consumption behaviours. Given that the SLT preparations and consumption patterns are determined by, and vary with, geography and culture [16], it is possible to group them according to their availability in different parts of the world (Table 1). These groups of SLT products, classified according to different geographical regions, will also be distinguishable from each other on the basis of their toxicity, addictiveness, and associated health risks. Hence, the risks were assumed to be highest in those regions and cultures where products are combined with other ingredients, and are prepared and consumed in a way that makes them very alkaline (i.e. a high pH), and rich in nicotine and TSNA [6, 17]. Building on this assumption, we aimed to estimate the worldwide burden of disease attributable to SLT use, measured in terms of disability adjusted life years (DALYs) lost and number of deaths in 2010.
Methods
We used the comparative risk assessment method, which evaluates changes in population health (burden of disease) that result from modifying a population’s exposure to a risk factor [18, 19]. For this, we used 2010 datasets, which provided the most recent global estimates of burden of disease [20]. The estimates were calculated for individual countries and then grouped into 14 World Health Organization (WHO) sub-regions (Additional file 1: Appendix 1) [21]. These were generated through estimating the following:
The prevalence of SLT consumption
Diseases caused by SLT use
The relative risks of acquiring these diseases
The population attributable fraction (PAF) for each of these diseases
The overall burden of these diseases in terms of DALYs lost and deaths
Proportion of this burden attributable to SLT use
Prevalence of smokeless tobacco use
We carried out a systematic literature search (see Additional file 1: Appendix 2 for a detailed description of the methods employed) for the point prevalence (current use) of SLT consumption among all adult (≥15 years) populations, and also for men and women separately. Only one prevalence report was included for one country. Latest national prevalence data collected as part of an international or regional survey were preferred over an older isolated national or a sub-national survey. We used data from the Global Adult Tobacco Survey (GATS), where available [22]. In its absence, other international (WHO STEPwise approach to Surveillance, The Demographic and Health Surveys), regional (Special Europe Barometer), national, and/or sub-national surveys were used to extract prevalence data.
Diseases caused by smokeless tobacco use
A scoping review was carried out to identify associated diseases. A series of focused literature reviews were subsequently carried out to find and assess the evidence of causation between each of these diseases and SLT use. Our search strategies and selection criteria are provided in Additional file 1: Appendix 3. One researcher ran the searches, which were then independently scrutinised by another independent researcher who considered the search results against the pre-specified inclusion and exclusion criteria. Similarly, one researcher extracted data, which were independently crosschecked by another researcher. In particular, we appraised the studies for case definitions for diseases and for assessment methods for measuring exposure to SLT and for investigating the effects of potential confounders. We excluded those diseases (and respective studies) where evidence was not supportive of a causal relationship. Only studies that adequately controlled for smoking and/or alcohol as potential confounders either at the design or the analysis stage were carried forward into the next stage of the analysis (discussed below). Quality was assessed using the Newcastle-Ottawa Scale for assessing the quality of non-randomised studies in meta-analyses [23].
Assessing risk and meta-analyses
Risk estimates (relative risks/odds ratios) and their confidence intervals (CI) were log transformed to produce effect sizes and standard errors, respectively [24]. We carried out random effects meta-analysis using RevMan version 5 to estimate pooled risk estimates. We first obtained country-specific risk estimates (relative risks/odds ratios) for individual diseases by pooling data from the included studies carried out in respective countries. We then extrapolated non-specific global risk estimates by pooling respective country-specific risk estimates. We were mindful that the risk of acquiring diseases varies between countries owing to differences in SLT products used. Therefore, for each disease where good country-specific risk estimates (pooled estimate from a meta-analysis of three or more studies in respective country) were available, we applied these to respective countries and also to those countries and regions where similar SLT products are used. In the absence of good country-specific risk estimates, we used either one of the following two approaches: (a) In countries and regions that use SLT products with moderate to high pH and TSNAs levels, we applied non-specific global estimates (pooled estimate from a meta-analysis of all studies); and (b) in countries and regions where there was either no information available on the SLT products or the information available indicates low levels of pH and TSNA, we did not apply any estimates. Further details on the application of these assumptions across all 14 WHO regions are provided in web Additional file 1: Appendix 4. We only used those pooled relative risks (country or non-specific) that were found to be statistically significant.
Where associations were presented for more than one SLT product in the same paper, we considered these as separate studies for the purpose of meta-analysis. Similarly, where risks were given separately for former and current SLT users, these were also treated as separate studies. We did not attempt to group risks according to gender because very few studies had such sub-group analysis.
Population attributable fraction
PAF is the proportional reduction in disease or mortality that would occur if exposure were reduced to zero [25, 26]. PAF was estimated for each disease for each country for both males and females, using the following formula:
Overall burden
The overall number of DALYs and deaths for each associated disease for both males and females for each country were extracted from the 2010 Global Burden of Disease study [27, 28].
Attributable burden
The attributable burden (AB), in deaths and DALYs, was estimated for each associated disease for each country for both males and females by multiplying PAF by the overall burden of the disease (B):
Results
Prevalence of smokeless tobacco use
We found adult prevalence figures for SLT consumption in 115 countries (Fig. 1). The definition for ‘adult’ ranged from 15, 16, 25, or 35 years at one end to 49, 64, 65, 70, 74, 84, 85, 89, or no age limit at the other. The PRISMA diagram describing the selection of the prevalence reports is provided in Additional file 1: Appendix 5a.
Fig. 1.
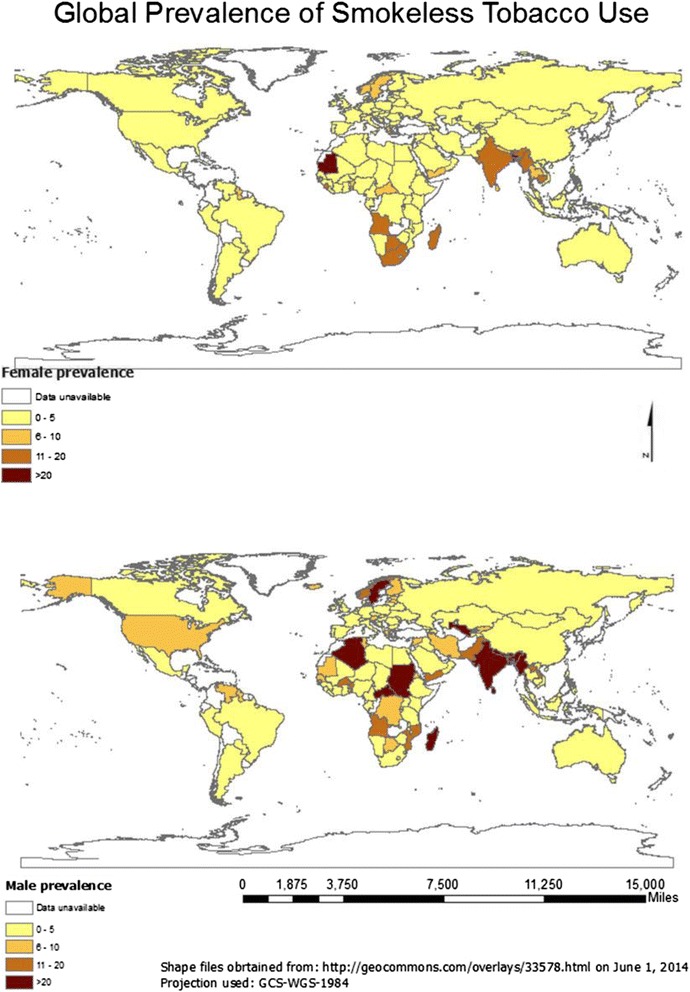
Smokeless tobacco prevalence among males and females
In general, SLT consumption was higher among males than females (Table 2). Mauritania had the highest prevalence of SLT consumption among females (28.3 %), followed by Bangladesh (27.9 %), Madagascar (19.6 %), India (18.4 %), and Bhutan (17.3 %). Among males, Myanmar (51.4 %), Nepal (37.9 %), India (32.9 %), Uzbekistan (31.8 %), and Bangladesh (26.4 %) had the highest consumption rates. Within Europe, SLT (snus) consumption was high in Sweden (24.0 % males, 7.0 % females) and Norway (20.0 % males, 6.0 % females).
Table 2.
Prevalence of smokeless tobacco use in different countries of the world according to WHO sub-regional classification
| WHO sub-regions | Country | M | F | Source | Year |
|---|---|---|---|---|---|
| Africa (Region D) | Algeria | 21 | 0.4 | STEPS [38] | 2005 |
| Benin | 12.7 | 5.7 | STEPS [38] | 2008 | |
| Burkina Faso | – | 3.86 | DHS [39] | 2011 | |
| Cameroon | 1.94 | 0.94 | DHS [39] | 2011 | |
| Cape Verde | 3.5 | 5.8 | STEPS [38] | 2007 | |
| Chad | 1.9 | 0.4 | STEPS [38] | 2008 | |
| Comoros | 7.72 | 2.99 | DHS [39] | 2012 | |
| Gabon | 0.48 | 0.34 | DHS [39] | 2012 | |
| Gambia | 0.8 | 1.4 | STEPS [38] | 2010 | |
| Ghana | 1.33 | 0.2 | DHS [39] | 2008 | |
| Guinea | 1.4 | 1.5 | STEPS [38] | 2009 | |
| Liberia | 2.3 | 2.4 | DHS [40] | 2007 | |
| Madagascar | 24.66 | 19.6 | DHS [39] | 2009 | |
| Mali | 5 | 1.2 | STEPS [38] | 2007 | |
| Mauritania | 5.7 | 28.3 | STEPS [38] | 2006 | |
| Niger | 4.55 | 2.3 | DHS [39] | 2012 | |
| Nigeria | 3.2 | 0.5 | DHS [40] | 2008 | |
| Sao Tome & Principe | 3.8 | 1.9 | STEPS [38] | 2009 | |
| Senegal | 6.63 | 0.23 | DHS [39] | 2011 | |
| Sierra Leone | 3 | 12 | STEPS [38] | 2009 | |
| Togo | 5.1 | 2.2 | STEPS [38] | 2010 | |
| Africa (Region E) | Botswana | 7.2 | 14.5 | STEPS [38] | 2007 |
| Burundi | 0.03 | 0.31 | DHS [39] | 2011 | |
| Congo (Brazzaville) | 8.3 | 1.54 | DHS [39] | 2012 | |
| Congo (Republic) | 8.67 | 3.22 | DHS [39] | 2013 | |
| Cote d'Ivoire | 0.61 | 1.27 | DHS [39] | 2012 | |
| Eritrea | 5.8 | 0.2 | STEPS [38] | 2004 | |
| Ethiopia | 1.94 | 0.2 | DHS [39] | 2011 | |
| Kenya | 2.05 | 1.29 | DHS [39] | 2008 | |
| Lesotho | 1.3 | 9.1 | DHS [40] | 2009 | |
| Malawi | 1.9 | 5 | STEPS [38] | 2009 | |
| Mozambique | 10.94 | 0.82 | DHS [39] | 2011 | |
| Namibia | 1.8 | 2.3 | DHS [40] | 2006–07 | |
| Rwanda | 5.8 | 2.73 | DHS [39] | 2011 | |
| South Africa | 2.4 | 10.9 | DHS [41] | 2003 | |
| Swaziland | 2.6 | 0.8 | STEPS [38] | 2007 | |
| Tanzania | 2.03 | 0.83 | DHS [39] | 2010 | |
| Uganda | 2.94 | 1.5 | DHS [39] | 2011 | |
| Zambia | 0.3 | 1.2 | DHS [39] | 2007 | |
| Zimbabwe | 1.6 | 0.4 | DHS [41] | 2011 | |
| Americas (Region A) | Canada | 2 | – | ICS [41] | 2011 |
| USA | 6.5 | 0.4 | ICS [41] | 2010 | |
| Americas (Region B) | Argentina | 0.1 | 0.2 | GATS [42] | 2012 |
| Barbados | 0 | 0.6 | STEPS [38] | 2007 | |
| Brazil | 0.6 | 0.3 | GATS [42] | 2010 | |
| Dominican Republic | 1.9 | 0.3 | DHS [40] | 2007 | |
| Grenada | 2.2 | 0.3 | STEPS [38] | 2011 | |
| Mexico | 0.3 | 0.3 | GATS [42] | 2009 | |
| Paraguay | 3 | 1.6 | ICS [41] | 2011 | |
| St Kitts & Nevisa | 0.3 | 0.1 | STEPS [38] | 2007 | |
| Trinidad & Tobago | 0.5 | 0.3 | STEPS [38] | 2011 | |
| Venezuela | 6.2 | 0.9 | ICS [41] | 2011 | |
| Americas (Region D) | Haiti | – | 2.5 | DHS [40] | 2005–06 |
| Eastern Mediterranean (Region B) | Libya | 2.2 | 0.1 | STEPS [38] | 2009 |
| Saudi Arabia | 1.3 | 0.5 | STEPS [38] | 2004 | |
| Tunisia | 8.6 | 2.2 | ICS [41] | 2005–06 | |
| Eastern Mediterranean (Region D) | Egypt | 4.8 | 0.3 | GATS [42] | 2009 |
| Iraq | 1.6 | 0.3 | STEPS [38] | 2006 | |
| Pakistan | 16.3 | 2.44 | DHS [43] | 2012–13 | |
| Sudan | 24.1 | 1 | STEPS [38] | 2005 | |
| Yemen | 15.1 | 6.2 | ICS [41] | 2003 | |
| Europe (Region A) | Austria | 7.8 | 1.1 | SEBS [44] | 2012 |
| Belgium | 1.1 | 0.6 | SEBS [44] | 2012 | |
| Cyprus | 2.1 | 0.4 | SEBS [44] | 2012 | |
| Czech Republic | 2.5 | 0.4 | SEBS [44] | 2012 | |
| Denmark | 3 | 1 | ICS [41] | 2010 | |
| Finland | 5.5 | 0.3 | ICS [41] | 2011 | |
| France | 1.2 | 0.6 | SEBS [44] | 2012 | |
| Germany | 3.4 | 3.4 | SEBS [44] | 2012 | |
| Iceland | 5.97 | – | ICS [41] | 2008 | |
| Ireland | 2.2 | 0.9 | SEBS [44] | 2012 | |
| Italy | 1.8 | 1.5 | SEBS [44] | 2012 | |
| Luxembourg | 1.8 | 1 | SEBS [44] | 2012 | |
| Malta | 5.5 | 1.5 | SEBS [44] | 2012 | |
| Netherlands | 0.3 | 0.1 | ICS [41] | 2011 | |
| Norway | 20 | 6 | ICS [41] | 2011 | |
| Portugal | 4.4 | 1.1 | SEBS [44] | 2012 | |
| Slovenia | 1.8 | 0.4 | SEBS [44] | 2012 | |
| Spain | 0.4 | 0.2 | SEBS [44] | 2012 | |
| Sweden | 24 | 7 | ICS [41] | 2011 | |
| Switzerland | 4 | 1.3 | ICS [41] | 2011 | |
| United Kingdom | 1.6 | 0.5 | SEBS [44] | 2012 | |
| Europe (Region B) | Ajerbaijan | 0.3 | 0 | DHS [40] | 2006 |
| Armenia | 1.8 | 0 | DHS [40] | 2005 | |
| Bulgaria | 0.3 | 0 | SEBS [44] | 2012 | |
| Georgia | 1 | 0.2 | ICS [41] | 2010 | |
| Kyrgyzstan | 7 | 0.3 | ICS [41] | 2006 | |
| Poland | 1 | 0.1 | GATS [42] | 2009 | |
| Romania | 0.4 | 0.2 | GATS [42] | 2011 | |
| Slovakia | 3.9 | 0.7 | SEBS [44] | 2012 | |
| Uzbekistan | 31.8 | 0.2 | DHS [40] | 2002 | |
| Europe (Region C) | Latvia | 5.8 | 0.9 | ICS [41] | 2010 |
| Lithuania | 1.2 | 0.2 | SEBS [44] | 2012 | |
| Moldova | 0.1 | 0 | DHS [40] | 2005 | |
| Russia | 1 | 0.2 | GATS [42] | 2009 | |
| Ukraine | 0.5 | 0 | GATS [42] | 2010 | |
| South East Asia (Region B) | Indonesia | 1.5 | 2 | GATS [42] | 2011 |
| Sri Lanka | 24.9 | 6.9 | STEPS [38] | 2006 | |
| Thailand | 1.1 | 5.2 | GATS [42] | 2011 | |
| South East Asia (Region D) | Bangladesh | 26.4 | 27.9 | GATS [42] | 2009 |
| Bhutan | 21.1 | 17.3 | STEPS [38] | 2007 | |
| India | 32.9 | 18.4 | GATS [42] | 2009 | |
| Maldives | 5.6 | 2.6 | STEPS [38] | 2011 | |
| Myanmar | 51.4 | 16.1 | STEPS [38] | 2009 | |
| Nepal | 37.9 | 6 | DHS [41] | 2011 | |
| Timor Leste | 2.48 | 1.93 | DHS [43] | 2009–10 | |
| Western Pacific (Region A) | Australia | 0.75 | 0.41 | ICS [45] | 2004 |
| Western Pacific (Region B) | Cambodia | 2.2 | 14.8 | STEPS [38] | 2010 |
| China | 0.7 | 0 | GATS [42] | 2010 | |
| Lao People’s Democratic Republic | 14.6 | 1.1 | STEPS [38] | 2008 | |
| Malaysia | 0.9 | 0.6 | GATS [42] | 2011 | |
| Micronesia | 22.4 | 3 | STEPS [38] | 2002 | |
| Mongolia | 2.8 | 0.5 | STEPS [38] | 2009 | |
| Philippines | 2.8 | 1.2 | GATS [42] | 2009 | |
| Vietnam | 0.3 | 2.3 | GATS [42] | 2010 |
DHS The Demographic and Health Surveys, ICS Individual Country Survey, GATS Global Adult Tobacco Survey, SEBS The Special Europe Barometer Survey, STEPS STEPwise approach to Surveillance
aPopulations of St Kitts and Nevis are tiny and unlikely to affect our estimates
Diseases caused by smokeless tobacco use
The initial scoping review identified a number of associated diseases, including a range of cancers, cardiovascular diseases (ischaemic heart disease and stroke), periodontal conditions, and adverse pregnancy outcomes. The subsequent more focused systematic reviews identified 53 studies (Table 3) reporting association between SLT consumption and cancers of mouth, pharynx, larynx, oesophagus, lung, and pancreas (39 studies); and cardiovascular diseases, such as ischaemic heart disease and stroke (14 studies). PRISMA flow diagrams describing the selection process of the studies identified in the literature searches are provided in Additional file 1: Appendix 5b,c. The pooled non-specific relative risks were statistically significant for cancers of the mouth, pharynx, and oesophagus (Figs. 2, 3, 4, and 5). Only statistically significant relative risks (country-specific or non-specific) were included in the model to estimate attributable risks. For example, the pooled non-specific relative risk for laryngeal cancer was 1.42 (95 % CI 0.77–2.59), and hence excluded (Additional file 1: Appendix 6). Likewise, none of the country-specific estimates for the USA were statistically significant (Additional file 1: Appendix 4). Based on the above reviews, we assumed that a causal association exists between some SLT products and cancers of the mouth, pharynx, and oesophagus, and ischaemic heart disease.
Table 3.
Smokeless tobacco use and risk of cancers, ischaemic heart disease, and stroke—studies included in meta-analysis
| Country | Study period | Study design | Exposure status | Inclusion of cigarette/alcohol users | Outcome | Odds ratios/relative risks (95 % confidence intervals) | Comments | Quality assessment (NOS)a | Reference |
|---|---|---|---|---|---|---|---|---|---|
| CANCERS | |||||||||
| India | 2001–2004 | Case–control | Smokeless tobacco with or without additives | No/No | Oral cancer | 0.49 (0.32–0.75) | Exclusive SLT users | Selection**** | Anantharaman et al. 2007 [46] |
| Comparability** | |||||||||
| Exposure/Outcome* | |||||||||
| India | 1996–1999 | Case–control | Ever SLT users | Yes/Yes | Oral cancer | 7.31 (3.79–14.1) | Never drinkers adjusted for smoking | Selection**** | Balaram et al. 2002 [47] |
| 9.19 (4.38–19.28) | Never smokers adjusted for alcohol | Comparability** | |||||||
| Exposure/Outcome * | |||||||||
| India | 1982–1992 | Case–control | Tobacco quid chewing | Yes/No | Oral cancer | 5.8 (3.6–9.34) | Adjusted for smoking | Selection*** | Dikshit & Kanhere 2000 [48] |
| Pharyngeal cancer | 1.2 (0.8–1.8) | Comparability* | |||||||
| Lung cancer | 0.7 (0.4–1.22) | Exposure/Outcome* | |||||||
| India | Unclear | Case–control | Chewing tobacco | No/No | Oral cancer | 10.75 (6.58–17.56) | Exclusive SLT users | Selection** | Goud et al. 1990 [49] |
| Comparability* | |||||||||
| Exposure/Outcome0 | |||||||||
| India | 1990–1997 | Cohort | Current SLT users | No/No | Oral cancer | 5.5 (3.3–9.17) | Exclusive SLT users | Selection**** | Jayalekshmi et al. 2009 [50] |
| Former SLT users | 9.2 (4.6–18.40) | Comparability* | |||||||
| Exposure/Outcome** | |||||||||
| India | 1990–1997 | Cohort | Current SLT user | Yes/Yes | Oral cancer | 2.4 (1.7–3.39) | Adjusted for smoking and alcohol | Selection**** | Jayalekshmi et al. 2010 [51] |
| Former SLT users | 2.1 (1.3–3.39) | Comparability* | |||||||
| Exposure/Outcome*** | |||||||||
| India | May 2005 | Case–control | Ever SLT users | No/No | Oral cancer | 4.23 (3.11–5.75) | Exclusive SLT users | Selection*** | Jayant et al. 1977 [52] |
| Pharyngeal cancer | 2.42 (1.74–3.37) | Comparability** | |||||||
| Laryngeal cancer | 2.8 (2.07–3.79) | Exposure/Outcome0 | |||||||
| Oesophageal cancer | 1.55 (1.15–2.07) | ||||||||
| India | 1968 | Case–control | Tobacco | Yes/No | Oral cancer | 4.63 (3.50–6.14) | Exclusive chewers and non-chewers data available | Selection*** | Jussawalla & Deshpande 1971 [53] |
| Pharyngeal cancer | 3.09 (2.31–4.13) | Comparability** | |||||||
| Laryngeal cancer | 2.29 (1.72–3.05) | Exposure/Outcome0 | |||||||
| Oesophageal cancer | 3.82 (2.84–5.13) | ||||||||
| India | 2005–2006 | Case–control | Tobacco flakes | Yes/Yes | Oral cancer | 7.6 (4.9–11.79) | Adjusted for smoking and alcohol | Selection**** | Madani et al. 2010 [54] |
| Gutkha | 12.7 (7–23.04) | Comparability** | |||||||
| Mishiri | 3.0 (1.9–4.74) | Exposure/Outcome* | |||||||
| India | Unclear | Case–control | Chewing tobacco | Yes/Yes | Oral cancer | 5.0 (3.6–6.94) | Adjusted for smoking and alcohol | Selection**** | Muwonge et al. 2008 [55] |
| Comparability* | |||||||||
| Exposure/Outcome* | |||||||||
| India | 1982–1984 | Case–control | Chewing tobacco | Yes/No | Oral cancer | 10.2 (2.6–40.02) | Adjusted for smoking | Selection*** | Nandakumar et al. 1990 [56] |
| Comparability** | |||||||||
| Exposure/Outcome* | |||||||||
| India | 1980–1984 | Case–control | SLT users | No/No | Oral cancer | 1.99 (1.41–2.81) | Exclusive SLT users | Selection** | Rao et al. 1994 [57] |
| Comparability0 | |||||||||
| Exposure/Outcome* | |||||||||
| India | 1952–1954 | Case–control | Chewing tobacco | No/No | Oral cancer | 4.85 (2.32–10.14) | Exclusive SLT users | Selection*** | Sanghvi et al. 1955 [58] |
| Pharyngeal cancer | 2.02 (0.94–4.33) | Comparability** | |||||||
| Laryngeal cancer | 0.76 (0.37–1.56) | Exposure/Outcome0 | |||||||
| India | 1983–1984 | Case–control | Snuff (males only) | Yes/Yes | Oral cancer | 2.93 (0.98–8.76) | Adjusted for smoking and alcohol; adjusted effect size is only among males | Selection*** | Sankaranarayan et al. 1990 [59] |
| Comparability0 | |||||||||
| Exposure/Outcome* | |||||||||
| India | Not given | Case–control | Tobacco chewing | Yes/Yes | Oropharyngeal cancer | 7.98 (4.11–13.58)b | Adjusted for smoking and alcohol | Selection*** | Wasnik et al. 1998 [60] |
| Comparability** | |||||||||
| Exposure/Outcome0 | |||||||||
| India | 1991–2003 | Case–control | Chewing tobacco | No/No | Oral cancer | 5.88 (3.66–7.93) | Exclusive SLT users | Selection**** | Subapriya e al. 2007 [61] |
| Comparability** | |||||||||
| Exposure/Outcome** | |||||||||
| India | 1950–1962 | Case–control | Tobacco with or without paan or lime | Yes/No | Oral and oropharyngeal cancer | 41.90 (34.20–51.33) | Exclusive chewer data available | Selection** | Wahi et al. 1965 [62] |
| Note: data of habit was not available for the whole cohort | Comparability** | ||||||||
| Exposure/Outcome0 | |||||||||
| Pakistan | 1996–1998 | Case–control | Naswar | Yes/Yes | Oral cancer | 9.53 (1.73–52.50) | Adjusted for smoking and alcohol | Selection*** | Merchant et al. 2000 [63] |
| Paan with tobacco | 8.42 (2.31–30.69) | Comparability** | |||||||
| Exposure/Outcome* | |||||||||
| Sweden | 1973–2002 | Cohort | Snus | Yes/Yes | Oral and pharyngeal combined | 3.10 (1.50–6.41) | Adjusted for smoking and alcohol | Selection** | Roosar et al. 2008 [64] |
| Comparability** | |||||||||
| Outcome*** | |||||||||
| India | 1993–1999 | Case–control | Chewing tobacco | Yes/Yes | Oral cancer | 5.05 (4.26–5.99) | Adjusted for smoking and alcohol | Selection*** | Znaor et al. 2003 [65] |
| Pharynx | 1.83 (1.43–2.34) | Comparability** | |||||||
| Oesophagus | 2.06 (1.62–2.62) | Exposure/Outcome* | |||||||
| Norway | 1966–2001 | Cohort | Chewing tobacco plus oral snuff | No/No | Oral cancer | 1.1 (0.5–2.42) | Adjusted for smoking, might be confounded by alcohol use | Selection*** | Bofetta et al. 2005 [66] |
| Oesophageal cancer | 1.4 (0.61–3.21) | Comparability* | |||||||
| Pancreatic cancer | 1.67 (1.12–2.49) | Exposure/Outcome*** | |||||||
| Lung cancer | 0.80 (0.61–1.05) | ||||||||
| Sweden | 1988–1991 | Case–control | Oral snuff | Yes/Yes | Oral cancer | 1.4 (0.8–2.45) | Adjusted for smoking and alcohol | Selection** | Lewin et al. 1998 [67] |
| Larynx | 0.9 (0.5–1.62) | Comparability** | |||||||
| Oesophagus | 1.2 (0.7–2.06) | Exposure/Outcome* | |||||||
| Pharynx | 0.7 (0.4–1.22) | ||||||||
| Sweden | 1969–1992 | Cohort | Snus | No/No | Oral cancer | 0.8 (0.4–1.60) | Exclusive SLT users | Selection*** | Luo et al. 2007 [68] |
| Lung cancer | 0.8 (0.5–1.28) | Comparability* | |||||||
| Pancreatic cancer | 2 (1.20–3.33) | Exposure/Outcome*** | |||||||
| Sweden | 2000–2004 | Case–control | Oral snuff | Yes/Yes | Oral | 0.70 (0.3–1.63) | Adjusted for smoking and alcohol | Selection*** | Rosenquist et al 2005 [69] |
| Comparability** | |||||||||
| Exposure/Outcome** | |||||||||
| Sweden | 1980–1989 | Case–control | Oral snuff | Yes/Yes | Oral cancer | 0.8 (0.5–1.28) | Adjusted for smoking and alcohol | Selection** | Schildt et al. 1998 [70] |
| Comparability** | |||||||||
| Exposure/Outcome*** | |||||||||
| USA | 1972–1983 | Case–control | Oral snuff | Yes/Yes | Oral cancer | 0.8 (0.4–1.60) | Not clear if adjusted for smoking and alcohol | Selection** | Mashberg et al. 1993 [71] |
| Chewing tobacco | 1 (0.7–1.43) | Comparability0 | |||||||
| Exposure/Outcome* | |||||||||
| USA | Not given | Case–control | SLT use | Yes/Yes | Oral cancer | 0.90 (0.38–2.13) | Adjusted for smoking and alcohol | Selection*** | Zhou et al. 2013 [15] |
| Pharyngeal cancer | 1.59 (0.84–3.01) | Comparability** | |||||||
| Laryngeal cancer | 0.67 (0.19–2.36) | Exposure/Outcome* | |||||||
| India | 2001–2004 | Case–control | Chewing tobacco | No/No | Pharyngeal cancer | 3.18 (1.92–5.27) | Exclusive SLT users | Selection*** | Sapkota et al. 2007 [72] |
| Laryngeal cancer | 0.95 (0.52–1.74) | Comparability** | |||||||
| Exposure/Outcome* | |||||||||
| Pakistan | 1998–2002 | Case–control | Snuff dipping | No/No | Oesophageal cancer | 4.1 (1.3–12.93) | Adjusted for areca nut | Selection*** | Akhtar et al. 2012 [73] |
| Quid with tobacco | 14.2 (6.4–31.50) | Comparability** | |||||||
| Exposure/Outcome** | |||||||||
| India | 2008–2012 | Case–control | Nass chewing | No/No | Oesophageal cancer | 2.88 (2.06–4.03) | Exclusive SLT users | Selection*** | Dar et al. 2012 [74] |
| Gutkha chewing | 2.87 (0.87–9.47) | Comparability** | |||||||
| Exposure/Outcome** | |||||||||
| India | 2007–2011 | Case–control | Oral snuff | Yes/Yes | Oesophageal cancer | 3.86 (2.46–6.06) | Adjusted for smoking and alcohol | Selection** | Sehgal et al. 2012 [75] |
| Comparability** | |||||||||
| Exposure/Outcome* | |||||||||
| India | 2011–2012 | Case–control | Chewing tobacco | Yes/Yes | Oesophageal cancer | 2.63 (1.53–4.52) | Adjusted for smoking and alcohol | Selection*** | Talukdar et al. 2013 [76] |
| Comparability** | |||||||||
| Exposure/Outcome* | |||||||||
| Sweden | 1995–1997 | Case–control | Oral snuff | Yes/Yes | Oesophageal cancer (adenocarcinoma) | 1.2 (0.7–2.06) | Adjusted for smoking and alcohol | Selection*** | Lagergren et al. 2000 [77] |
| (Squamous cell carcinoma) | 1.4 (0.9–2.18) | Comparability** | |||||||
| Exposure/Outcome* | |||||||||
| Sweden | 1969–1993 | Cohort | Oral snuff | Yes/No | Oesophageal cancer (Adenocarcinoma) | 1.3 (0.8–2.11) | Adjusted for smoking | Selection** | Zendehdel et al. 2008 [78] |
| (Squamous cell carcinoma) | 1.2 (0.8–1.80) | Comparability* | |||||||
| Exposure/Outcome** | |||||||||
| Sweden | 1974–1985 | Cohort | SLT users | No/NA | Lung cancer | 0.90 (0.20– 4.05) | Adjusted for age, region of origin | Selection*** | Bolinder et al. 1994 [79] |
| Comparability* | |||||||||
| Outcome** | |||||||||
| Morocco | 1996–1998 | Case–control | SLT users | Yes/No | Lung cancer | 1.05 (0.28–3.94) | Adjusted for smoking | Selection** | Sasco et al. 2002 [80] |
| Comparability** | |||||||||
| Exposure/Outcome** | |||||||||
| USA | 1977–1984 | Case–control | SLT users | Yes/No | Oesophageal cancer | 1.2 (0.1–14.40) | Adjusted for smoking | Selection*** | Brown et al. 1988 [81] |
| Comparability** | |||||||||
| Exposure/Outcome** | |||||||||
| USA | 1986–1989 | Case–control | SLT users | Yes/No | Pancreatic cancer | 1.4 (0.5–3.92) | Adjusted for smoking | Selection*** | Alguacil & Silverman 2004 [82] |
| Comparability* | |||||||||
| Exposure/Outcome** | |||||||||
| USA | 2000–2006 | Case–control | Chewing tobacco | Yes/Yes | Pancreatic cancer | 0.6 (0.3–1.20) | Adjusted for smoking and alcohol | Selection**** | Hassan et al. 2007 [83] |
| Oral snuff | 0.5 (0.1–2.5) | Comparability** | |||||||
| Exposure/Outcome* | |||||||||
| CARDIOVASCULAR DISEASES (ischaemic heart disease and stroke) | |||||||||
| 52 countries | 1999–2003 | Case–control | Chewing tobacco | No/Yes | Myocardial infarction | 1.57 (1.24–1.99) | Adjusted for diabetes, abdominal obesity, hypertension, exercise, diet | Selection**** | Teo et al. 2006 [29] |
| Comparability** | |||||||||
| Exposure/Outcome* | |||||||||
| Pakistan | 2005–2011 | Case–control | Dippers only (Naswar) | No/NA | Myocardial infarction | 1.46 (1.20–1.77) | Adjusted for age, sex, region, ethnicity | Selection**** | Alexander 2013 [84] |
| Chewers only (Paan/ Supari/ Gutkha) | 1.71 (1.46–2.00) | Comparability** | |||||||
| Exposure/Outcome** | |||||||||
| Bangladesh | 2006–2007 | Case–control | Ever SLT users | No/NA | Myocardial infarction, Angina pectoris | 2.8 (1.1–7.13) | Adjusted for age, sex, hypertension | Selection*** | Rahman & Zaman 2008 [85] |
| Comparability** | |||||||||
| Exposure/Outcome* | |||||||||
| Bangladesh | 2010 | Case–control | Ever SLT users | No/NA | Myocardial infarction, Angina pectoris | 0.77 (0.52–1.14) | Adjusted for age, hypertension, diabetes, acute psycho-social stress | Selection**** | Rahman et al. 2012 [86] |
| Comparability** | |||||||||
| Exposure/Outcome* | |||||||||
| Sweden | 1998–2005 | Case–control | Current SLT users | No/NA | Myocardial infarction | 0.73 (0.35–1.52) | Exclusive SLT users | Selection*** | Hergens et al. 2005 [87] |
| Former SLT users | 1.2 (0.46–3.13) | Comparability** | |||||||
| Exposure/Outcome** | |||||||||
| Sweden | 1978–2004 | Cohort | Ever SLT users | No/NA | Myocardial infarction | 0.99 (0.90–1.10) | Adjusted for age, BMI, region of residence | Selection** | Hergens et al. 2007 [88] |
| Comparability** | |||||||||
| Exposure/Outcome*** | |||||||||
| Sweden | 1989–1991 | Case–control | Regular SLT users | Yes/NA | Myocardial infarction | 1.01 (0.66–1.55)c | Adjusted for age, education, smoking | Selection*** | Huhtasaari et al. 1992 [89] |
| Comparability** | |||||||||
| Exposure/Outcome* | |||||||||
| Sweden | 1991–1993 | Case–control | Former SLT users | No/NA | Myocardial infarction | 1.23 (0.54–2.82) | Exclusive SLT users | Selection**** | Huhtasaari et al. 1999 [90] |
| Comparability** | |||||||||
| Exposure/Outcome** | |||||||||
| Sweden | 1988–2000 | Cohort | Daily SLT users | No/NA | Ischaemic heart disease | 1.41 (0.61–3.28) | Adjusted for BMI, physical activity, diabetes, hypertension | Selection**** | Johansson et al. 2005 [91] |
| Comparability** | |||||||||
| Exposure/Outcome** | |||||||||
| Sweden | 1985–1999 | Case–control | Current SLT users | No/NA | Myocardial infarction | 0.82 (0.46–1.46) | Adjusted for BMI, physical activity, education, cholesterol | Selection**** | Wennberg et al. 2007 [92] |
| Former SLT users | 0.66 (0.32–1.36) | Comparability** | |||||||
| Exposure/Outcome** | |||||||||
| Sweden | 1985–2000 | Case–control | Regular SLT users | No/NA | Stroke | 0.87 (0.41–1.83) | Adjusted for diabetes, hypertension, education, marital status, cholesterol | Selection**** | Asplund et al. 2003 [93] |
| Comparability** | |||||||||
| Exposure/Outcome** | |||||||||
| Sweden | 1978–2003 | Cohort | Ever SLT users | No/NA | Stroke | 1.02 (0.92–1.13) | Adjusted for age, BMI, region of residence | Selection** | Hergens et al. 2008 [94] |
| Comparability** | |||||||||
| Exposure/Outcome*** | |||||||||
| Sweden | 1998–2005 | Cohort | Current SLT users | No/NA | Ischaemic heart disease | 0.85 (0.51–1.42) | Adjusted for age, hypertension, diabetes, cholesterol | Selection*** | Hansson et al. 2009 [95] |
| Former SLT users | Stroke | 1.07 (0.56–2.04) | Comparability** | ||||||
| 1.18 (0.67–2.08) | Exposure/Outcome** | ||||||||
| 1.35 (0.65–2.82) | |||||||||
| Sweden | 1991–2004 | Cohort | SLT users | No/NA | Myocardial infarction | 0.75 (0.3–1.87) | Adjusted for age, diabetes, occupation, hypertension, physical activity, BMI, marital status | Selection*** | Janzon et al. 2009 [96] |
| Stroke | 0.59 (0.2–1.5) | Comparability** | |||||||
| Exposure/Outcome** | |||||||||
BMI body mass index, NA not applicable, NOS Newcastle-Ottawa Scale, SLT smokeless tobacco
aNOS for assessing the quality of non-randomised studies in meta-analyses based on selection, comparability, and exposure/outcome. Number of stars (*) indicates the number of criteria met for each of these three categories [23]
bEffect sizes are for oral and pharyngeal cancers combined and were included in the meta-analysis for oral cancer only
cBased on parameter estimate and standard error reported in paper
Fig. 2.
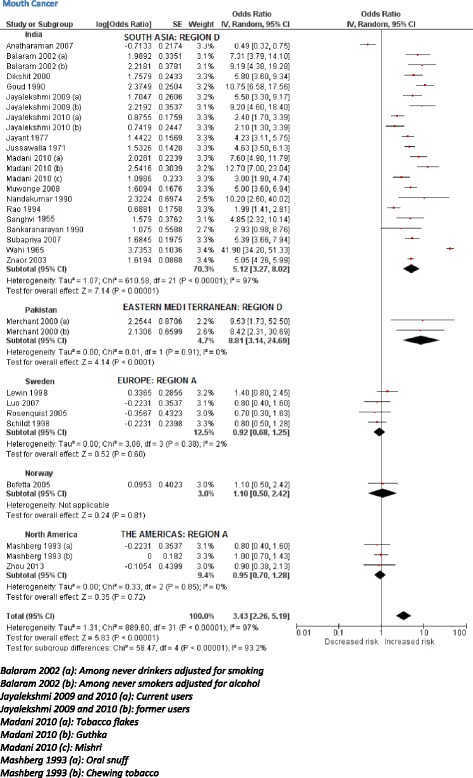
Random effects model showing relative risk for mouth cancer for smokeless tobacco use
Fig. 3.
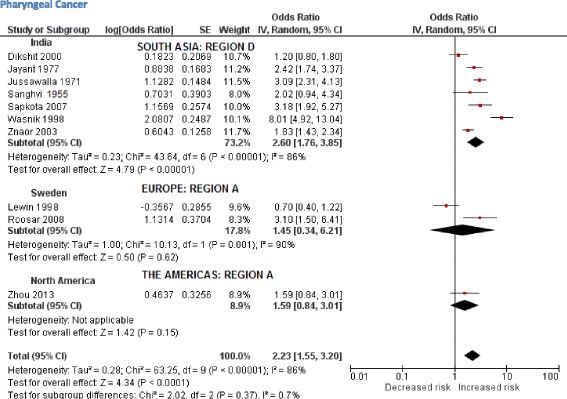
Random effects model showing relative risk for pharyngeal cancer for smokeless tobacco use
Fig. 4.
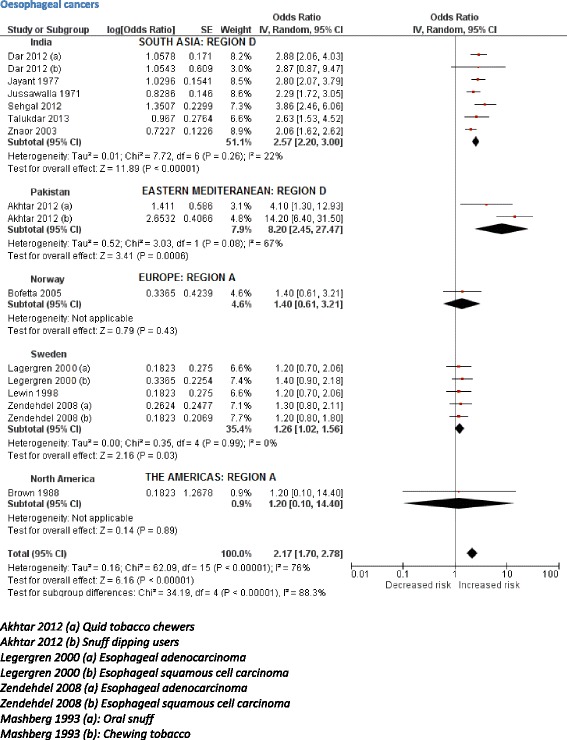
Random effects model showing relative risk for oesophageal cancer for smokeless tobacco use
Fig. 5.
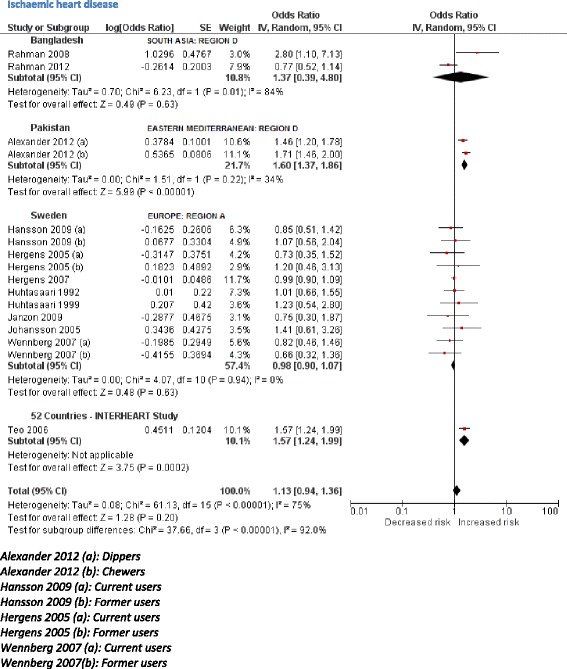
Random effects model showing relative risk for ischaemic heart disease for smokeless tobacco use
Relative risks
Based on 32 studies, the estimated pooled non-specific relative risk for mouth (oral cavity, tongue, and lip) cancers was 3.43 (95 % CI 2.26–5.19) (Fig. 2). Studies from South-East Asia indicated an increased risk of oral cancer for SLT use whereas results from studies pertaining to Europe and the Americas did not substantiate such an association. For cancers of the pharynx, pooled non-specific relative risk was 2.23 (95 % CI 1.55–3.20), based on ten studies (Fig. 3). For oesophageal cancers, no clear increased risk was present in studies in the USA, whereas a pooled estimate reported a relative risk of 2.17 (95 % CI 1.70–2.78) (Fig. 4). For ischaemic heart disease, no good country-specific risk estimates were available (Fig. 5). However, we found one large case–control study (INTERHEART study) [29] conducted in 52 countries from all regions showing a statistically significant risk of ischaemic heart disease (adjusted odds ratio 1.57, 95 % CI 1.24–1.99) among SLT users.
Applying risk estimates
For cancers in general, pooled country-specific risk estimates obtained from Sweden and the USA were applied to Europe A and Americas A, respectively. For South-East Asia B and D and Western Pacific B regions, country-specific estimates from India were applied. There were a few exceptions to this rule, because some countries (UK, Mexico, Pakistan, China, Mongolia) differed in their SLT consumption patterns from their respective regions (see Additional file 1: Appendix 4 for details). In short, country-specific risk estimates for cancers could only be fully applied to five regions. For the remaining nine regions, our findings were imputed either by applying statistically significant non-specific risk estimates or none at all (Additional file 1: Appendix 4). In case of ischaemic heart disease, Sweden was the only country with a pooled country-specific relative risk (0.98, 95 % CI 0.90–1.07) obtained from a good number (more than three) of studies. For 11 out of 14 regions, we used a large multi-country study (INTERHEART)—conducted in 52 countries—to apply and deduce risk estimates. The three regions (Europe A and C and Americas D) were excluded, as these were not among those regions included in the INTERHEART study (Additional file 1: Appendix 4). There was one exception (UK) where INTERHEART study estimates were applied because SLT products consumed in the UK commonly originate from South Asia.
Attributable burden
The attributable burden of SLT use is outlined in Table 4. Our estimates indicate that in 2010, SLT use led to 1,711,539 DALYs lost and 62,283 deaths due to cancers of mouth, pharynx, and oesophagus, and, based on data from the benchmark 52 country INTERHEART study, 4,725,381 DALYs lost and 204,309 deaths from ischaemic heart disease. In total, SLT use caused the loss of 6,436,920 DALYs and 266,592 deaths. The figures show that three-quarters of these deaths and loss of DALYs were among males. This disease burden was found to be distributed across all WHO sub-regions. However, nearly 85 % of the total burden attributable to SLT use was in South-East Asia, with India alone accounting for 74 % of the global burden, followed by Bangladesh (5 %).
Table 4.
Number of DALYs lost and deaths from SLT use in 2010, by WHO sub-region as defined in Additional file 1: Appendix 1
| WHO sub-regionsa | Mouth cancer | Pharyngeal cancer | Oesophageal cancer | Ischaemic heart disease | All causes | ||||||||||
|---|---|---|---|---|---|---|---|---|---|---|---|---|---|---|---|
| M | F | All | M | F | All | M | F | All | M | F | All | M | F | All | |
| DEATHS | |||||||||||||||
| Africa D | 86 | 36 | 123 | 15 | 2 | 17 | 157 | 77 | 233 | 2323 | 751 | 3074 | 2581 | 866 | 3448 |
| Africa E | 155 | 85 | 240 | 19 | 12 | 31 | 389 | 252 | 641 | 1202 | 923 | 2125 | 1765 | 1272 | 3037 |
| Americas A | 0 | 0 | 0 | 0 | 0 | 0 | 0 | 0 | 0 | 10,240 | 649 | 10,889 | 10,240 | 649 | 10,889 |
| Americas B | 90 | 11 | 102 | 28 | 3 | 31 | 74 | 9 | 83 | 1030 | 291 | 1321 | 1222 | 314 | 1536 |
| Americas D | 0 | 0 | 0 | 0 | 0 | 0 | 0 | 0 | 0 | 0 | 0 | 0 | 0 | 0 | 0 |
| Eastern Mediterranean B | 11 | 1 | 12 | 1 | 0 | 2 | 4 | 1 | 5 | 441 | 74 | 515 | 457 | 76 | 534 |
| Eastern Mediterranean D | 933 | 254 | 1187 | 604 | 59 | 663 | 1012 | 129 | 1141 | 7401 | 926 | 8327 | 9950 | 1368 | 11,318 |
| Europe A | 66 | 13 | 78 | 16 | 2 | 18 | 244 | 38 | 282 | 539 | 145 | 684 | 865 | 197 | 1062 |
| Europe B | 146 | 3 | 148 | 57 | 1 | 58 | 260 | 2 | 262 | 5506 | 156 | 5662 | 5969 | 162 | 6130 |
| Europe C | 0 | 0 | 0 | 0 | 0 | 0 | 0 | 0 | 0 | 0 | 0 | 0 | 0 | 0 | 0 |
| South-East Asia B | 438 | 396 | 835 | 129 | 58 | 187 | 243 | 139 | 382 | 3205 | 1852 | 5057 | 4016 | 2445 | 6461 |
| South-East Asia D | 11,527 | 6459 | 17,987 | 12,715 | 3485 | 16,200 | 15,247 | 5625 | 20,873 | 117,523 | 45,047 | 162,570 | 157,013 | 60,617 | 217,630 |
| Western Pacific A | 0 | 0 | 0 | 0 | 0 | 0 | 0 | 0 | 0 | 69 | 36 | 104 | 69 | 36 | 104 |
| Western Pacific B | 134 | 159 | 293 | 22 | 34 | 56 | 51 | 63 | 114 | 3167 | 814 | 3981 | 3374 | 1070 | 4443 |
| Worldwide | 13,586 | 7418 | 21,003 | 13,608 | 3656 | 17,264 | 17,680 | 6336 | 24,016 | 152,647 | 51,662 | 204,309 | 197,520 | 69,072 | 266,592 |
| DALYs | |||||||||||||||
| Africa D | 2516 | 1046 | 3562 | 452 | 65 | 517 | 4119 | 1906 | 6024 | 64,043 | 19,116 | 83,159 | 71,130 | 22,132 | 93,262 |
| Africa E | 4926 | 2293 | 7220 | 573 | 349 | 922 | 10,159 | 6290 | 16,449 | 33,502 | 21,109 | 54,610 | 49,159 | 30,042 | 79,201 |
| Americas A | 0 | 0 | 0 | 0 | 0 | 0 | 0 | 0 | 0 | 172,206 | 7213 | 179,419 | 172,206 | 7213 | 179,419 |
| Americas B | 2311 | 230 | 2541 | 734 | 63 | 797 | 1717 | 176 | 1893 | 22,252 | 4728 | 26,980 | 27,014 | 5197 | 32,210 |
| Americas D | 0 | 0 | 0 | 0 | 0 | 0 | 0 | 0 | 0 | 0 | 0 | 0 | 0 | 0 | 0 |
| Eastern Mediterranean B | 285 | 36 | 321 | 33 | 9 | 43 | 86 | 20 | 106 | 9841 | 1383 | 11,224 | 10,246 | 1448 | 11,694 |
| Eastern Mediterranean D | 29,240 | 7669 | 36,909 | 16,446 | 1800 | 18,247 | 27,777 | 3613 | 31,390 | 187,394 | 21,544 | 208,938 | 260,857 | 34,627 | 295,483 |
| Europe A | 1514 | 224 | 1738 | 369 | 45 | 414 | 4949 | 545 | 5494 | 8397 | 1491 | 9888 | 15,230 | 2304 | 17,534 |
| Europe B | 4439 | 60 | 4499 | 1704 | 20 | 1724 | 6460 | 56 | 6517 | 115,640 | 1991 | 117,631 | 128,243 | 2128 | 130,371 |
| Europe C | 0 | 0 | 0 | 0 | 0 | 0 | 0 | 0 | 0 | 0 | 0 | 0 | 0 | 0 | 0 |
| South-East Asia B | 10,968 | 7741 | 18,709 | 3217 | 1487 | 4704 | 5608 | 2983 | 8591 | 66,969 | 29,913 | 96,881 | 86,762 | 42,124 | 128,886 |
| South-East Asia D | 351,752 | 179,051 | 530,803 | 338,976 | 107,041 | 446,017 | 400,770 | 143,146 | 543,916 | 290,6993 | 938,528 | 3,845,521 | 3,998,491 | 1,367,766 | 5,366,257 |
| Western Pacific A | 0 | 0 | 0 | 0 | 0 | 0 | 0 | 0 | 0 | 1024 | 340 | 1364 | 1024 | 340 | 1364 |
| Western Pacific B | 3700 | 3567 | 7267 | 615 | 794 | 1409 | 1313 | 1485 | 2797 | 72,936 | 16,830 | 89,766 | 78,564 | 22,675 | 101,239 |
| Worldwide | 411,652 | 201,918 | 613,569 | 363,120 | 111,673 | 474,793 | 462,957 | 160,219 | 623,177 | 3,661,195 | 1,064,186 | 4,725,381 | 4,898,924 | 1,537,996 | 6,436,920 |
Discussion
We have found that SLT is consumed worldwide and that its use results in substantial, potentially avoidable, morbidity and mortality. However, owing to marked differences in the types of products available, patterns of consumption, and associated risks, there are substantial differences in the attributable burden between regions and countries. In particular, SLT consumption in South-East Asia leads to a much greater burden of disease than in Sweden, despite its use being equally prevalent. This is due to the much lower levels of TSNA and pH in SLT products in Sweden compared to those found in SLT in South-East Asia [6]. Similarly, SLT products used in the USA have lower risk estimates than for those used in South-East Asia.
We found that more than six million DALYs were lost and over a quarter of a million deaths occurred in 2010 owing to SLT consumption. However, our estimates require cautious interpretation because of a number of potential limitations.
First, our analysis was limited to those countries and diseases for which reliable prevalence and risk data were available, respectively. Most global tobacco surveys that reported on SLT consumption did not include all countries in the world. While global figures on smoking prevalence were available, we did not find any SLT prevalence figures for almost half of all countries. Where SLT prevalence figures were available, two countries (Micronesia and Saint Kitts & Nevis) were excluded from the final estimates owing to an absence of data for cancers in the 2010 Global Burden of Disease study. Moreover, for certain disease outcomes, e.g. adverse reproductive and oral health effects, poor quality as well as limited quantity of evidence precluded their inclusion.
Second, lack of country-specific risk estimates leads to considerable uncertainty. Despite several countries reporting SLT consumption, most did not have any reliable information on the types of SLT products used and on their associated health risks. For example, studies from several African countries reported high SLT consumption (Table 2), but provided little information on their hazard profile. There is some evidence, mainly from Sudan [30], that products used in Africa tend to have a higher pH than those used in Europe or in the USA. However, we did not find any data on the risks associated with widespread SLT use in southern parts of Africa. Likewise, various forms of SLT have been used in parts of South America (Brazilian rapê or Venezuelan chimó) for many years, yet there are no studies on the health effects of such products. In the absence of country-specific risk estimates, we assumed that in general those populations that consume similar SLT products are likely to share similar health risks and susceptibilities. We extrapolated and applied risk estimates to most countries included in our analysis on that basis (Additional file 1: Appendix 4). For cancer, our extrapolation was based on estimates obtained from several studies; for ischaemic heart diseases, extrapolations were mostly based on a single although large multi-country study (INTERHEART). As a result, almost three-quarters of the estimated SLT disease burden, which is attributed to ischaemic heart disease, is uncertain. Therefore, a cautious interpretation would be to exclude ischaemic heart disease burden figures from our estimates. However, in estimating these figures we had already excluded those regions and their respective countries that were not included in INTERHEART study. As a pointer on future research, our study highlights the need to study risk of SLT consumption on ischaemic heart diseases across the spectrum of SLT products and consumption behaviours. In time, this will produce more country-specific risk estimates, which would undoubtedly improve the reliability of our estimates presented here.
Third, the disease burden observed in 2010 is unlikely to be a consequence of SLT consumption in recent years. Therefore, our prevalence figures, obtained in surveys carried out in the last decade and used in the estimates, could be problematic. However, we assumed that the SLT consumption rates have remained stable over the last 30–40 years in these countries. We consider this as a safe assumption given that SLT use is not a new trend and historically embedded in culture and tradition in many countries, most remarkably in South Asia [31]. Consumption trends based on repeated youth surveys in India and Bangladesh suggest that SLT use has remained stable over the last decade [32]. Evidence from Sweden suggests that while more people are using snus now than 25 years ago, the consumption trends, compared to cigarette use, have essentially remained stable in this period [33, 34].
Finally, the age range of the adult sampling frames used in different SLT prevalence surveys varied, which could also increase uncertainty. The main difference between two of the key categories used was in the adult range starting from either ≥15 years or ≥25 years. Given that the risk of cancers and ischemic heart disease accumulates after many years of use well beyond young adult age, it may not have made much of a difference to our burden of disease estimates.
For the seven countries in South-East Asia region D, we estimated that 55,060 deaths caused by cancers of mouth, pharynx, and oesophagus, could be attributed to SLT in 2010. This is a little higher than the estimates from a recent study in which 50,000 deaths were attributed to SLT in eight South Asian countries [4]. This discrepancy may be explained by the fact that we used the most recent, updated prevalence and burden of disease figures.
Our estimate does not include economic impact. However, given the nature of the associated diseases, it is likely that the SLT use imposes a huge economic burden on weak health systems and poor economies. Moreover, owing to higher consumption of SLT among people of lower socio-economic status and inequitable access to health care in low-income and middle-income countries, its use is likely to contribute to driving disadvantaged sections of these societies into further poverty. A disproportionate impact on the male population (more than 70 % of disease burden due to SLT is in males) is also likely to have a disproportionate economic impact on societies in terms of reduced workforce contributions by men. On the other hand, effective legislation, policy, and preventive programmes could avert this burden due to SLT.
The signatories of the WHO’s Framework Convention on Tobacco Control should, in addition to the focus on reducing smoking consumption and related harm, now also consider the need to regulate production, marketing, and labelling of SLT products. This is particularly necessary in those countries where prevalence is high and SLT products are manufactured at a large scale without any checks on the carcinogenic level of their ingredients [35]. In countries where its use is largely limited to immigrant populations (such as in the UK) [36], strict regulation and taxation policies should be enforced which prevent import of SLT products and sale by local shops.
SLT is an important health issue, applying to a large part of the world. The data presented here are the most comprehensive gathered and brought together thus far. However, considerable uncertainties remain pertaining to risk estimation of different diseases associated with SLT use. Therefore more research is needed to investigate the newly established and previously known adverse health outcomes pertaining to SLT, particularly within countries where prevalence is high but no research evidence of risk estimation is available. Moreover, more descriptive questions about the type of SLT products and the pattern of use should be introduced into national surveys and publications of such findings encompassing all the regions.
Conclusions
Our study, a first attempt to assess global burden of disease due to SLT, estimates that more than six million DALYs are lost and over a quarter of a million deaths occur each year owing to its consumption. There is a need to build on the insights obtained from efforts to reduce cigarette smoking-related harm and to investigate strategies to reduce use of SLT and decrease the substantial associated burden of harm.
Funding
This study was funded by grants received from Leeds City Council, Leeds, UK and Medical Research Council, UK (MC_PC_13081).
Ethics approval
No ethics approval was required for this study.
Abbreviations
- CI
Confidence intervals
- DALYs
Disability-adjusted life years
- DHS
Demographic and Health Surveys
- GATS
Global Adult Tobacco Survey
- ICS
Individual Country Survey
- PAF
Population attributable fraction
- SEBS
Special Europe Barometer Survey
- SLT
Smokeless tobacco
- STEPS
STEPwise Approach to Surveillance
- TSNA
Tobacco-specific nitrosamines
- WHO
World Health Organization
Additional file
Supplementary description of methods and results sections. (DOCX 281 kb)
Footnotes
Competing interests
KS, SS, SA, AV, MJ, and OD declare that they have no competing interests. AS reports grants from The Commonwealth Fund, outside the submitted work but no other conflict of interest.
Authors’ contributions
KS: Developed the protocol, data analysis, data interpretation, drafting and approval of the manuscript. SS: Data collection, data analysis, data interpretation, contribution to and approval of the manuscript. SA: Co-drafted the protocol, data collection, data analysis, contribution to and approval of the manuscript. AV: Data collection, data analysis, data interpretation, contribution to and approval of the manuscript. MJ: Data collection, data interpretation, contribution to and approval of the manuscript. OD: Contribution to the protocol, data interpretation, contribution to and approval of the manuscript. AS: Conceived the idea, contribution to the protocol, data interpretation, contribution to and approval of the manuscript.
Contributor Information
Kamran Siddiqi, Email: Kamran.siddiqi@york.ac.uk.
Sarwat Shah, Email: Sarwat.shah@york.ac.uk.
Syed Muslim Abbas, Email: taureanvibes@hotmail.com.
Aishwarya Vidyasagaran, Email: av661@york.ac.uk.
Mohammed Jawad, Email: mohammed.jawad06@imperial.ac.uk.
Omara Dogar, Email: Omara.dogar@york.ac.uk.
Aziz Sheikh, Email: Aziz.sheikh@ed.ac.uk.
References
- 1.CDC. Smokeless Tobacco Fact Sheets. Prepared for the 3rd International Conference on Smokeless tobacco: advancing Science and Protecting Public Health. Stockholm, Sweden: National Cancer Institute, CDC and Prevention & Stockholm Centre of Public Health; 2002.
- 2.SEARO . WHO: report on oral tobacco use and its implications in South East Asia. New Delhi: SEARO; 2004. [Google Scholar]
- 3.Palipudi K, Rizwan SA, Sinha DN, Andes LJ, Amarchand R, Krishnan A, et al. Prevalence and sociodemographic determinants of tobacco use in four countries of the World Health Organization: South-East Asia region: findings from the Global Adult Tobacco Survey. Indian J Cancer. 2014;51:S24–32. doi: 10.4103/0019-509X.147446. [DOI] [PubMed] [Google Scholar]
- 4.Boffetta P, Hecht S, Gray N, Gupta P, Straif K. Smokeless tobacco and cancer. Lancet Oncol. 2008;9:667–75. doi: 10.1016/S1470-2045(08)70173-6. [DOI] [PubMed] [Google Scholar]
- 5.International Agency for Research on Cancer. Smokeless tobacco products. In: IARC Monographs on the Evaluation of Carcinogenic Risks to Humans, vol. 89. Lyon, France: International Agency for Research on Cancer; 2008.
- 6.Stanfill SB, Connolly GN, Zhang L, Jia LT, Henningfield JE, Richter P, et al. Global surveillance of oral tobacco products: total nicotine, unionised nicotine and tobacco-specific N-nitrosamines. Tob Control. 2011;20 doi: 10.1136/tc.2010.037465. [DOI] [PubMed] [Google Scholar]
- 7.Malson JL, Sims K, Murty R, Pickworth WB. Comparison of the nicotine content of tobacco used in bidis and conventional cigarettes. Tob Control. 2001;10:181–3. doi: 10.1136/tc.10.2.181. [DOI] [PMC free article] [PubMed] [Google Scholar]
- 8.Critchley JA, Unal B. Health effects associated with smokeless tobacco: a systematic review. Thorax. 2003;58:435–43. doi: 10.1136/thorax.58.5.435. [DOI] [PMC free article] [PubMed] [Google Scholar]
- 9.Gupta PC, Ray CS, Sinha DN, Singh PK. Smokeless tobacco: a major public health problem in the SEA region: a review. Indian J Public Health. 2011;55:199–209. doi: 10.4103/0019-557X.89948. [DOI] [PubMed] [Google Scholar]
- 10.Gupta PC, Sreevidya S. Smokeless tobacco use, birth weight, and gestational age: population based, prospective cohort study of 1217 women in Mumbai, India. BMJ. 2004;328:1538. doi: 10.1136/bmj.38113.687882.EB. [DOI] [PMC free article] [PubMed] [Google Scholar]
- 11.Boffetta P, Straif K. Use of smokeless tobacco and risk of myocardial infarction and stroke: systematic review with meta-analysis. BMJ. 2009;339:b3060. doi: 10.1136/bmj.b3060. [DOI] [PMC free article] [PubMed] [Google Scholar]
- 12.Gupta PC, Subramoney S. Smokeless tobacco use and risk of stillbirth: a cohort study in Mumbai, India. Epidemiology. 2006;17:47–51. doi: 10.1097/01.ede.0000190545.19168.c4. [DOI] [PubMed] [Google Scholar]
- 13.England LJ, Kim SY, Shapiro-Mendoza CK, Wilson HG, Kendrick JS, Satten GA, et al. Maternal smokeless tobacco use in Alaska Native women and singleton infant birth size. Acta Obstet Gynecol Scand. 2012;91:93–103. doi: 10.1111/j.1600-0412.2011.01273.x. [DOI] [PubMed] [Google Scholar]
- 14.Tomar SL. Is use of smokeless tobacco a risk factor for cigarette smoking? The U.S. experience. Nicotine Tob Res. 2003;5:561–9. doi: 10.1080/1462220031000118667. [DOI] [PubMed] [Google Scholar]
- 15.Zhou J, Michaud DS, Langevin SM, McClean MD, Eliot M, Kelsey KT. Smokeless tobacco and risk of head and neck cancer: evidence from a case–control study in New England. Int J Cancer. 2013;132:1911–7. doi: 10.1002/ijc.27839. [DOI] [PMC free article] [PubMed] [Google Scholar]
- 16.Napier AD, Ancarno C, Butler B, Calabrese J, Chater A, Chatterjee H, et al. Culture and health. Lancet. 2014;384:1607–39. doi: 10.1016/S0140-6736(14)61603-2. [DOI] [PubMed] [Google Scholar]
- 17.Lawler TS, Stanfill SB, Zhang L, Ashley DL, Watson CH. Chemical characterization of domestic oral tobacco products: total nicotine, pH, unprotonated nicotine and tobacco-specific N-nitrosamines. Food Chem Toxicol. 2013;57:380–6. doi: 10.1016/j.fct.2013.03.011. [DOI] [PMC free article] [PubMed] [Google Scholar]
- 18.Ezzati M, Lopez AD, Rodgers A, Vander Hoorn S, Murray CJ. Selected major risk factors and global and regional burden of disease. Lancet. 2002;360:1347–60. doi: 10.1016/S0140-6736(02)11403-6. [DOI] [PubMed] [Google Scholar]
- 19.Lim SS, Vos T, Flaxman AD, Danaei G, Shibuya K, Adair-Rohani H, et al. A comparative risk assessment of burden of disease and injury attributable to 67 risk factors and risk factor clusters in 21 regions, 1990-2010: a systematic analysis for the Global Burden of Disease Study 2010. Lancet. 2012;380:2224–60. doi: 10.1016/S0140-6736(12)61766-8. [DOI] [PMC free article] [PubMed] [Google Scholar]
- 20.Horton R, Chan M, Kim J, Watts C, Cairncross S. Global Burden of Disease Study 2010. Lancet. 2012;380:2053–260. doi: 10.1016/S0140-6736(12)62133-3. [DOI] [PubMed] [Google Scholar]
- 21.World Health Organization . The World Health Report 2002: reducing risks, promoting healthy life. Geneva: World Health Organization; 2002. [Google Scholar]
- 22.CDC. Global Tobacco Surveillance System Data. www.cdc.gov/tobacco/global/gtss/.
- 23.The Newcastle-Ottawa Scale (NOS) for assessing the quality of nonrandomised studies in meta-analyses [http://www.ohri.ca/programs/clinical_epidemiology/oxford.asp].
- 24.Chinn S. A simple method for converting an odds ratio to effect size for use in meta-analysis. Stat Med. 2000;19:3127–31. doi: 10.1002/1097-0258(20001130)19:22<3127::AID-SIM784>3.0.CO;2-M. [DOI] [PubMed] [Google Scholar]
- 25.Rockhill B, Newman B, Weinberg C. Use and misuse of population attributable fractions. Am J Public Health. 1998;88:15–9. doi: 10.2105/AJPH.88.1.15. [DOI] [PMC free article] [PubMed] [Google Scholar]
- 26.Öberg M, Jaakkola MS, Woodward A, Peruga A, Prüss-Ustün A. Worldwide burden of disease from exposure to second-hand smoke: a retrospective analysis of data from 192 countries. Lancet. 2011;377:139–46. doi: 10.1016/S0140-6736(10)61388-8. [DOI] [PubMed] [Google Scholar]
- 27.Murray CJ, Vos T, Lozano R, Naghavi M, Flaxman AD, Michaud C, et al. Disability-adjusted life years (DALYs) for 291 diseases and injuries in 21 regions, 1990-2010: a systematic analysis for the Global Burden of Disease Study 2010. Lancet. 2012;380:2197–223. doi: 10.1016/S0140-6736(12)61689-4. [DOI] [PubMed] [Google Scholar]
- 28.Lozano R, Naghavi M, Foreman K, Lim S, Shibuya K, Aboyans V, et al. Global and regional mortality from 235 causes of death for 20 age groups in 1990 and 2010: a systematic analysis for the Global Burden of Disease Study 2010. Lancet. 2012;380:2095–128. doi: 10.1016/S0140-6736(12)61728-0. [DOI] [PMC free article] [PubMed] [Google Scholar]
- 29.Teo KK, Ounpuu S, Hawken S, Pandey MR, Valentin V, Hunt D, et al. Tobacco use and risk of myocardial infarction in 52 countries in the INTERHEART study: a case–control study. Lancet. 2006;368:647–58. doi: 10.1016/S0140-6736(06)69249-0. [DOI] [PubMed] [Google Scholar]
- 30.Idris AM, Ibrahim Y, Warnakulasuriya K, Cooper D, Johnson N, Nilsen R. Toombak use and cigarette smoking in the Sudan: estimates of prevalence in the Nile state. Prev Med. 1998;27:597–603. doi: 10.1006/pmed.1998.0331. [DOI] [PubMed] [Google Scholar]
- 31.Siddiqi K, Gupta PC, Prasad VM, Croucher R, Sheikh A. Smokeless tobacco use by south Asians. Lancet Glob Health. 2013;1 doi: 10.1016/S2214-109X(13)70021-4. [DOI] [PubMed] [Google Scholar]
- 32.Sinha DN, Palipudi KM, Jones CK, Khadka BB, Silva PD, Mumthaz M, et al. Levels and trends of smokeless tobacco use among youth in countries of the World Health Organization South-East Asia Region. Indian J Cancer. 2014;51:S50–53. doi: 10.4103/0019-509X.147472. [DOI] [PubMed] [Google Scholar]
- 33.Norberg M, Malmberg G, Ng N, Broström G. Who is using snus? - Time trends, socioeconomic and geographic characteristics of snus users in the ageing Swedish population. BMC Public Health. 2011;11:929–9. doi: 10.1186/1471-2458-11-929. [DOI] [PMC free article] [PubMed] [Google Scholar]
- 34.Rodu B, Stegmayr B, Nasic S, Cole P, Asplund K. Evolving patterns of tobacco use in northern Sweden. J Intern Med. 2003;253:660–5. doi: 10.1046/j.1365-2796.2003.01143.x. [DOI] [PubMed] [Google Scholar]
- 35.Khan A, Huque R, Shah SK, Kaur J, Baral S, Gupta PC, et al. Smokeless tobacco control policies in South Asia: a gap analysis and recommendations. Nicotine Tob Res. 2014;16:890–4. doi: 10.1093/ntr/ntu020. [DOI] [PubMed] [Google Scholar]
- 36.Panesar SS, Gatrad R, Sheikh A. Smokeless tobacco use by south Asian youth in the UK. Lancet. 2008;372:97–8. doi: 10.1016/S0140-6736(08)61014-4. [DOI] [PubMed] [Google Scholar]
- 37.National Cancer Institute and Centers for Disease Control and Prevention. Smokeless tobacco and public health: a global perspective. Bethesda, MD: US Department of Health and Human Services, Centres for Disease Control and Prevention, and National Institute of Health, National Cancer Institute; 2014.
- 38.STEPS Country Reports [http://www.who.int/chp/steps/reports/en/].
- 39.Sreeramareddy CT, Pradhan P, Sin S. Prevalence, distribution, and social determinants of tobacco use in 30 sub-Saharan African countries. BMC Med. 2014;12:243. doi: 10.1186/s12916-014-0243-x. [DOI] [PMC free article] [PubMed] [Google Scholar]
- 40.Ansra DL, Arnold F, Kishor S, Hsia J, Kaufmann R. Tobacco use by men and women in 49 countries with demographic and health surveys. DHS Comparative Reports No 31. Calverton, MD: ICF International; 2013. [Google Scholar]
- 41.World Health Organization . WHO report on the global tobacco epidemic, 2013: enforcing bans on tobacco advertising, promotion and sponsorship. Geneva: WHO; 2013. [Google Scholar]
- 42.GATS (Global Adult Tobacco Survey) [http://www.who.int/tobacco/surveillance/gats/en/].
- 43.Sreeramareddy CT, Pradhan PM, Mir IA, Sin S. Smoking and smokeless tobacco use in nine South and Southeast Asian countries: prevalence estimates and social determinants from Demographic and Health Surveys. Popul Health Metr. 2014;12:22. doi: 10.1186/s12963-014-0022-0. [DOI] [PMC free article] [PubMed] [Google Scholar]
- 44.Agaku IT, Filippidis FT, Vardavas CI, Odukoya OO, Awopegba AJ, Ayo-Yusuf OA, et al. Poly-tobacco use among adults in 44 countries during 2008-2012: evidence for an integrative and comprehensive approach in tobacco control. Drug Alcohol Depend. 2014;139:60–70. doi: 10.1016/j.drugalcdep.2014.03.003. [DOI] [PubMed] [Google Scholar]
- 45.Australian Institute of Health and Welfare . 2004 National Drug Strategy Household Survey: first results. Canberra: Australian Institute of Health and Welfare; 2005. [Google Scholar]
- 46.Anantharaman D, Chaubal PM, Kannan S, Bhisey RA, Mahimkar MB. Susceptibility to oral cancer by genetic polymorphisms at CYP1A1, GSTM1 and GSTT1 loci among Indians: tobacco exposure as a risk modulator. Carcinogenesis. 2007;28:1455–62. doi: 10.1093/carcin/bgm038. [DOI] [PubMed] [Google Scholar]
- 47.Balaram P, Sridhar H, Rajkumar T, Vaccarella S, Herrero R, Nandakumar A, et al. Oral cancer in southern India: the influence of smoking, drinking, paan-chewing and oral hygiene. Int J Cancer. 2002;98:440–5. doi: 10.1002/ijc.10200. [DOI] [PubMed] [Google Scholar]
- 48.Dikshit RP, Kanhere S. Tobacco habits and risk of lung, oropharyngeal and oral cavity cancer: a population-based case–control study in Bhopal, India. Int J Epidemiol. 2000;29:609–14. doi: 10.1093/ije/29.4.609. [DOI] [PubMed] [Google Scholar]
- 49.Goud ML, Mohapatra SC, Mohapatra P, Gaur SD, Pant GC, Knanna MN. Epidemiological correlates between consumption of Indian chewing tobacco and oral cancer. Eur J Epidemiol. 1990;6:219–22. doi: 10.1007/BF00145797. [DOI] [PubMed] [Google Scholar]
- 50.Jayalekshmi PA, Gangadharan P, Akiba S, Nair RRK, Tsuji M, Rajan B. Tobacco chewing and female oral cavity cancer risk in Karunagappally cohort, India. Br J Cancer. 2009;100:848–52. doi: 10.1038/sj.bjc.6604907. [DOI] [PMC free article] [PubMed] [Google Scholar]
- 51.Jayalekshmi PA, Gangadharan P, Akiba S, Koriyama C, Nair RRK. Oral cavity cancer risk in relation to tobacco chewing and bidi smoking among men in Karunagappally, Kerala, India: Karunagappally cohort study. Cancer Sci. 2011;102:460–7. doi: 10.1111/j.1349-7006.2010.01785.x. [DOI] [PMC free article] [PubMed] [Google Scholar]
- 52.Jayant K, Balakrishnan V, Sanghvi LD, Jussawalla DJ. Quantification of the role of smoking and chewing tobacco in oral, pharyngeal, and oesophageal cancers. Br J Cancer. 1977;35:232–5. doi: 10.1038/bjc.1977.31. [DOI] [PMC free article] [PubMed] [Google Scholar]
- 53.Jussawalla DJ, Deshpande VA. Evaluation of cancer risk in tobacco chewers and smokers: an epidemiologic assessment. Cancer. 1971;28:244–52. doi: 10.1002/1097-0142(197107)28:1<244::AID-CNCR2820280150>3.0.CO;2-H. [DOI] [PubMed] [Google Scholar]
- 54.Madani AH, Jahromi AS, Dikshit M, Bhaduri D. Risk assessment of tobacco types and oral cancer. Am J Pharmacol Toxicol. 2010;5:9–13. doi: 10.3844/ajptsp.2010.9.13. [DOI] [Google Scholar]
- 55.Muwonge R, Ramadas K, Sankila R, Thara S, Thomas G, Vinoda J, et al. Rote of tobacco smoking, chewing and alcohol drinking in the risk of oral cancer in Trivandrum, India: A nested case–control design using incident cancer cases. Oral Oncol. 2008;44:446–54. doi: 10.1016/j.oraloncology.2007.06.002. [DOI] [PubMed] [Google Scholar]
- 56.Nandakumar A, Thimmasetty KT, Sreeramareddy NM, Venugopal TC, Rajanna, Vinutha AT, et al. A population-based case control investigation on cancers of the oral cavity in Bangalore, India. British Journal of Cancer. 1990;62:847–51. [DOI] [PMC free article] [PubMed]
- 57.Rao DN, Ganesh B, Rao RS, Desai PB. Risk assessment of tobacco, alcohol and diet in oral cancer: a case–control study. Int J Cancer. 1994;58:469–73. doi: 10.1002/ijc.2910580402. [DOI] [PubMed] [Google Scholar]
- 58.Sanghvi LD, Rao KC, Khanolkar VR. Smoking and chewing of tobacco in relation to cancer of the upper alimentary tract. Br Med J. 1955;1:1111–4. doi: 10.1136/bmj.1.4922.1111. [DOI] [PMC free article] [PubMed] [Google Scholar]
- 59.Sankaranarayanan R, Duffy SW, Padmakumary G, Day NE, Nair MK. Risk factors for cancer of the buccal and labial mucosa in Kerala, southern India. J Epidemiol Community Health. 1990;44:286–92. doi: 10.1136/jech.44.4.286. [DOI] [PMC free article] [PubMed] [Google Scholar]
- 60.Wasnik KS, Ughade SN, Zodpey SP, Ingole DL. Tobacco consumption practices and risk of oro-pharyngeal cancer: a case–control study in Central India. Southeast Asian J Trop Med Publ Health. 1998;29:827–34. [PubMed] [Google Scholar]
- 61.Subapriya R, Thangavelu A, Mathavan B, Ramachandran CR, Nagini S. Assessment of risk factors for oral squamous cell carcinoma in Chidambaram, Southern India: a case–control study. Eur J Cancer Prev. 2007;16:251–6. doi: 10.1097/01.cej.0000228402.53106.9e. [DOI] [PubMed] [Google Scholar]
- 62.Wahi PN, Kehar U, Lahiri B. Factors influencing oral and oropharyngeal cancers in India. Br J Cancer. 1965;19:642–60. doi: 10.1038/bjc.1965.80. [DOI] [PMC free article] [PubMed] [Google Scholar]
- 63.Merchant A, Husain SS, Hosain M, Fikree FF, Pitiphat W, Siddiqui AR, et al. Paan without tobacco: an independent risk factor for oral cancer. Int J Cancer. 2000;86:128–31. doi: 10.1002/(SICI)1097-0215(20000401)86:1<128::AID-IJC20>3.0.CO;2-M. [DOI] [PubMed] [Google Scholar]
- 64.Roosaar A, Johansson AL, Sandborgh-Englund G, Axell T, Nyren O. Cancer and mortality among users and nonusers of snus. Int J Cancer. 2008;123:168–73. doi: 10.1002/ijc.23469. [DOI] [PubMed] [Google Scholar]
- 65.Znaori A, Brennan P, Gajalakshmi V, Mathew A, Shanta V, Varghese C, et al. Independent and combined effects of tobacco smoking, chewing and alcohol drinking on the risk of oral, pharyngeal and esophageal cancers in Indian men. Int J Cancer. 2003;105:681–6. doi: 10.1002/ijc.11114. [DOI] [PubMed] [Google Scholar]
- 66.Boffetta P, Aagnes B, Weiderpass E, Andersen A. Smokeless tobacco use and risk of cancer of the pancreas and other organs. Int J Cancer. 2005;114:992–5. doi: 10.1002/ijc.20811. [DOI] [PubMed] [Google Scholar]
- 67.Lewin F, Norell SE, Johansson H, Gustavsson P, Wennerberg J, Biörklund A, et al. Smoking tobacco, oral snuff, and alcohol in the etiology of squamous cell carcinoma of the head and neck: a population-based case-referent study in Sweden. Cancer. 1998;82:1367–75. doi: 10.1002/(SICI)1097-0142(19980401)82:7<1367::AID-CNCR21>3.0.CO;2-3. [DOI] [PubMed] [Google Scholar]
- 68.Luo J, Ye W, Zendehdel K, Adami J, Adami H-O, Boffetta P, et al. Oral use of Swedish moist snuff (snus) and risk for cancer of the mouth, lung, and pancreas in male construction workers: a retrospective cohort study. Lancet. 2007;369:2015–20. doi: 10.1016/S0140-6736(07)60678-3. [DOI] [PubMed] [Google Scholar]
- 69.Rosenquist K, Wennerberg J, Schildt EB, Bladstrom A, Hansson BG, Andersson G. Use of Swedish moist snuff, smoking and alcohol consumption in the aetiology of oral and oropharyngeal squamous cell carcinoma. A population-based case–control study in southern Sweden. Acta Otolaryngol. 2005;125:991–8. doi: 10.1080/00016480510043440. [DOI] [PubMed] [Google Scholar]
- 70.Schildt EB, Eriksson M, Hardell L, Magnuson A. Oral snuff, smoking habits and alcohol consumption in relation to oral cancer in a Swedish case–control study. Int J Cancer. 1998;77:341–6. doi: 10.1002/(SICI)1097-0215(19980729)77:3<341::AID-IJC6>3.0.CO;2-O. [DOI] [PubMed] [Google Scholar]
- 71.Mashberg A, Boffetta P, Winkelman R, Garfinkel L. Tobacco smoking, alcohol drinking, and cancer of the oral cavity and oropharynx among U.S. veterans. Cancer. 1993;72:1369–75. doi: 10.1002/1097-0142(19930815)72:4<1369::AID-CNCR2820720436>3.0.CO;2-L. [DOI] [PubMed] [Google Scholar]
- 72.Sapkota A, Gajalakshmi V, Jetly DH, Roychowdhury S, Dikshit RP, Brennan P, et al. Smokeless tobacco and increased risk of hypopharyngeal and laryngeal cancers: A multicentric case–control study from India. Int J Cancer. 2007;121:1793–8. doi: 10.1002/ijc.22832. [DOI] [PubMed] [Google Scholar]
- 73.Akhtar S, Sheikh AA, Qureshi HU. Chewing areca nut, betel quid, oral snuff, cigarette smoking and the risk of oesophageal squamous-cell carcinoma in South Asians: a multicentre case–control study. Eur J Cancer. 2012;48:655–61. doi: 10.1016/j.ejca.2011.06.008. [DOI] [PubMed] [Google Scholar]
- 74.Dar NA, Bhat GA, Shah IA, Iqbal B, Makhdoomi MA, Nisar I, et al. Hookah smoking, nass chewing, and oesophageal squamous cell carcinoma in Kashmir, India. [Erratum appears in Br J Cancer. 2013;108(7):1552 Note: Kakhdoomi MA [corrected to Makhdoomi MA]] Br J Cancer. 2012;107:1618–23. doi: 10.1038/bjc.2012.449. [DOI] [PMC free article] [PubMed] [Google Scholar]
- 75.Sehgal S, Kaul S, Gupta BB, Dhar MK. Risk factors and survival analysis of the esophageal cancer in the population of Jammu, India. Indian J Cancer. 2012;49:245–50. doi: 10.4103/0019-509X.102921. [DOI] [PubMed] [Google Scholar]
- 76.Talukdar FR, Ghosh SK, Laskar RS, Mondal R. Epigenetic, genetic and environmental interactions in esophageal squamous cell carcinoma from northeast India. PLoS One. 2013;8 doi: 10.1371/journal.pone.0060996. [DOI] [PMC free article] [PubMed] [Google Scholar]
- 77.Lagergren J, Bergstrom R, Lindgren A, Nyren O. The role of tobacco, snuff and alcohol use in the aetiology of cancer of the oesophagus and gastric cardia. Int J Cancer. 2000;85:340–6. doi: 10.1002/(SICI)1097-0215(20000201)85:3<340::AID-IJC8>3.0.CO;2-N. [DOI] [PubMed] [Google Scholar]
- 78.Zendehdel K, Nyren O, Luo J, Dickman PW, Boffetta P, Englund A, et al. Risk of gastroesophageal cancer among smokers and users of Scandinavian moist snuff. Int J Cancer. 2008;122:1095–9. doi: 10.1002/ijc.23076. [DOI] [PubMed] [Google Scholar]
- 79.Bolinder G, Alfredsson L, Englund A, de Faire U. Smokeless tobacco use and increased cardiovascular mortality among Swedish construction workers. Am J Public Health. 1994;84:399–404. doi: 10.2105/AJPH.84.3.399. [DOI] [PMC free article] [PubMed] [Google Scholar]
- 80.Sasco AJ, Merrill RM, Dari I, Benhaim-Luzon V, Carriot F, Cann CI, et al. A case–control study of lung cancer in Casablanca, Morocco. Cancer Causes Control. 2002;13:609–16. doi: 10.1023/A:1019504210176. [DOI] [PubMed] [Google Scholar]
- 81.Brown LM, Blot WJ, Schuman SH, Smith VM, Ershow AG, Marks RD, et al. Environmental factors and high risk of esophageal cancer among men in coastal South Carolina. J Natl Cancer Inst. 1988;80:1620–5. doi: 10.1093/jnci/80.20.1620. [DOI] [PubMed] [Google Scholar]
- 82.Alguacil J, Silverman DT. Smokeless and other noncigarette tobacco use and pancreatic cancer: a case–control study based on direct interviews. Cancer Epidemiol Biomarkers Prev. 2004;13:55–8. doi: 10.1158/1055-9965.EPI-03-0033. [DOI] [PubMed] [Google Scholar]
- 83.Hassan MM, Abbruzzese JL, Bondy ML, Wolff RA, Vauthey JN, Pisters PW, et al. Passive smoking and the use of noncigarette tobacco products in association with risk for pancreatic cancer: a case–control study. Cancer. 2007;109:2547–56. doi: 10.1002/cncr.22724. [DOI] [PMC free article] [PubMed] [Google Scholar]
- 84.Alexander M. Tobacco use and the risk of cardiovascular diseases in developed and developing countries. Cambridge: University of Cambridge; 2013. [Google Scholar]
- 85.Rahman MA, Zaman MM. Smoking and smokeless tobacco consumption: possible risk factors for coronary heart disease among young patients attending a tertiary care cardiac hospital in Bangladesh. Public Health. 2008;122:1331–8. doi: 10.1016/j.puhe.2008.05.015. [DOI] [PubMed] [Google Scholar]
- 86.Rahman MA, Spurrier N, Mahmood MA, Rahman M, Choudhury SR, Leeder S. Is there any association between use of smokeless tobacco products and coronary heart disease in Bangladesh? PLoS One. 2012;7 doi: 10.1371/journal.pone.0030584. [DOI] [PMC free article] [PubMed] [Google Scholar]
- 87.Hergens MP, Ahlbom A, Andersson T, Pershagen G. Swedish moist snuff and myocardial infarction among men. Epidemiology. 2005;16:12–6. doi: 10.1097/01.ede.0000147108.92895.ba. [DOI] [PubMed] [Google Scholar]
- 88.Hergens MP, Alfredsson L, Bolinder G, Lambe M, Pershagen G, Ye W. Long-term use of Swedish moist snuff and the risk of myocardial infarction amongst men. [Erratum appears in J Intern Med. 2007;262(5):590] J Intern Med. 2007;262:351–9. doi: 10.1111/j.1365-2796.2007.01816.x. [DOI] [PubMed] [Google Scholar]
- 89.Huhtasaari F, Asplund K, Lundberg V, Stegmayr B, Wester PO. Tobacco and myocardial infarction: is snuff less dangerous than cigarettes? BMJ. 1992;305:1252–6. doi: 10.1136/bmj.305.6864.1252. [DOI] [PMC free article] [PubMed] [Google Scholar]
- 90.Huhtasaari F, Lundberg V, Eliasson M, Janlert U, Asplund K. Smokeless tobacco as a possible risk factor for myocardial infarction: a population-based study in middle-aged men. J Am Coll Cardiol. 1999;34:1784–90. doi: 10.1016/S0735-1097(99)00409-X. [DOI] [PubMed] [Google Scholar]
- 91.Johansson S-E, Sundquist K, Qvist J, Sundquist J. Smokeless tobacco and coronary heart disease: a 12-year follow-up study. [Erratum appears in Eur J Cardiovasc Prev Rehabil. 2007;14(5):722] Eur J Cardiovasc Prev Rehabil. 2005;12:387–92. doi: 10.1097/01.hjr.0000169189.22302.99. [DOI] [PubMed] [Google Scholar]
- 92.Wennberg P, Eliasson M, Hallmans G, Johansson L, Boman K, Jansson JH. The risk of myocardial infarction and sudden cardiac death amongst snuff users with or without a previous history of smoking. J Intern Med. 2007;262:360–7. doi: 10.1111/j.1365-2796.2007.01813.x. [DOI] [PubMed] [Google Scholar]
- 93.Asplund K, Nasic S, Janlert U, Stegmayr B. Smokeless tobacco as a possible risk factor for stroke in men - a nested case–control study. Stroke. 2003;34:1754–9. doi: 10.1161/01.STR.0000076011.02935.A1. [DOI] [PubMed] [Google Scholar]
- 94.Hergens M-P, Lambe M, Pershagen G, Terent A, Ye W. Smokeless tobacco and the risk of stroke.[Erratum appears in Epidemiology. 2009;20(3):471] Epidemiology. 2008;19:794–9. doi: 10.1097/EDE.0b013e3181878b33. [DOI] [PubMed] [Google Scholar]
- 95.Hansson J, Pedersen NL, Galanti MR, Andersson T, Ahlbom A, Hallqvist J, et al. Use of snus and risk for cardiovascular disease: results from the Swedish Twin Registry. J Intern Med. 2009;265:717–24. doi: 10.1111/j.1365-2796.2009.02081.x. [DOI] [PubMed] [Google Scholar]
- 96.Janzon E, Hedblad B. Swedish snuff and incidence of cardiovascular disease. A population-based cohort study. BMC Cardiovasc Disord. 2009;9:21. doi: 10.1186/1471-2261-9-21. [DOI] [PMC free article] [PubMed] [Google Scholar]