


Abstract
In vitro evolution experiments have long been used to evaluate the roles of RNA in both modern and ancient biology, and as a tool for biotechnology applications. The conditions under which these experiments have been conducted, however, do not reflect the range of cellular environments in modern biology or our understanding of chemical environments on the early earth, when the atmosphere and oceans were largely anoxic and soluble Fe2+ was abundant. To test the impact of environmental factors relevant to RNA's potential role in the earliest forms of life, we evolved populations of self-cleaving ribozymes in an anoxic atmosphere with varying pH in the presence of either Fe2+ or Mg2+. Populations evolved under these different conditions are dominated by different sequences and secondary structures, demonstrating global differences in the underlying fitness landscapes. Comparisons between evolutionary outcomes and catalytic activities also indicate that Mg2+ can readily take the place of Fe2+ in supporting the catalysis of RNA cleavage at neutral pH, but not at lower pH. These results highlight the importance of considering the specific environments in which functional biopolymers evolve when evaluating their potential roles in the origin of life, extant biology, or biotechnology.
INTRODUCTION
Exploration of RNA function through in vitro evolution has been used to understand contemporary biology, evaluate origin of life scenarios, and develop tools for biotechnology. Examining sequence space both locally and globally (often in combination) has been used to gain insight into what RNA can do (1–3), how common functional RNAs are in sequence space (4), how complex functional RNAs need to be (5), and how RNA can evolve new functions (6,7). These insights are limited, however, by the range of conditions used to explore random sequence space through in vitro evolution. This range is narrow relative to both the range of conditions proposed for the origin of life and the conditions under which RNA is known to function in extant biology. While experiments that examine local sequence space have covered a broader range of conditions, the sequences examined in those experiments are derived from either prior in vitro evolution experiments (8) or from biologically evolved RNAs that are amenable to in vitro evolution (9). Experiments in which previously evolved RNAs are adapted to a new environment provide important insight into RNA evolution, but they cannot identify global changes to the underlying fitness landscapes in response to changing conditions. Therefore, understanding the impact of environmental parameters on RNA's functional capacity requires a broader exploration of parameter space with experiments that randomly sample sequence space.
Folding and function of RNA is known to be sensitive to several environmental factors such as, pH (10,11), temperature (12,13), ionic strength (14), and counterion identity (15,16). The extent to which RNA could have supported specific functions in the earliest forms of life is therefore dependent on the environments in which life emerged. Geological evidence of complex microbial life (17) places the origin of life on earth at >3.4 billion years ago, when atmospheric and oceanic O2 were largely absent (18–20) and soluble Fe2+ was abundant (21–23). Recent work has shown that two ribozymes (one natural and one identified through in vitro evolution) have enhanced activity in Fe2+ (24), suggesting that Fe2+ is likely to significantly alter RNA fitness landscapes.
Diverse locations on the early earth have been proposed for the origin and early evolution of life, including land surface hydrothermal systems (25), hydrothermal deep sea environments (26), and eutectic ices (27). Proposed pH values for these environments range from acidic surface hydrothermal ponds (pH 2–3) (25), to closer to neutral late Hadean (pH 3.5–7) (28,29) and early Archean ocean (pH 6–8) (30), to basic hydrothermal vents (pH 10–11) (31). Among these values, mildly acidic conditions are most favorable for the chemical stability of RNA (32) and may have been favorable for the emergence of RNA-based life (33). Assessing the impact of both Fe2+ and pH is therefore critical in evaluating RNA's role in early life.
We used in vitro evolution of site-specific self-cleavage as a means of testing the impact of Fe2+ and pH on the evolution of RNA function. Site-specific self-cleavage requires RNA to fold into a defined structure to form an active site. Evolution of self-cleavage thus provides a means of assessing the capacity of RNA to form well-defined active sites (11,34–36) over a range of experimental conditions. We evolved self-cleaving ribozymes in an anoxic atmosphere and varied pH and metal ion identity. The emergence of functional sequences was tracked between rounds of evolution and conserved sequences and secondary structures were identified. Large differences in outcomes between the parallel evolutionary trajectories demonstrate the impact of these environmental parameters on RNA's capacity to form catalytic structures.
MATERIALS AND METHODS
DNA library and starting RNA populations
DNA oligonucleotides were synthesized by IDT. The double-stranded DNA starting library was generated by heat annealing two partially complementary DNA oligonucleotides and then extending them with DNA polymerase I Klenow fragment (Thermo Scientific). The resulting 226 base pair DNA library includes 90 nucleotides of fully randomized sequence flanked by 5′ and 3′ constant regions. The 5′ constant sequence is GCCATGTAATACGACTCACTATAGGGACACGACGCTCTTCCGATCT. T7 promoter sequence is italicized and the sequence in bold functions as the primer-binding site for both PCR amplification and Illumina sequencing. The 3′ constant sequence is GGGCATAAGGTATTTAATTCCATACTGGACCCAGTCAGTAGACACAACAAGTTCTTAGACGAGATAATACTACGCTAACACCGCACCAACC. The underlined sequence in the 3′ constant sequence is the target cleavage sequence, this is the same target sequence used in a prior in vitro evolution experiment (35). The constant sequence 3′ of the cleavage site facilitates resolution of inactive full-length RNA from the cleaved RNA.
The DNA library of ∼2×10¹⁴ molecules was transcribed to generate a population of ∼2 × 10¹⁶ RNA molecules, from which aliquots of ∼1015 molecules were taken for each trajectory. Transcription was carried out in transcription buffer (50 mM Tris–HCl pH 7.5, 10 mM NaCl, 30 mM MgCl2, 2 mM spermidine, 40 mM DTT) with 5 mM of each NTP, 50 μM blocking oligo and T7 RNA polymerase (Promega) for 12–18 h at 37°C. The blocking oligo (TACTGACTGGGTCCAG), which is fully complementary to the cleavage sequence, was included to inhibit undesired self-cleavage during transcription (35,37). RNA was purified and blocking oligomer was removed through denaturing polyacrylamide gel electrophoresis (PAGE). The RNA population was recovered from the gel through electro-elution, precipitated, re-suspended, refolded, and then incubated at final concentration of 1 μM in the selection buffer (10 mM MES, 50 mM KCl, and 5 mM MgCl2 or 5 mM FeCl2, at pH 5 or pH 7) for 30 minutes.
Evolution of site-specific cleavage under multiple conditions
We evolved independent populations at pH 5 or at pH 7, in the presence of Mg2+ or Fe2+. All selection steps were performed under anoxic conditions due to iron's propensity to quickly oxidize in the presence of atmospheric oxygen. During each step, full-length RNA was allowed to site-specifically cleave for 30 min at room temperature (22°C). The short incubation time limits the opportunity for oxidation of Fe2+, but provides ample time for catalytic self-cleaving sequences to react. The active sequences within the RNA population were separated from inactive full-length RNA using denaturing PAGE. Size standards were run along side the population during PAGE so that only those sequences that cleave within the defined cleavage sequence were selected. The catalytically active sequences were recovered from the gel through electro-elution, precipitated, and re-suspended. The re-suspended sample was then reverse transcribed using ImProm-II reverse transcriptase (Promega), and amplified via PCR using Taq DNA polymerase (Thermo Scientific). Finally, the PCR products were transcribed in vitro to generate the RNA population used in the next round of evolution. This process was repeated until significant levels of self-cleavage were evident after incubation as determined by UV shadowing.
Anoxic environment
All selections and activity assays were done under continuously bubbling argon. Water and solutions of RNA were sparged with Ar for 30 minutes prior to selections and assays. Metal salts were kept under flowing Ar for 30 min before dissolving with sparged water. 1.5 ml microfuge tubes were placed inside 15 ml falcon tubes topped with septa (Syringa). Flexible plastic tubing was attached to the gas regulator on one end and a 0.2 μm syringe filter on the other end. Each filter was fitted with a needle, which then pierced the falcon tube septa. To prevent contact with solution, needles were threaded with narrow PTFE tubing that was fitted through punctured microfuge tube lids and submerged into the solution. For a more rigorous exclusion of atmospheric O2, all pH 7 selections were performed inside a glove bag (Glas-Col), using the same set up.
Sequencing and analysis of evolved populations
In vitro evolved populations were sequenced on an Illumina HiSeq 2000 instrument. The in vitro evolution experiments were evaluated by sequencing the 13 populations described here, along with 6 additional populations on a single lane. Prior to sequencing, populations were reverse transcribed and PCR amplified with primers that introduce indexing sequences that allow the multiplexing of multiple populations in a single-sequencing lane. Phusion High-Fidelity DNA polymerase (Thermo Scientific) with an error rate of 10−7–10−6 (38) was used for this PCR step to minimize mutations after the final selection step.
Eight to fourteen million raw sequence reads per population were quality filtered down to 3–5 million by completely removing all reads in which any position has a Qphred score of <14 and the constant regions of the sequences were trimmed off prior to analysis using a python script (available upon request). From each population 1 million filtered reads were counted, clustered into families of related sequences and compared between populations using FASTAptamer toolkit (39) with an edit distance of 10 used to define sequence families.
Variation within families and shared features between families were both exploited to infer functional motifs using Tallymer (40), Mafft (41) RNAalifold (42), and RNABOB (43). Tallymer was used to identify common k-mers within a representative set of sequences from each population (representative sequences included only the most abundant sequence read from every sequence family) by first identifying all k-mers within the populations and then counting the number of occurrences of each k-mer. Potential secondary structures were identified through a combination of both manual inspection of sequences and the use of RNA folding software. In the latter case, sequences within clusters were aligned using Mafft and RNAalifold was used to generate secondary structure predictions based on conservation within the 90 nucleotide variable region of individual families. Conserved secondary structure predictions and sequence conservation between families were used to generate motif descriptors (Supplementary Figure S4) for use with RNABOB. The motif descriptors were used to determine the number and distribution of conserved motifs within the various populations. We used control data sets to estimate the false positive rates, which depending on the population and descriptor, range from 0% to 5%.
Self-cleavage activity assays
The activity of ribozymes was determined by denaturing PAGE of 32P labeled RNA. RNA was transcribed from DNA templates in the presence of 32P α-CTP and the blocking oligomer. 32P body-labeled ribozymes were purified, refolded, and then incubated in the selection buffer for 30 min. All assays were performed under anoxic conditions. Cleaved products were separated on 5% PAGE and quantified using ImageQuant software to determine the extent of cleavage. In addition to the above quantitative assays, qualitative assays were performed on non-labeled transcripts of select ribozyme variants using ethidium bromide stained gels.
RESULTS
Sequence-level differences in populations evolved in differing environmental conditions
We evolved multiple populations of self-cleaving ribozymes from the same starting library, in the presence of Mg2+ or Fe2+ at low or neutral pH under anoxic conditions (Figure 1 and Supplementary Figure S1). Cycles of evolution were repeated until self-cleavage was evident after 30 minutes. The RNA populations displayed significant levels of cleavage after four to seven rounds of evolution. The populations were then evolved for an additional round in which the identity of the divalent cation was either kept the same as the preceding round or changed to the other divalent cation (Figure 1). The evolved populations were then sequenced. From the ∼3–5 million quality-filtered reads per population, 106 reads were randomly selected from each population for comparisons between populations.
Figure 1.
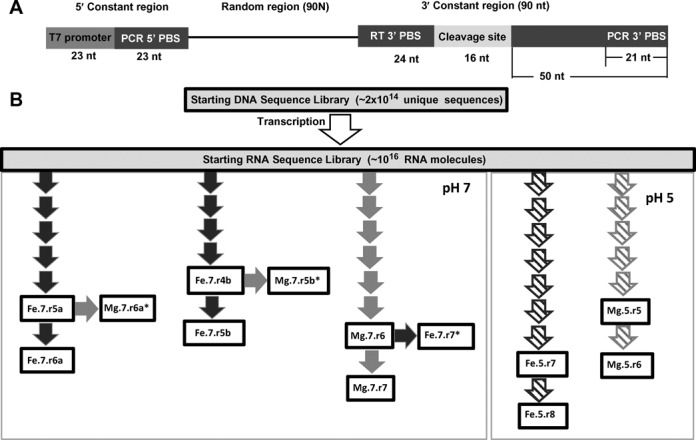
The in vitro evolution construct and evolutionary trajectories. (A) The DNA template with T7 promoter and 5′ constant sequence, 90 nucleotides of random sequence, and 3′ constant sequence. The 3′ constant sequence contains the RT primer binding site, followed by the 16 nucleotide cleavage site. Immediately 3′ of the cleavage site is an arbitrary sequence of 29 nucleotides, followed by the 3′ PCR binding site. (B) A schematic representation of the evolutionary trajectories. A single DNA library was transcribed into a multi-copy RNA population. The RNA population was split into separate populations of ∼1015 sequences each. Each RNA population was then evolved through multiple rounds of evolution in the presence of either Fe2+ (black arrows) or Mg2+ (gray arrows) at pH 7 (filled arrows) or pH 5 (hashed arrows). Populations shown in boxes were sequenced. The naming of populations follows the nomenclature Xx.Y.rZ, where Xx = cation present, Y = the pH used, and Z = round of the evolution.
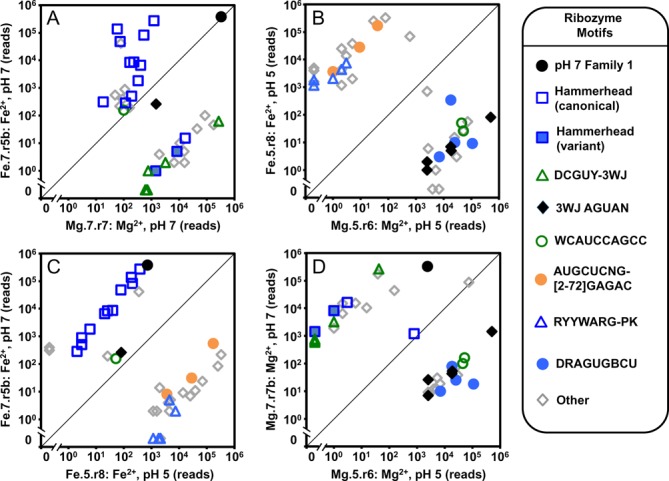
A direct comparison between two populations independently evolved under the same environmental conditions (Fe.7.r6a and Fe.7.r5b; see Figure 1 for population nomenclature) shows that the abundances (number of total reads) of their sequences are similar (Figure 2A). These populations have 42345 and 57749 unique sequences respectively, of which 29565 and 41265 have only a single read (Supplementary Figure S2). These single-read sequences make up ∼70% of unique sequences, but <4.2% of the total reads. These two populations (Fe.7.r6a and Fe.7.r5b) share 16094 unique sequences that encompass >95% of the reads and 38% and 28% of the unique sequences within their respective populations. The fact that many low abundance sequences are observed in only one of the two populations can be attributed to a combination of limited sampling and random variations between the separate evolutionary trajectories. For these two populations, all sequences with >102 reads in one population are also present in the other population. With the exception of one, all shared sequences differ in abundance by <2 orders of magnitude. In contrast, populations evolved under differing conditions have large differences in sequence abundances (Figure 2B-D). Populations evolved in Mg2+ or Fe2+ at pH 7 (Mg.7.r7 and Fe.7.r5b) have 3744 shared sequences, which comprise ∼80% of the reads, and 11% and 6% of the unique sequences within their respective populations. While a single shared sequence makes up nearly a quarter of both of these populations, several highly abundant sequences differ in abundance by >2 orders of magnitude. Additionally, many sequences with abundances >103 in one population are absent from the other (Figure 2B). A comparison of populations evolved in Mg2+ or Fe2+ at pH 5 (Mg.5.r6 and Fe.5.r8 respectively) shows an even larger difference in sequence abundances, compare (Figure 2C) and (Figure 2B). Only 767 sequences are shared between the two populations, which comprise only 13% and 5% of the reads and <1% of the unique sequences within their respective populations. Nearly all sequences with abundances >102 differ in abundance by >2 orders of magnitude. Populations also show a strong sensitivity to pH. Populations evolved in Fe2+ at pH 5 or pH 7 (Fe.5.r8 and Fe.7.r5b) have only 1056 shared sequences (Figure 2D), which comprise 60% and 78% of the reads and <2% of their unique sequences. The difference in abundance of these few shared sequences is large. All of the sequences with read abundance >103 differ in abundance by > 2 orders of magnitude.
Figure 2.
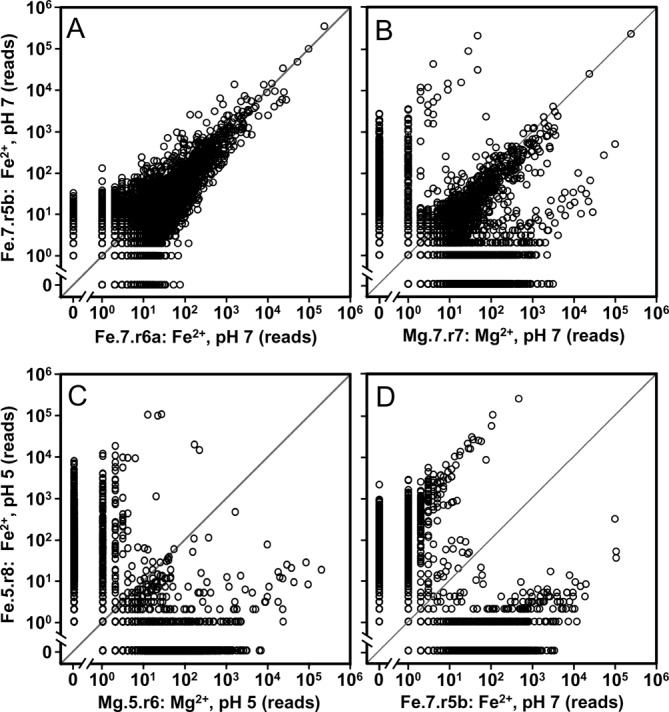
Impact of ion identify and pH on sequence abundance. Each point on the scatter plots represents the abundance of a unique sequence in two different populations. For plots (A) and (B) the y-axis is the sequence abundance within a random sample of 106 reads from a population evolved in the presence of Fe2+ at pH 7 (Fe.7.r5b) plotted against the sequence abundance in populations (A) evolved under the same conditions along an independent trajectory (Fe.7.r6a), and (B) evolved in the presence of Mg2+ at pH 7 (Mg.7.r7). For plots (C) and (D) the y-axis is the sequence abundance within a population evolved in the presence of Fe2+ at pH 5 (Fe.5.r8) plotted against the abundance of sequences in populations (C) evolved in the presence of Mg2+ at pH 5 (Mg.5.r6) and (D) evolved in the presence of Fe2+ at pH 7 (Fe.7.r5b).
A small number of sequence families dominate the evolved populations
With 90 fully randomized positions, the starting library samples a sequence space of 490 (∼1054) possible sequences. The true diversity of the starting library, however, comprises ∼1014 unique sequences, resulting in sparse sampling of sequence space within the starting populations. While additional variation is introduced by mutations that occur during the amplification steps, the mutation rate is low (approximate error rates per base pair per duplication for Taq DNA polymerase, and T7 RNA polymerase used for amplification are within the range of 10−4–10−5) (38,44) and sampling of theoretical sequence space remains sparse. Therefore, highly similar sequences in the final populations likely descend from a shared parental sequence and can be assigned to a sequence family. Additional variation is introduced into the sequence data through sequencing errors and mutations that occur after the final cycle of evolution. Sequence families are generally dominated by a single sequence and the number of reads drops off rapidly with increasing edit distance (number of substitutions, insertions, deletions) from the dominant sequence, dropping to <10 reads with an edit distance of 10 in the entire population of the 106 reads. We therefore establish a cut-off of >10-edit distance for defining sequence families.
The vast majority of reads belong to a small number of large sequence families (Figure 3A, B, and Supplementary Figure S2; and Supplementary Table S1) e.g. for most populations the 10 most abundant families make up ∼90% of the reads. An increasingly large fraction of the population is encompassed by fewer families as the populations progress through the final round of evolution, compare (Figure 3A) and (Figure 3B). As the largest families grow in abundance there is also an increase in the observed sequence diversity within them, as previously observed (45). As with the sequence-level comparison, family-level comparisons of populations evolved in different conditions reveal large differences in abundance (Supplementary Figure S3).
Figure 3.
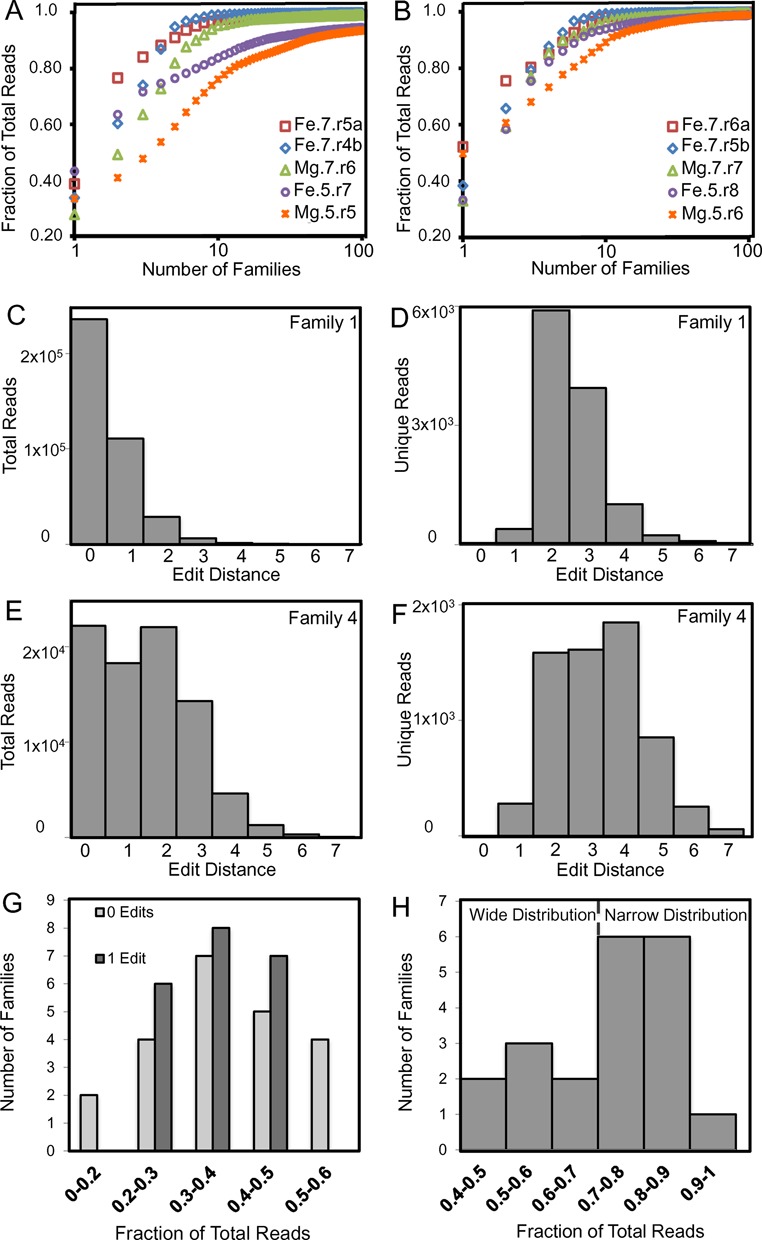
Structure of evolved populations. The fraction of (A) penultimate and (B) final populations (by total reads) that is described by a given number of families. (C) Abundance of reads within the most abundant family (Family 1) of Fe.7.r5b as a function of edit distance. (D) Abundance of unique sequence within Family 1. (E) Abundance of reads within Family 4. (F) Abundance of unique sequences within Family 4. (G) The number of families as a function of the fraction of total reads with edit distance 0 (light gray) and edit distance 1 (dark gray) for the top 22 families. (H) The number of families as a function of the fraction of total reads with edit distance ≤1 for the top 22 families.
The distribution of sequences within sequence families varies between populations. For populations evolved at pH 7, the most abundant sequence, within families that have >100 reads, on average account for 60% of the family's reads in Mg.7.r7 and 40% in Fe.7.r5b, and at pH 5 36% for Fe.5.r8, and 45% in Mg.5.r6. For all populations, the majority of reads have sequences with an edit distance of ≤1 within their respective families, as previously observed in evolution of aptamers (46).
In addition to differences between populations, the abundances of reads at a given edit distance vary widely among families within the same population. For example, the most abundant family (Family 1; Figure 3C and D) within population Fe.7.r5b has a narrow distribution with the fraction of reads with an edit distance ≤1 comprising 90% of the family. Conversely, Family 4 has a broad distribution (Figure 3E, F) where sequences with edit distance ≤1 comprise only 49% of the family. To illustrate the range of distributions within a population, we plotted, for all families with at least 100 reads, the number of families within the Fe.7.r5b population that have either narrow or wide distributions (Figure 3G, H).
Conserved motifs
Extensive sequence level conservation between families is present within the populations. Conserved sequence elements were identified by searching for recurring sequence patterns 8 nucleotides in length (8-mers). This length was chosen due to the observation that most 8-mers in the population are unique to just one or two families, and therefore 8-mers observed in several families represent enrichment. Many of the most common 8-mers have overlapping sequences that can be aligned (Supplementary Figure S4), and are flanked by additional conserved sequences. These observations reveal the presence of longer, recurring, sequence elements. In some cases, conserved secondary structures can be identified within or proximal to these sequence elements revealing conserved structural motifs.
One of the conserved motifs identified within these populations corresponds to a known, naturally occurring ribozyme, the hammerhead (HH) ribozyme. This motif was also present in prior in vitro evolution experiments (34–36). The presence of the HH ribozyme structural motif within our populations was evident based on the abundance of the signature sequence CUGANGA present in many HH ribozymes. Several of the most common 8-mers contain this sequence and other sequence elements of the HH motif such as GAAA (Supplementary Figure S4). Structure-based searches (Supplementary Figure S5) confirmed many instances of the HH motif (Figure 4 and Supplementary Figure S6). We searched for all sequences that could form the secondary structure of the minimal HH ribozyme's three-way junction with the three single stranded sequence elements, NUGANNA (the underlined Ns form a basepair), GAAA, and UN. The HH motif is most prevalent in the final pH 7, Fe2+-evolved population. 115 of the 739 sequence families within the Fe.7.r5b population conform to this motif, and the sum of all reads within these families represents 57% of the population. The HH motif is also common in the Mg.7.r7 population where 139 of the 1314 families contain the HH motif and represent 3% of the read abundance. A representative HH ribozyme (Family 2 from Fe.7.r5b) shows a high extent of cleavage in the presence of either Fe2+ or Mg2+ (Figure 5).
Figure 4.
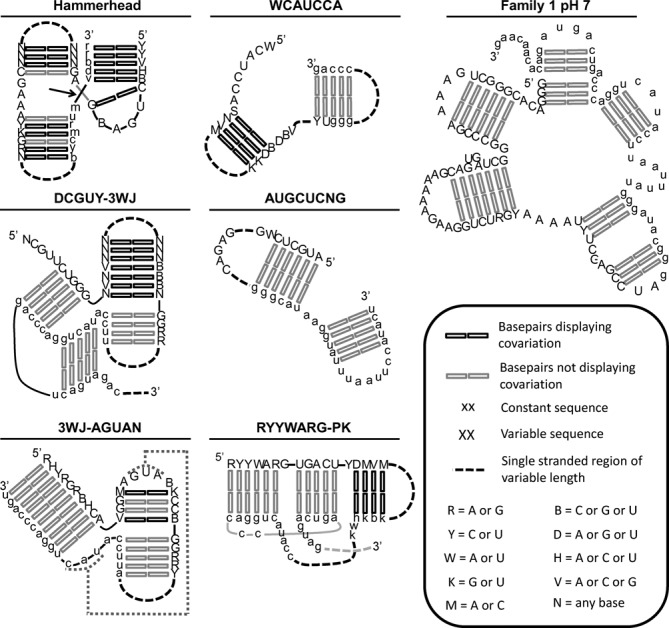
Secondary structures. Left two columns show consensus descriptions of six conserved motifs. The consensus descriptors are based on the 10 most abundant representatives of the motif within the population in which the motif is most abundant. Conservation and covariation among the representative sequences of the 10 most abundant families are depicted as indicated in the legend. Truncated Family 1 ribozyme is shown in the right-most column.
Figure 5.
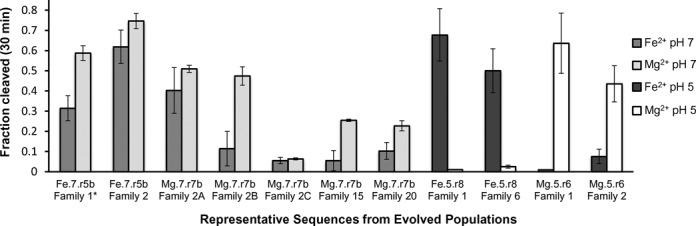
Activity of evolved ribozymes. Fraction of self-cleavage of representative ribozymes in Fe2+ and Mg2+ at 30 min. The population in which each sequence is most abundant is indicated along with its family within that population. Family 1* sequence from Fe.7.r5b is also the most abundant sequence in the Mg.7.r7 population. The representative sequences are the most abundant sequence within their respective families, with the exceptions of Family 2B and Family 2C, which are additional variants from within Family 2 of population Mg.7.r7. Data are represented as mean±SD from triplicate measurements.
Another conserved motif was identified among the populations evolved at pH 7. The most common 8-mers in Mg.7.r7 have overlapping alignments (Supplementary Figure S4) that suggest they are part of the longer conserved sequence DCGUYCUGGG. Mutations within this conserved sequence (Family 2 variants C and D) disrupt activity (Figure 5 and Supplementary Figure S7). Within the DCGUYCUGGG sequences, the underlined sequence has the potential to basepair with the target cleavage sequence. Sequences immediately 3′ of the DCGUYCUGGG sequence can pair to form a 7 basepair stem, followed immediately by a third potential stem forming a three-way junction. The single stranded sequence within this three-way junction (DCGUY-3WJ) has sequence complementarity to the sequence immediately 3′ of the 3WJ, potentially forming a pseudoknot (Figure 4). This motif is most prevalent in the final pH 7, Mg2+-evolved population. 300 of the 1314 families within the Mg.7.r7 population conform to this motif, and represent 28% of the reads. Some representatives of the DCGUY-3WJ motif (Family 2 variant B and Family 15 from Mg.7.r7) show significantly higher levels of activity in the presence of Mg2+ than in the presence of Fe2+, while others do not (Family 2 variants A and C from Mg.7.r7; Figure 5). Family 2 variants B and C are two low abundance variants (10 and 60 reads in Mg.7.r7, and 9 and 180 reads in Fe.7.r7*, respectively) that were assayed in addition to the most abundant sequence (variant A). Variant C is atypical in that it increases in abundance in Fe2+ from one round to the next, and deviates from the consensus DCGUY sequence (Supplementary Figure S8).
Several common 8-mers in Mg.5.r6 have overlapping sequence alignments (Supplementary Figure S4) that indicate they are part of a conserved sequence that has the potential to form a 4 base pair stem-loop. The stem is capped by a 5 nucleotide loop and flanked by conserved sequences 5′ and 3′ of the stem that have sequence complementarity to the cleavage sequence forming a three-way junction. A truncated ribozyme sequence containing only the proposed three-way junction retains catalytic activity (Supplementary Figure S7) supporting the functional significance of the three-way junction. The single stranded sequence within this three-way junction (3WJ-AGUAN) has sequence complementarity to the sequence within the conserved stem-loop, potentially forming a pseudoknot (Figure 4) in which the extent of pairing is demarcated by the helical constraints of pairing in the context of a stem loop (47). Several potential AC and GA pairs are present within this motif (Supplementary Figure S6). This motif is most prevalent in the final pH 5, Mg2+-evolved population. 235 of the 1888 sequence families within the Mg.5.r6 population conform to this motif and represent 55% of the reads. A representative of the 3WJ-AGUAN ribozyme (Family 1 from Mg.5.r6) displays high levels of activity in the presence of Mg2+ and no detectable activity in Fe2+ after 30 minutes (Figure 5).
Two additional conserved sequence elements that are common in the pH 5 Mg2+ evolved populations are: WCAUCCAGCC, and DRAGUGGCU. For sequences with WCAUCCAGCC, immediately 3′ of the WCAUCCA sequence are sequences that can pair to form a stem of 4 or more basepairs, followed by a second stem that is partially within the 3′ constant region (Figure 4 and Supplementary Figure S6). 263 of the 1888 sequence families within the Mg.5.r6 population contain this motif and represent 13% of the reads. Predicted secondary structures for sequences containing DRAGUGGCU provide limited evidence for conserved secondary structures. Sequences containing DRAGUGGCU are most prevalent in the final pH 5, Mg2+-evolved population. 258 of the 1888 sequence families within the Mg.5.r6 population contain this sequence element and represent 17% of the reads. A representative of the DRAGUGGCU ribozyme (Family 2 from Mg.5.r6) has significantly higher levels of activity in the presence of Mg2+ than in the presence of Fe2+ (Figure 5).
Examination of common 8-mers in the final pH 5 Fe2+-evolved population reveals two conserved sequence elements, AUGCUCNG[2–72]GAGAC and CUARGUGACUCGCCCA. The AUGCUCNG sequence has sequence complementarity with the 3′ constant sequence, and secondary structure predictions for multiple families are consistent with base-pairing between these complementary sequences (Figure 4 and Supplementary Figure S6). In most of the sequence families, the AUGCUCNG sequence is close to the 3′ end of the random region, separated by only 2 nucleotides from GAGAC. This motif is most prevalent in the final pH 5, Fe2+-evolved population. 99 of the 6861 sequence families within the Fe.5.r8 population conform to this motif and represent 20% of the reads. A representative of this motif (Family 6 from Fe.5.r8) has significantly higher levels of activity in the presence of Fe2+ than in the presence of Mg2+ (Figure 5). The CUARGUGACUCGCCCA sequence also has extensive sequence complementarity with the 3′ constant region, which results in three stems within the context of a pseudoknot (RYYWARG-PK). Searches based on this secondary structure (Supplementary Figure S5) identified additional sequence variants capable of adopting the same base-pairing pattern (Figure 4 and Supplementary Figure S6). This RYYWARG-PK motif is most abundant in the final pH 5, Fe2+-evolved population. 246 of the 6861 sequence families within the Fe.5.r8 population conform to this motif and represent 3% of the reads.
In addition to the recurring motifs present in multiple families, several families appear to be unique. Family 1 from the pH 7-evolved populations is representative of a non-recurring motif. The most abundant sequence in Family 1 from pH 7 evolved populations is identical for both the Fe2+- and Mg2+-evolved populations. This sequence cleaves in both the presence of Mg2+ and Fe2+ (Figure 5). In the absence of inter-family conservation, we relied on intra-family diversity to make structural inferences. Based in part on predicted secondary structures, the sequence was truncated. Removal of a 19 nucleotide segment near the 5′ end, an internal segment of 27 nucleotides, as well as a segment of 39 nucleotides at the 3′ end result in a truncated version of the ribozyme that retains activity (Supplementary Figure S7). This truncated sequence comprises a five-way junction that includes base pairing between the random region and the cleavage sequence (Figure 4). Family 1 from the pH 5-evolved Fe.5.r8 population also appears to be unique, with the possible exception of Family 4 from the same population. The most abundant sequence from this family exhibits a high extent of cleavage in the presence of Fe2+, but does not show detectable cleavage in the presence of Mg2+ (Figure 5).
Unrelated motifs dominate populations evolved under different conditions
The populations evolved in Fe2+ at pH 7 are dominated by HH ribozymes. Among the 20 most abundant families in Fe.7.r5b, 11 are HH ribozymes and most HHs are more abundant in the Fe2+- than the Mg2+-evolved populations (Figure 6A). The relatively high activity of the HH ribozyme in the presence of Fe2+, relative to other motifs present in the pH 7 populations (Figure 5), is reflected in its dominance in the Fe2+-population evolved at pH 7. Among the HH ribozymes we observe multiple G10.1Y variants that are more abundant in the Mg2+-evolved populations. This mutation, which forms part of a specific divalent metal ion binding site near the active site (48) was observed in a previous in vitro evolution experiment (34). Within populations evolved in Mg2+ at pH 7, the DCGUY-3WJ motif is highly abundant. Among the 20 most abundant families in Mg.7.r7, DCGUY-3WJ motif is present in 5 families and all 5 are much more abundant in the Mg2+- than the Fe2+-evolved population (Figure 6A). The less pronounced differences in the activities of the Family 1, the HH and the DCGUY-3WJ ribozymes in the presence of Mg2+ (Figure 5), is consistent with the absence of a single dominant motif in the Mg2+-evolved population.
Figure 6.
Ion identity and pH favor the evolution of distinct motifs. The abundances of sequence families within two populations are plotted against one another: (A) pH 7 in Mg2+ (x-axis) pH 7 in Fe2+ (y-axis), (B) pH 5 in Mg (x-axis) pH 5 in Fe2+ (y-axis), (C) Fe2+ at pH 5 (x-axis) Fe2+ at pH 7 (y-axis), (D) Mg2+ at pH 5 (x-axis) Mg2+ at pH 7 (y-axis). Each symbol represents a family of sequences. The motif present in each family is indicated in the legend. The 20 most abundant families in each of the two populations are shown.
For populations evolved at pH 5, nearly all families show a strong evolutionary preference for one of the divalent ions (Figure 6B). Among the 20 most abundant families in the final pH 5-evolved populations (Fe.5.r8 and Mg.5.r6), all 3 of the AUGCUCNG, and all 5 of the RYYWARG-PK families are much more abundant in the Fe2+-evolved population. Large differences are also observed for all 5 of the 3WJ-AGUAN and all 4 of DRAGUGGCU families, which are much more abundant in the Mg2+ evolved populations. These larger differences in abundances at pH 5 are consistent with the stricter metal ion dependence of catalytic activity of representatives that were assayed at pH 5 than those at pH 7 (Figure 5).
For the Fe2+ populations evolved at pH 7 and pH 5 (Figure 6C), all of the HH motif families, and the pH 7 Family 1 ribozyme are much more abundant in the pH 7-evolved population. All 3 of the AUGCUCNG and all 5 of the RYYWARG-PK families are much more abundant in the pH 5-evolved population. A comparison of Mg2+-evolved populations at pH 7 and pH 5 (Figure 6D) reveals that 3 of 4 HH families, the pH 7 Family 1 ribozyme, and all 6 DCGUY-3WJ families are much more abundant in the pH 7 population. All 5 of the 3WJ-AGUAN and all 4 of the DRAGUGBCU families are much more abundant in the pH 5-evolved population.
Altering divalent metal ions has asymmetric effects
Examining RNA populations evolved in changing conditions allows us to evaluate their ability to adapt. It also allows us to evaluate the relative impact of factors other than the environment on differences between independently evolved populations.
In the final round of evolution, the conditions were either kept identical to those used in the preceding rounds or the identity of the divalent ion was switched (Figure 1). We compared the change in abundance of the top 20 families between penultimate and final rounds (Figure 7). The populations initially evolved in Fe2+ do not appear to be affected by changing the divalent metal ion identity (Figure 7A and B). One outlier of this trend is an AUGCUCNG family, which is unchanged (Figure 7A) or slightly enriched (Figure 7B) in the presence of Fe2+ and dramatically decreases when Fe2+ is replaced with Mg2+. This is consistent with its greater abundance in the Fe2+ populations than the Mg2+ populations at both pH 7 and pH 5.
Figure 7.
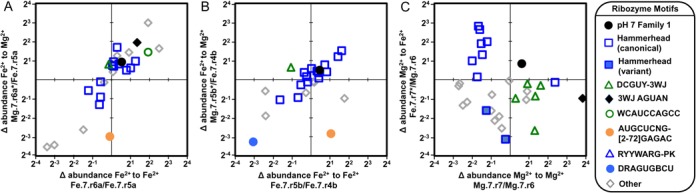
Impact of changing the identity of the divalent ion between successive rounds of in vitro evolution. In each panel the change in abundance is plotted for two final populations relative to a shared population from the preceding round. The 20 most abundant sequence families in each of the three populations are shown. The motif to which each family belongs is indicated as in the legend. (A) The fractional change in abundances of families evolved at pH 7 in the presence of Fe2+ after an additional round of evolution in which the selection conditions remain unchanged (x-axis) or in which Fe2+ is replaced with Mg2+ (y-axis).) (B) The fractional change in abundance for duplicate populations evolved independently in Fe2+. (C) The fractional change in abundance of families evolved a pH 7 in the presence of Mg2+ after an additional round of evolution in which the selection conditions remain unchanged (x-axis) or in which Mg2+ is replaced with Fe2+ (y-axis).
In contrast, the Mg2+-evolved population exhibits strong sensitivity to a counterion change. Only the most abundant family (Family 1) increases in abundance for both of the final populations (Figure 7C). This result is consistent with its high abundance in both the Mg2+ and Fe2+-evolved populations at pH 7 (Figure 6A). Most of the HHs decrease in abundance in Mg2+ and increase when Mg2+ is replaced with Fe2+ in the final round, consistent with the prevalence of HH ribozymes in the independently evolved Fe2+ populations. The G10.1Y variants of the HH show a low level of depletion when evolved with Mg2+, but decrease more when Mg2+ is replaced with Fe2+, which is again consistent with their relative abundances in the independently evolved populations (Figure 6A). The DCGUY-3WJ families are enriched in the presence of Mg2+ and depleted in Fe2+, in agreement with the relative abundances observed between independently evolved populations. One of the families with 3WJ-AGUAN motif is highly enriched in the presence of Mg2+, while slightly depleted with Fe2+. This result is in agreement with the greater abundance of this motif in the Mg2+-evolved populations than in the Fe2+-evolved populations at both pH 7 and pH 5. Agreement between changes in sequence enrichment upon changing the divalent cation (Figure 7), and differences in motif abundances within the independently evolved populations (Figure 6), indicates that the differences in evolutionary outcomes are primarily determined by the differences in environmental conditions.
DISCUSSION
By conducting several, parallel in vitro evolution experiments under different sets of conditions we show that Fe2+, Mg2+, pH 7, and pH 5 all favor the evolution of different sequences and secondary structures. Each starting RNA population contained ∼1015 molecules, which is an average of 5 copies per unique sequence in the shared starting library. While most sequences are predicted to be present in all five populations, copy number will vary between populations and 0.67% of the unique sequences (assuming uniform transcriptional efficiency) will be absent from a given starting population. In addition to variation in the starting population, other stochastic processes, especially during early rounds when copy number is low, may significantly impact evolutionary outcomes. It is therefore critical to assess the extent to which these factors contribute to the variation in evolutionary outcomes by comparing populations evolved along parallel evolutionary trajectories under the same conditions. Populations evolved under the same conditions are strikingly similar; they have similar sequence abundances (Figure 2A) and are characterized by the same motifs that respond to changes in the selection conditions in a reproducible manner (Figure 7A and B). In contrast, there are large differences in sequence and motif abundances in populations evolved in different environments (Figures 2 and 6) and these differences are in agreement with motif enrichment upon a change in ion identity (Figure 7). These observations indicate that the differences in evolutionary outcomes between different populations are primarily determined by differences in the environment and not by differences in the starting populations or other stochastic processes. While the evolutionary fitness is determined by the combination of amplification efficiency and catalytic activity, amplification always occurs under identical conditions; therefore differences in fitness can be attributed to differences in selection conditions. Sequence families that share a common motif also share a clear evolutionary preference for one set of conditions (Figure 6) and respond to changes to those conditions in a similar manner (Figure 7). These observations support the functional significance of these motifs.
The impact of Fe2+ and pH on evolution of RNA function is relevant to the role of RNA in early life due to the abundance of soluble Fe2+, and the wide range of pH values in environments in which life may have emerged and evolved. Recent work has shown increased rates of activity for an in vitro evolved L1 ligase ribozyme, and increased rate and extent of cleavage for a HH ribozyme at micromolar concentrations of Fe2+ (24). Based on the prior evidence of enhanced catalysis by RNA-iron complexes, we predicted that populations evolved in the presence of Fe2+ would have a wider range of functional structures than populations evolved in Mg2+, however, this is not what we observe. At pH 7, we observe a wider variety of motifs in Mg2+-evolved populations. The Fe2+ populations are dominated by HH ribozymes at pH 7. The ribozyme populations evolved in Fe2+ at pH 7 showed little sensitivity to having Mg2+ substituted for Fe2+ in the final round of evolution (Figure 7A and B), indicating that most of the ribozymes in the Fe2+ populations tolerate the substitution of Mg2+ for Fe2+. Activity assays further support this, as the most abundant sequences evolved in Fe2+ show high activity with Mg2+ (Figure 5). In contrast to the Fe2+-evolved populations, additional motifs challenge the HH motif's dominance in the Mg2+-evolved populations. The Mg2+ populations are very sensitive to having Fe2+ substituted for Mg2+ (Figure 7C), resulting in a drop in abundance of ribozyme that do not contain the HH motif. It therefore appears, that at pH 7, Mg2+ supports the emergence of a wider variety of functional motifs from random sequence space. At pH 5, no single motif dominates either of the populations and a variety of high abundance motifs are observed in both Mg2+- and Fe2+-evolved populations. At pH 5 we do not observe activity of Fe2+-evolved ribozymes in Mg2+, nor do we observe the activity of Mg2+-evolved ribozymes in the presence of Fe2+. Mg2+ therefore appears to be less capable of substituting for Fe2+ at pH 5 than at pH 7. The availability of Fe2+ has declined dramatically over the course of earth's history, which would have necessitated a divalent metal ion switch for Fe2+-utilizing biopolymers. Our observations suggest that at neutral pH, Mg2+ can readily take over for Fe2+ in supporting non-redox RNA function, but not at pH 5.
Basepairs are the most fundamental unit of nucleic acid secondary structure. The protonation state of nucleobases dictates their potential to form hydrogen bonds, therefore pH impacts RNA structure. Formation of biologically relevant A•C and C•C pairs (49) has been previously demonstrated in RNA. Formation of A+•C and C+•C pairs has also been suggested as an important aspect of RNA structure at mildly acidic conditions (33) and the stability of A•C pairs at pH 5 has been shown to be comparable to that of A-U and G•U basepairs at pH 7 (50). Our data support the evolution of multiple potential A•C pairs at pH 5 (Supplementary Figure S6). Formation of markedly different structures, and the presence of potential A•C basepairs in populations evolved at pH 5 underscores the importance of pH in evolution of RNA structure.
The only naturally occurring self-cleaving ribozyme motif detected in these populations is the HH ribozyme. Previous experiments, in which Mg2+ was the only multivalent ion present, also resulted in the evolution of this motif (34–36). This motif occurs frequently in all domains of life where its self-cleavage activity regulates gene expression and facilitates replication of RNA genomes, reviewed in (51). In contrast, the naturally occurring Hairpin (HP) ribozyme motif is not observed, even though the target cleavage sequence contains two sequences that could have served as canonical HP ribozyme substrates. This is consistent with the fact that this ribozyme is rare in biology, with only three known sequences, reviewed in (52). The absence of HP ribozymes in our populations and biology provides evidence against prior proposals that this motif is common in sequence space (42,53).
Hammerhead ribozymes are present in both Fe2+-evolved and Mg2+-evolved populations, consistent with previous work that showed Fe2+ readily substitutes for Mg2+ to support folding and catalysis of this motif (24). While the HH motif makes up only a minor fraction of the Mg2+-evolved population, it dominates the Fe2+ population evolved at pH 7. Moreover, the HH ribozymes make up <0.1% of the pH 5-evolved populations. The relative abundances of HH ribozymes among these populations are in agreement with known pH and counterion dependence of HH ribozyme activity. The highest rates of cleavage for the HH ribozyme in the presence of Mg2+ and Cd2+ (a transition metal with similar pKa value to Fe2+) are at pH 9 and 7.5, respectively (54). Our Fe2+ evolution condition was therefore likely closer to the optimal pH for this motif at pH 7 than the Mg2+ evolution condition, and it appears that the abundance of the HH motif follows the trend of the pH-rate profile. Evolution at a pH value so far below the Mg2+-optimum for the HH ribozyme appears to have provided an advantage to other ribozymes in the Mg2+-evolved populations. The higher abundance of the G10.1Y mutation of the metal binding site in the Mg2+ populations may also reflect the large difference between pH 7 and the pKa of Mg2+, as this may result in the metal ion playing a diminished role in the hammerhead catalysis. In a previous in vitro evolution experiment, this mutation was favored in early rounds of evolution at 20 mM Mg2+, pH 8, and strongly disfavored in the later rounds of evolution at 1 mM Mg2+ (34), which is consistent with our observations that this mutation is weakly disfavored at 5 mM Mg2+, pH 7 (Figure 7).
By using random sequence space as the starting point, we allowed evolution to interrogate unrelated structural scaffolds in varied environments. This resulted in the evolution of several recurring motifs whose abundances varied, in some cases quite dramatically, between populations evolved under different conditions. This shows that pH and substitutions between Fe2+ and Mg2+ have a strong impact on the relative fitness of motifs that are common in sequence space. Overall, the differences in evolutionary outcomes observed here suggest that changes in pH and ion identity play a significant role in determining how common function is in sequence space, how easily new function is achieved, and ultimately what roles can be reasonably predicted for RNA in both ancient and extant life.
Supplementary Material
Acknowledgments
We are grateful to Khalid Alam and Donald Burke for early access to FASTAptamer software. We thank Ali Ergun for assistance with sequence data processing software. Authors declare no conflict of interest.
SUPPLEMENTARY DATA
Supplementary Data are available at NAR Online.
FUNDING
Science Innovation Fund Grant and NASA Exobiology Grant from NASA to MAD and NASA Postdoctoral Program Fellowship to MP. Funding for open access charge: National Aeronautics and Space Administration.
Conflict of interest statement. None declared.
REFERENCES
- 1.Bartel D.P., Szostak J.W. Isolation of new ribozymes from a large pool of random sequences. Science. 1993;261:1411–1418. doi: 10.1126/science.7690155. [DOI] [PubMed] [Google Scholar]
- 2.Zhang B., Cech T.R. Peptide bond formation by in vitro selected ribozymes. Nature. 1997;390:96–100. doi: 10.1038/36375. [DOI] [PubMed] [Google Scholar]
- 3.Robertson D.L., Joyce G.F. Selection in vitro of an RNA enzyme that specifically cleaves single-stranded DNA. Nature. 1990;344:467–468. doi: 10.1038/344467a0. [DOI] [PubMed] [Google Scholar]
- 4.Jimenez J.I., Xulvi-Brunet R., Campbell G.W., Turk-MacLeod R., Chen I.A. Comprehensive experimental fitness landscape and evolutionary network for small RNA. Proc. Natl. Acad. Sci. U.S.A. 2013;110:14984–14989. doi: 10.1073/pnas.1307604110. [DOI] [PMC free article] [PubMed] [Google Scholar]
- 5.Carothers J.M., Oestreich S.C., Davis J.H., Szostak J.W. Informational complexity and functional activity of RNA structures. J. Am. Chem. Soc. 2004;126:5130–5137. doi: 10.1021/ja031504a. [DOI] [PMC free article] [PubMed] [Google Scholar]
- 6.Held D.M., Greathouse S.T., Agrawal A., Burke D.H. Evolutionary landscapes for the acquisition of new ligand recognition by RNA aptamers. J. Mol. Evol. 2003;57:299–308. doi: 10.1007/s00239-003-2481-y. [DOI] [PubMed] [Google Scholar]
- 7.Schultes E.A., Bartel D.P. One sequence, two ribozymes: implications for the emergence of new ribozyme folds. Science. 2000;289:448–452. doi: 10.1126/science.289.5478.448. [DOI] [PubMed] [Google Scholar]
- 8.Attwater J., Wochner A., Holliger P. In-ice evolution of RNA polymerase ribozyme activity. Nat. Chem. 2013;5:1011–1018. doi: 10.1038/nchem.1781. [DOI] [PMC free article] [PubMed] [Google Scholar]
- 9.Lehman N., Joyce G.F. Evolution in vitro of an RNA enzyme with altered metal dependence. Nature. 1993;361:182–185. doi: 10.1038/361182a0. [DOI] [PubMed] [Google Scholar]
- 10.Cottrell J.W., Scott L.G., Fedor M.J. The pH dependence of hairpin ribozyme catalysis reflects ionization of an active site adenine. J. Biol. Chem. 2011;286:17658–17664. doi: 10.1074/jbc.M111.234906. [DOI] [PMC free article] [PubMed] [Google Scholar]
- 11.Jayasena V.K., Gold L. In vitro selection of self-cleaving RNAs with a low pH optimum. Proc. Natl. Acad. Sci. U.S.A. 1997;94:10612–10617. doi: 10.1073/pnas.94.20.10612. [DOI] [PMC free article] [PubMed] [Google Scholar]
- 12.Mikulecky P.J., Feig A.L. Heat capacity changes in RNA folding: application of perturbation theory to hammerhead ribozyme cold denaturation. Nucleic Acids Res. 2004;32:3967–3976. doi: 10.1093/nar/gkh723. [DOI] [PMC free article] [PubMed] [Google Scholar]
- 13.Kortmann J., Narberhaus F. Bacterial RNA thermometers: molecular zippers and switches. Nat. Rev. Microbiol. 2012;10:255–265. doi: 10.1038/nrmicro2730. [DOI] [PubMed] [Google Scholar]
- 14.Shcherbakova I., Gupta S., Chance M.R., Brenowitz M. Monovalent ion-mediated folding of the Tetrahymena thermophila ribozyme. J. Mol. Biol. 2004;342:1431–1442. doi: 10.1016/j.jmb.2004.07.092. [DOI] [PubMed] [Google Scholar]
- 15.Steiner M., Rueda D., Sigel R.K.O. Ca2+ induces the formation of two distinct subpopulations of group II intron molecules. Angew. Chem.-Int. Ed. 2009;48:9739–9742. doi: 10.1002/anie.200903809. [DOI] [PMC free article] [PubMed] [Google Scholar]
- 16.Lehman N., Bernhard T., Larson B.C., Robinson A., Southgate C. Empirical demonstration of environmental sensing in catalytic RNA: evolution of interpretive behavior at the origins of life. BMC Evol. Biol. 2014;14:248. doi: 10.1186/s12862-014-0248-2. [DOI] [PMC free article] [PubMed] [Google Scholar]
- 17.Allwood A.C., Grotzinger J.P., Knoll A.H., Burch I.W., Anderson M.S., Coleman M.L., Kanik I. Controls on development and diversity of Early Archean stromatolites. Proc. Natl. Acad. Sci. U.S.A. 2009;106:9548–9555. doi: 10.1073/pnas.0903323106. [DOI] [PMC free article] [PubMed] [Google Scholar]
- 18.Kasting J.F., Pavlov A.A., Siefert J.L. A coupled ecosystem-climate model for predicting the methane concentration in the Archean atmosphere. Origins Life Evol. Bios. 2001;31:271–285. doi: 10.1023/a:1010600401718. [DOI] [PubMed] [Google Scholar]
- 19.Pavlov A.A., Kasting J.F. Mass-independent fractionation of sulfur isotopes in Archean sediments: strong evidence for an anoxic Archean atmosphere. Astrobiology. 2002;2:27–41. doi: 10.1089/153110702753621321. [DOI] [PubMed] [Google Scholar]
- 20.Holland H.D. The oxygenation of the atmosphere and oceans. Philos. Trans. R. Soc. Lond. B Biol. Sci. 2006;361:903–915. doi: 10.1098/rstb.2006.1838. [DOI] [PMC free article] [PubMed] [Google Scholar]
- 21.Ewers W.E. In: Iron Formations: Facts and Problems. Trendall AF, Morris RC, editors. Amsterdam: Elsevier; 1983. [Google Scholar]
- 22.Holland H.D. The oceans: a possible source of iron in iron-formations. Econ. Geol. 1973;68:1169–1172. [Google Scholar]
- 23.Planavsky N.J., McGoldrick P., Scott C.T., Li C., Reinhard C.T., Kelly A.E., Chu X., Bekker A., Love G.D., Lyons T.W. Widespread iron-rich conditions in the mid-Proterozoic ocean. Nature. 2011;477:448–451. doi: 10.1038/nature10327. [DOI] [PubMed] [Google Scholar]
- 24.Athavale S.S., Petrov A.S., Hsiao C., Watkins D., Prickett C.D., Gossett J.J., Lie L., Bowman J.C., O'Neill E., Bernier C.R., et al. RNA Folding and Catalysis Mediated by Iron (II) PLoS One. 2012;7:e38024. doi: 10.1371/journal.pone.0038024. [DOI] [PMC free article] [PubMed] [Google Scholar]
- 25.DeGuzman V., Vercoutere W., Shenasa H., Deamer D. Generation of oligonucleotides under hydrothermal conditions by non-enzymatic polymerization. J. Mol. Evol. 2014;78:251–262. doi: 10.1007/s00239-014-9623-2. [DOI] [PubMed] [Google Scholar]
- 26.Russell M.J., Daniel R.M., Hall A.J. On the Emergence of Life Via Catalytic Iron-Sulfide Membranes. Terra Nova. 1993;5:343–347. [Google Scholar]
- 27.Attwater J., Wochner A., Pinheiro V.B., Coulson A., Holliger P. Ice as a protocellular medium for RNA replication. Nat. Commun. 2010;1:76. doi: 10.1038/ncomms1076. [DOI] [PubMed] [Google Scholar]
- 28.Morse J.W., Mackenzie F.T. Hadean ocean carbonate geochemistry. Aquat. Geochem. 1998;4:301–319. [Google Scholar]
- 29.Russell M.J., Hall A.J. The emergence of life from iron monosulphide bubbles at a submarine hydrothermal redox and pH front. J. Geol. Soc. Lond. 1997;154:377–402. doi: 10.1144/gsjgs.154.3.0377. [DOI] [PubMed] [Google Scholar]
- 30.Holland H., Kasting J. In: The Proterozoic Biosphere: A Multidisciplinary Study. Schopf J, Klein C, editors. Cambridge: Cambridge University Press; 1992. pp. 21–23. [Google Scholar]
- 31.Kelley D.S., Karson J.A., Fruh-Green G.L., Yoerger D.R., Shank T.M., Butterfield D.A., Hayes J.M., Schrenk M.O., Olson E.J., Proskurowski G., et al. A serpentinite-hosted ecosystem: the Lost City hydrothermal field. Science. 2005;307:1428–1434. doi: 10.1126/science.1102556. [DOI] [PubMed] [Google Scholar]
- 32.Oivanen M., Kuusela S., Lonnberg H. Kinetics and mechanisms for the cleavage and isomerization of the phosphodiester bonds of RNA by Bronsted acids and bases. Chem. Rev. 1998;98:961–990. doi: 10.1021/cr960425x. [DOI] [PubMed] [Google Scholar]
- 33.Bernhardt H.S., Tate W.P. Primordial soup or vinaigrette: did the RNA world evolve at acidic pH. Biol. Direct. 2012;7:4. doi: 10.1186/1745-6150-7-4. [DOI] [PMC free article] [PubMed] [Google Scholar]
- 34.Conaty J., Hendry P., Lockett T. Selected classes of minimised hammerhead ribozyme have very high cleavage rates at low Mg2+ concentration. Nucleic Acids Res. 1999;27:2400–2407. doi: 10.1093/nar/27.11.2400. [DOI] [PMC free article] [PubMed] [Google Scholar]
- 35.Salehi-Ashtiani K., Szostak J.W. In vitro evolution suggests multiple origins for the hammerhead ribozyme. Nature. 2001;414:82–84. doi: 10.1038/35102081. [DOI] [PubMed] [Google Scholar]
- 36.Tang J., Breaker R.R. Structural diversity of self-cleaving ribozymes. Proc. Natl. Acad. Sci. U.S.A. 2000;97:5784–5789. doi: 10.1073/pnas.97.11.5784. [DOI] [PMC free article] [PubMed] [Google Scholar]
- 37.Saksmerprome V., Roychowdhury-Saha M., Jayasena S., Khvorova A., Burke D.H. Artificial tertiary motifs stabilize trans-cleaving hammerhead ribozymes under conditions of submillimolar divalent ions and high temperatures. RNA. 2004;10:1916–1924. doi: 10.1261/rna.7159504. [DOI] [PMC free article] [PubMed] [Google Scholar]
- 38.McInerney P., Adams P., Hadi M.Z. Error rate comparison during polymerase chain reaction by DNA polymerase. Mol. Biol. Int. 2014;2014:287430. doi: 10.1155/2014/287430. [DOI] [PMC free article] [PubMed] [Google Scholar]
- 39.Alam K.K., Chang J.L., Burke D.H. FASTaptamer: a bioinformatic toolkit for high-throughput sequence analysis of combinatorial selections. Mol. Ther. Nucleic Acids. 2015;4:e230. doi: 10.1038/mtna.2015.4. [DOI] [PMC free article] [PubMed] [Google Scholar]
- 40.Kurtz S., Narechania A., Stein J.C., Ware D. A new method to compute K-mer frequencies and its application to annotate large repetitive plant genomes. BMC Genomics. 2008;9:517. doi: 10.1186/1471-2164-9-517. [DOI] [PMC free article] [PubMed] [Google Scholar]
- 41.Katoh K., Misawa K., Kuma K., Miyata T. MAFFT: a novel method for rapid multiple sequence alignment based on fast Fourier transform. Nucleic Acids Res. 2002;30:3059–3066. doi: 10.1093/nar/gkf436. [DOI] [PMC free article] [PubMed] [Google Scholar]
- 42.Mutschler H., Holliger P. Non-canonical 3′-5′ extension of RNA with prebiotically plausible ribonucleoside 2′,3′-cyclic phosphates. J. Am. Chem. Soc. 2014;136:5193–5196. doi: 10.1021/ja4127714. [DOI] [PMC free article] [PubMed] [Google Scholar]
- 43.Gautheret D., Major F., Cedergren R. Pattern searching/alignment with RNA primary and secondary structures: an effective descriptor for tRNA. Comput. Appl. Biosci. 1990;6:325–331. doi: 10.1093/bioinformatics/6.4.325. [DOI] [PubMed] [Google Scholar]
- 44.Brakmann S., Grzeszik S. An error-prone T7 RNA polymerase mutant generated by directed evolution. Chembiochem. 2001;2:212–219. doi: 10.1002/1439-7633(20010302)2:3<212::AID-CBIC212>3.0.CO;2-R. [DOI] [PubMed] [Google Scholar]
- 45.Ameta S., Winz M.L., Previti C., Jaschke A. Next-generation sequencing reveals how RNA catalysts evolve from random space. Nucleic Acids Res. 2014;42:1303–1310. doi: 10.1093/nar/gkt949. [DOI] [PMC free article] [PubMed] [Google Scholar]
- 46.Ditzler M.A., Lange M.J., Bose D., Bottoms C.A., Virkler K.F., Sawyer A.W., Whatley A.S., Spollen W., Givan S.A., Burke D.H. High-throughput sequence analysis reveals structural diversity and improved potency among RNA inhibitors of HIV reverse transcriptase. Nucleic Acids Res. 2013;41:1873–1884. doi: 10.1093/nar/gks1190. [DOI] [PMC free article] [PubMed] [Google Scholar]
- 47.Popović M., Greenbaum N.L. Role of helical constraints of the EBS1-IBS1 duplex of a group II intron on demarcation of the 5′ splice site. RNA. 2014;20:24–35. doi: 10.1261/rna.039701.113. [DOI] [PMC free article] [PubMed] [Google Scholar]
- 48.Martick M., Lee T.S., York D.M., Scott W.G. Solvent structure and hammerhead ribozyme catalysis. Chem. Biol. 2008;15:332–342. doi: 10.1016/j.chembiol.2008.03.010. [DOI] [PMC free article] [PubMed] [Google Scholar]
- 49.Bink H.H., Hellendoorn K., van der Meulen J., Pleij C.W. Protonation of non-Watson-Crick base pairs and encapsidation of turnip yellow mosaic virus RNA. Proc. Natl. Acad. Sci. U.S.A. 2002;99:13465–13470. doi: 10.1073/pnas.202287499. [DOI] [PMC free article] [PubMed] [Google Scholar]
- 50.Meroueh M., Chow C.S. Thermodynamics of RNA hairpins containing single internal mismatches. Nucleic Acids Res. 1999;27:1118–1125. doi: 10.1093/nar/27.4.1118. [DOI] [PMC free article] [PubMed] [Google Scholar]
- 51.Hammann C., Luptak A., Perreault J., de la Pena M. The ubiquitous hammerhead ribozyme. RNA. 2012;18:871–885. doi: 10.1261/rna.031401.111. [DOI] [PMC free article] [PubMed] [Google Scholar]
- 52.Symons R.H. Plant pathogenic RNAs and RNA catalysis. Nucleic Acids Res. 1997;25:2683–2689. doi: 10.1093/nar/25.14.2683. [DOI] [PMC free article] [PubMed] [Google Scholar]
- 53.Briones C., Stich M., Manrubia S.C. The dawn of the RNA World: toward functional complexity through ligation of random RNA oligomers. RNA. 2009;15:743–749. doi: 10.1261/rna.1488609. [DOI] [PMC free article] [PubMed] [Google Scholar]
- 54.Roychowdhury-Saha M., Burke D.H. Extraordinary rates of transition metal ion-mediated ribozyme catalysis. RNA. 2006;12:1846–1852. doi: 10.1261/rna.128906. [DOI] [PMC free article] [PubMed] [Google Scholar]
Associated Data
This section collects any data citations, data availability statements, or supplementary materials included in this article.