

Abstract
Food insecurity has detrimental effects on the mental, physical, and behavioral health of developing children. Few studies, however, have sought to determine whether associations exist between food insecurity and intake of vegetables, fresh or canned fruit, candy or cookies, French fries, fast food, water, milk, fruit juices, fruit drinks, soda, and sports drinks. To identify independent associations that exist between maternal food insecurity and food and drink intake among toddlers, population-based data from the 2006–2008 Oregon Pregnancy Risk Assessment Monitoring System follow-back survey (Oregon PRAMS-2) of 1,522 mothers of 2-year-old children were analyzed. Maternal food insecurity was defined as mothers' report of eating less because of lack of money for food. Typical weekly child food and drink intake was examined using polytomous logistic regression: 0–1 days/week, 2–3 days/week, and 4–7 days/week. Maternal food insecurity prevalence was 11.7 %. Compared to toddlers of food secure mothers, toddlers of food insecure mothers consumed vegetables (adjusted odds ratio [AOR] for 4–7 days/week = 0.31; 95 % confidence interval [CI] 0.12, 0.79) and fruit (AOR for 4–7 days/week = 0.25; 95 % CI 0.08, 0.75) fewer days of the week. Toddlers of food insecure mothers consumed soda (AOR for 4–7 days/week = 3.21; 95 % CI 1.12, 9.14) more days of the week. Maternal food insecurity is associated with weekly intake of certain foods and drinks. Among toddlers, consumption of fewer vegetables and fruit, and more soda may help explain the link between food insecurity and poor health.
Keywords: Food security, Vegetables, Fruit, Soda, Toddlers, Oregon
Introduction
Food insecurity has adverse impacts on the mental, physical, and behavioral health of developing children, especially among low-income groups, some racial/ethnic minorities, and some immigrant groups [1–4]. According to the National Research Council, “food insecurity, as measured in the United States, refers to the social and economic problem of lack of food due to resource or other constraints, not voluntary fasting or dieting, or because of illness or for other reasons [5].” The 2006–2008 average estimated prevalence of food insecurity in households reported by the Food Assistance and Nutrition Research Program at the United States Department of Agriculture (USDA) was 13.1 % in Oregon, slightly higher than the national prevalence of 12.2 % [6]. As the extent of food insecurity has become better understood, some researchers have sought to identify contextual factors at the state- and county-level that influence the likelihood that families will experience food insecurity, such as housing affordability [7, 8]. Other researchers have sought to investigate the role of food insecurity in the development of adverse mental, physical, and behavioral health outcomes in childhood, such as internalizing and externalizing problems, iron deficiency anemia, and increased hospitalization [9–16]. Even so, opportunities for intervention remain elusive, in part because of a lack of clarity over the pathways linking food insecurity to healthy mental, physical, and behavioral development.
Inadequate nutrition may be a critical pathway linking food insecurity to mental, physical, and behavioral health [13, 15]. Numerous studies highlight the importance of nutritious food availability and affordability to human development [9, 12, 17, 18]. Toddlerhood, in particular, is a stage of development when rapid physical growth and dramatic brain development occur and is characterized by a transition from a direct maternal control of nutrition to indirect control in which toddlers begin to select food and drinks based on self-selection and self-gratification [17, 19]. Poor eating and drinking habits among toddlers, particularly the intake of high caloric and energy dense food and drinks, may result in nutritional problems that can impair growth and development [20]. Additionally, dietary habits formed in toddlerhood may continue into adulthood. Previous research also suggests that quality, variety, and nutrient intake during toddlerhood may directly result in cardiometabolic morbidity and mortality in adulthood [21, 22]. Therefore, food and drink intake among toddlers has important implications for health and well-being across the life course.
In previous studies of developing children, food insecurity has been associated with various indicators of poor diet quality, including inadequate intake of vegetables and fruit among children ages 3 or less [23]. Less is known, however, about associations with other specific food and drink items. Therefore, the primary objective of this study was to identify independent associations that exist between maternal food insecurity and intake of various foods and drinks among toddlers, including vegetables, fresh or canned fruit, candy or cookies, French fries, fast food, water, milk, fruit juices, fruit drinks, soda, and sports drinks. Additionally, we estimate the prevalence of maternal food insecurity, characterize food and drink intake during a typical week among toddlers of food insecure and food secure mothers, and characterize food, cash, and housing assistance program participation among food insecure mothers. We used population-based data collected from Oregon women with a live birth who were re-interviewed shortly after the child's second birthday.
Methods
Data Source and Study Population
This study is based on data from the 2006–2008 Oregon Pregnancy Risk Assessment Monitoring System follow-back survey (Oregon PRAMS-2) from mothers with a live birth originally interviewed in 2004–2005 Oregon Pregnancy Risk Assessment Monitoring Survey (Oregon PRAMS) and re-interviewed shortly after their child's second birthday. Conducted by the Oregon Public Health Division based on a stratified, random sample of Oregon resident women who delivered a live born infant, data from both Oregon PRAMS and Oregon PRAMS-2 are collected via mailed surveys and by telephone surveys of women who do not respond to the mailed survey. Birth certificates are the sampling frame with oversampling of racial/ethnic minority women and women who deliver a low birth weight infant. Responses are weighted for oversampling, nonresponse, and noncoverage to be representative of the state's entire population of mothers who deliver live born infants. Additional details about the general methodology of PRAMS are available elsewhere [24].
Oregon PRAMS-2 includes questions on maternal and child health, health-care access and utilization, health-related behaviors, and sociodemographic characteristics. The weighted response rate for Oregon PRAMS was 75.2 % and for Oregon PRAMS-2 was 43.5 % of the original Oregon PRAMS sample. Of the 1,911 Oregon PRAMS-2 participants, there were 1,880 mothers of live children. A total of 321 surveys were excluded because of missing data for the independent variable, control variables, and dependent variables. Four surveys were excluded because of missing data for the independent variable. Missing data for the dependent variables (1.8 % for intake of fast food to 5.8 % for intake of fruit drinks) and control variables (0 % for marital status to 8.0 % for poverty status) varied. To restrict the analyses and conclusions to children of adult mothers, 37 surveys of women aged <18 years were excluded because of concerns about generalizability. The final multivariable model included 1,522 mothers. The median child's age at time of Oregon PRAMS-2 survey completion was 2.1 years (interquartile range 2.0–2.1).
Study Variables
The primary independent variable for the study was maternal food security status. Oregon PRAMS-2 inquired about mother's food security status with the single question, “In the past 12 months, did you ever eat less than you felt you should because there wasn't enough money to buy food?” This state-developed question is based on the abbreviated 6-item food security module used by the USDA [6]. Mother's responses were dichotomized to food insecure or food secure.
The dependent variables for the study included typical weekly intake of vegetables, fresh or canned fruit, candy or cookies, French fries, fast food, water, milk, fruit juices, fruit drinks, soda, and sports drinks. Oregon PRAMS-2 inquired about typical weekly food and drink intake by asking the two questions, “How many days in a typical week does your two-year-old eat each of the foods listed below?” and “How many days in a typical week does your two-year-old drink the following drinks?” Responses to the questions about food and drink intake were classified into three categories and typical weekly intake frequency was coded as follows: 0–1 days/week, 2–3 days/week, and 4–7 days/week.
A range of control variables were included in our multivariable analysis. Potential confounders were identified a priori based upon previous studies of food insecurity [1, 4, 9]. Maternal age [18–24; 25–34; 35–55], foreign-born status (immigrant; US-born), race/ethnicity (White, non-Hispanic; Hispanic; Asian/Pacific Islander, non-Hispanic; Black, non-Hispanic; American Indian/Alaska Native, non-Hispanic), marital status (married; unmarried), education (<12th grade; 12th grade; >12th grade) poverty status (≤100 % of federal poverty level [FPL]; 100–185 % of FPL; >185 % of FPL) and depressive symptoms were included in the final adjusted models. FPL was determined by two questions. The first question asks the family's annual income. The second question asks for information on the number of people in the household. Each mother's poverty level was determined based on the US Department of Health and Human Services Poverty Guidelines. (http://aspe.hhs.gov/POVERTY/figures-fed-reg.shtml). FPL was based on income and household size at the time the mother completed the survey. Depressive symptoms was determined by the question, “In the past 12 months, has there been period of two or more weeks when almost every day you felt sad, blue or depressed for most of the day?” Control variables were collected by self-report from mothers in Oregon PRAMS-2, except for maternal age and race/ethnicity, which originated from the birth certificate.
Three additional variables were included in the descriptive analysis of food insecure mothers. Oregon PRAMS-2 inquired about the need and receipt of food, cash, and housing assistance in the past year with three questions concerning: Special Supplemental Nutrition Program for Women, Infants and Children (WIC) services; food stamps or money to buy food services from the Supplemental Nutrition Assistance Program (SNAP); and other financial assistance, such as cash assistance from Temporary Assistance for Needy Families (TANF) formerly known as Aid to Families with Dependent Children (AFDC) or housing assistance, such as subsidized rent. WIC and SNAP are two federally funded food assistance programs for families with young children. Responses to the questions about safety net program participation were classified as follows: no need, need and receipt, and need and no receipt.
Statistical Analysis
All analyses were conducted with survey procedures in SAS version 9.2 and the standard errors adjusted for the complex sampling survey design. We examined descriptive statistics regarding typical weekly food and drink intake of both toddlers of food insecure and food secure mothers and food, cash, and housing assistance program participation among food insecure mothers. To identify independent associations between food insecurity and typical weekly food and drink intake, we used separate polytomous logistic regression models to examine the crude and multivariable-adjusted associations for specific food and drink items. The categories of food and drink intake were compared with a reference of 0–1 days/week. The multivariable-adjusted models included maternal age, foreign-born status, race/ethnicity, marital status, education, poverty status, and depressive symptoms. Though we also examined associations using ordinal logistic regression, we do not present the results of those analyses because the proportional odds assumption did not hold. Nonetheless, the trends and significant associations were consistent.
Results
The prevalence of maternal food insecurity was 11.7 % among all mothers, while the prevalence of maternal food insecurity varied by selected maternal characteristics, including age, nativity, race/ethnicity, marital status, education, poverty status, and depressive symptoms, as shown in Table 1.
Table 1.
Distribution of maternal characteristics overall and prevalence of food insecurity by maternal characteristics, Oregon PRAMS-2 2006–2008
| Maternal characteristics | Total |
Food insecure |
|||
|---|---|---|---|---|---|
| Unweighted N | % | (95 % CI) | % | (95 % CI) | |
| Overall | 1,522 | 11.7 | (9.0, 14.5) | ||
| Age, years | |||||
| 18–24 | 387 | 27.1 | (23.5, 30.6) | 15.1 | (9.0, 21.3) |
| 25–34 | 866 | 59.2 | (55.5, 63.0) | 11.3 | (7.9, 14.7) |
| 35–55 | 269 | 13.7 | (11.3, 16.0) | 7.1 | (2.2, 12.1) |
| Nativity | |||||
| Non-US born | 403 | 21.5 | (19.0, 23.9) | 7.3 | (3.4, 11.1) |
| US born | 1,119 | 78.8 | (76.1, 81.0) | 13.0 | (9.7, 16.3) |
| Race/ethnicity | |||||
| White, non-Hispanic | 735 | 76.9 | (76.1, 77.6) | 11.9 | (8.5, 15.4) |
| Hispanic | 219 | 14.2 | (13.6, 14.9) | 10.8 | (6.4, 15.3) |
| Asian/Pacific Islander, non-Hispanic | 233 | 5.3 | (5.0, 5.5) | 5.8 | (2.5, 9.1) |
| Black, non-Hispanic | 151 | 2.1 | (1.9, 2.2) | 20.3 | (13.1, 27.5) |
| American Indian/Alaska Native, non-Hispanic | 184 | 1.5 | (1.4, 1.6) | 19.4 | (13.4, 25.3) |
| Marital status | |||||
| Married | 1,128 | 72.7 | (69.2, 76.2) | 7.4 | (4.9, 9.9) |
| Unmarried | 394 | 27.3 | (23.8, 30.8) | 23.3 | (16.4, 30.3) |
| Education | |||||
| <12th grade | 164 | 10.2 | (8.2, 12.2) | 8.8 | (2.7, 14.9) |
| 12th grade or GED | 315 | 23.9 | (20.4, 27.4) | 22.7 | (15.0, 30.3) |
| >12th grade | 1,043 | 65.9 | (62.2, 69.5) | 8.2 | (5.5, 11.0) |
| Poverty status | |||||
| ≤100 % of poverty level | 416 | 25.1 | (22.0, 28.4) | 25.4 | (18.2, 32.5) |
| 100–185 % of poverty level | 309 | 22.1 | (18.8, 25.4) | 14.0 | (7.8, 20.3) |
| >185 % of poverty level | 797 | 52.8 | (49.1, 56.5) | 4.3 | (1.9, 6.6) |
| Depressive symptoms | |||||
| No | 1,240 | 81.0 | (78.0, 84.0) | 8.0 | (5.4, 10.6) |
| Yes | 282 | 19.0 | (16.0, 22.0) | 27.8 | (19.5, 36.1) |
The percent distribution of typical weekly food and drink intake for toddlers of food secure mothers and toddlers of food insecure mothers is displayed in Fig. 1. The typical weekly intake of food varied for different items. Among toddlers of food insecure mothers, vegetables were the most consumed food during a typical week (72.6 % at 4–7 days/week) and French fries were the least consumed food during a typical week (6.1 % at 4–7 days/week). Similarly, among toddlers of food secure mothers, vegetables were the most consumed food during a typical week (80.6 % at 4–7 days/week) and French fries were the least consumed food during a typical week (4.1 % at 4–7 days/week). The typical weekly intake of drinks varied as well. Among toddlers of food insecure mothers, milk was the most consumed drink during a typical week (90.9 % at 4–7 days/week) and soda was the least consumed drink during a typical week (8.0 % at 4–7 days/week). Similarly, among toddlers of food secure mothers, milk was the most consumed drink during a typical week (92.0 % at 4–7 days/week) and soda was the least consumed drink during a typical week (3.0 % at 4–7 days/week).
Fig. 1.

Distribution of typical weekly food and drink intake for toddlers of food secure mothers and toddlers of food insecure mothers, Oregon PRAMS-2 2006–2008
Reported in Table 2 are results from the polytomous logistic regression models of the association between food insecurity and intake of food and drink items. Toddlers of food insecure mothers had a decreased odds of vegetable intake for 4–7 days/week (AOR 0.31; 95 % CI 0.12, 0.79) and a decreased odds of fruit intake for 4–7 days/week (AOR 0.25; 95 % CI 0.08, 0.75) compared with toddlers of food secure mothers. In this study, the odds of intake of candy or cookies, French fries, and fast food for 4–7 days/week, or for 2–3 days/week, compared with 0–1 days/week, was not different for toddlers of food insecure and food secure mothers. Conversely, toddlers of food insecure mothers had an increased odds of soda intake for 4–7 days/week (AOR 3.21; 95 % CI 1.12, 9.14) compared with toddlers of food secure mothers. In this study, the odds of intake of water, milk, fruit juices, fruit drinks, and sports drinks for 4–7 days/week, or for 2–3 days/week, compared with 0–1 days/week, was not different for toddlers of food insecure and food secure mothers.
Table 2.
Unadjusted and multivariable-adjusted odds ratios for food and drink intake among food secure mothers compared with that among toddlers of food insecure mothers, Oregon PRAMS-2 2006–2008
| 2–3 days/week |
4–7 days/week |
|||
|---|---|---|---|---|
| Unadjusted OR (95 % CI) | Adjusted ORb (95 % CI) | Unadjusted OR (95 % CI) | Adjusted ORb (95 % CI) | |
| Vegetables | ||||
| Food insecurea | 0.26 (0.09, 0.73) | 0.36 (0.12, 1.1) | 0.20 (0.09, 0.47) | 0.31 (0.12, 0.79) |
| Food secure | 1.0 | 1.0 | 1.0 | 1.0 |
| Canned or fresh fruit | ||||
| Food insecurea | 0.64 (0.20, 2.1) | 0.71 (0.20, 2.6) | 0.19 (0.07, 0.54) | 0.25 (0.08, 0.75) |
| Food secure | 1.0 | 1.0 | 1.0 | 1.0 |
| Candy or cookies | ||||
| Food insecurea | 0.70 (0.38, 1.3) | 0.81 (0.41, 1.6) | 0.45 (0.22, 0.92) | 0.53 (0.25, 1.1) |
| Food secure | 1.0 | 1.0 | 1.0 | 1.0 |
| French fries | ||||
| Food insecurea | 1.1 (0.59, 2.1) | 0.84 (0.41, 1.7) | 1.9 (0.60, 6.2) | 0.85 (0.25, 2.9) |
| Food secure | 1.0 | 1.0 | 1.0 | 1.0 |
| Fast food | ||||
| Food insecurea | 0.89 (0.50, 1.6) | 0.96 (0.51, 1.8) | 1.5 (0.50, 4.6) | 1.1 (0.32, 3.6) |
| Food secure | 1.0 | 1.0 | 1.0 | 1.0 |
| Water | ||||
| Food insecurea | 0.60 (0.14, 2.5) | 0.83 (0.16, 4.2) | 0.42 (0.13, 1.4) | 0.72 (0.19, 2.7) |
| Food secure | 1.0 | 1.0 | 1.0 | 1.0 |
| Milk | ||||
| Food insecurea | 1.5 (0.26, 8.6) | 1.0 (0.15, 6.6) | 0.76 (0.19, 3.0) | 0.67 (0.12, 2.6) |
| Food secure | 1.0 | 1.0 | 1.0 | 1.0 |
| Fruit juices | ||||
| Food insecurea | 1.3(0.45, 3.8) | 0.76 (0.24, 2.4) | 1.7 (0.70,4.1) | 0.83 (0.32, 2.2) |
| Food secure | 1.0 | 1.0 | 1.0 | 1.0 |
| Fruit drinks | ||||
| Food insecurea | 1.5 (0.76, 3.2) | 0.85 (0.38, 1.9) | 2.6 (1.2, 5.4) | 1.6 (0.72, 3.6) |
| Food secure | 1.0 | 1.0 | 1.0 | 1.0 |
| Soda | ||||
| Food insecurea | 2.3 (1.2, 4.6) | 1.9 (0.92, 3.9) | 4.5 (1.7, 12.4) | 3.2 (1.1, 9.1) |
| Food secure | 1.0 | 1.0 | 1.0 | 1.0 |
| Sports drinks | ||||
| Food insecurea | 1.5 (0.72, 3.2) | 0.94 (0.42, 2.1) | 1.8 (0.79, 4.2) | 1.1 (0.41, 2.9) |
| Food secure | 1.0 | 1.0 | 1.0 | 1.0 |
Reference categories for logistic regression models are food secure status and 0–1 days/week
In addition to the covariates presented, all adjusted models included maternal age, nativity, race/ethnicity, marital status, education, poverty status, and depressive symptoms
The frequency of food, cash, and housing assistance program participation among food insecure mothers is shown in Fig. 2. Overall, 19.5 % of food insecure mothers reported not needing to participate in WIC, 15.7 % of food insecure mothers reported no need for SNAP, and 51.2 % of food insecure mothers reported no need for cash or housing assistance. Nearly two-thirds (64.6 %) of food insecure mothers reported need and receipt of WIC, 48.1 % of food insecure mothers reported need and receipt of SNAP, and 18.3 % of food insecure mothers reported need and receipt of cash or housing assistance programs. Lastly, 16.0 % of food insecure mothers reported need and no receipt of WIC, 36.2 % of food insecure mothers reported need and no receipt of SNAP, and 30.5 % of food insecure mothers reported need and no receipt of cash or housing assistance programs.
Fig. 2.
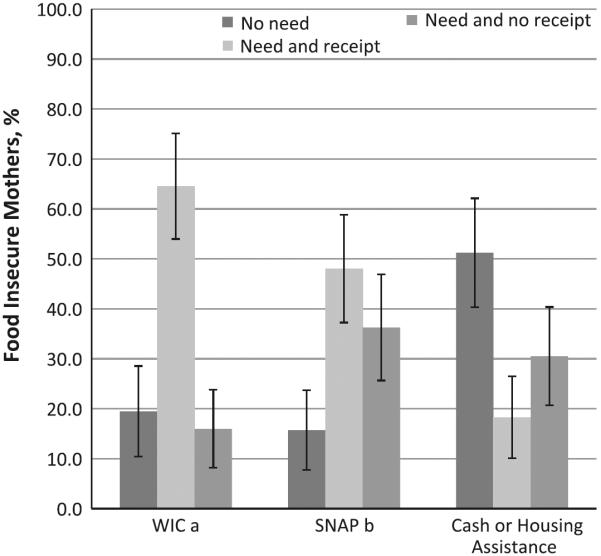
Distribution of food, cash, and housing assistance program participation among food insecure mothers, Oregon PRAMS-2 2006–2008. aSpecial Supplemental Nutrition Program for Women, Infants and Children, bSupplemental Nutrition Assistance Program
Discussion
This study has two major findings. First, in the final multivariable-adjusted models, three independent associations were observed between food insecurity and food and drink intake. Toddlers of food insecure mothers were found to have decreased odds of vegetable intake for 4–7 days/week, decreased odds of fruit intake for 4–7 days/week, and increased odds of soda intake for 4–7 days/week. These associations were independent of maternal age, foreign-born status, race/ethnicity, marital status, education, poverty status, and depressive symptoms. Second, the frequency of food insecure mothers in this study self-reporting participation in WIC, SNAP, and cash or housing assistance programs ranged from 64.6 % for WIC to 18.3 % for cash or housing assistance. Collectively, these findings highlight the magnitude and potential influence of food insecurity on dietary intake during toddlerhood and the sizeable involvement of food insecure families in food, cash, and housing assistance programs.
The results of several studies examining the association between food insecurity and dietary intake across various stages of childhood were consistent with our own. In a nationally representative study of children ages 0–17 in the United States, children in low-income, food insecure families consumed less fruits, fewer calories and total carbohydrates compared with children in higher-income, food secure families. This is further supported by a study using the Canadian Community Health Survey in which researchers observed that fewer servings of vegetables and fruit were consumed by children ages 3 or less and fewer servings of nutrients, such as protein, vitamin A, vitamin B, magnesium, phosphorus, and zinc were consumed by children ages 9–18 [23]. Additionally, in a convenience sample of Mexican–American children ages 3–6, children in food insecure families were less likely to meet USDA Food Guide Pyramid guidelines [1]. In at least two other studies of infants and toddlers, food insecurity has been shown to be associated with iron deficiency anemia [25, 26]. These consistent and significant associations between food insecurity and indicators of diet quality across participants and settings of the studies described previously suggest that food and drink intake is a critical pathway linking food insecurity and poor health and is a potential avenue for intervention.
There are a range of explanations for the observed associations between maternal food insecurity and consumption of fewer vegetables and fruit, and more soda among toddlers in Oregon. Previous studies suggest that contextual factors at the state- and county-level may influence prevalence and family experience of food security, these contextual factors include the cost of housing and energy, increases in unemployment, variation in household income [7, 8, 27], and availability and utilization of food, cash, and housing assistance programs [28]. This is especially relevant since the majority of food insecure mothers self-reported participation in a safety net program for low-income families. Participation in these programs may be especially beneficial to food insecure families with developing children, but may still be insufficient in helping families to eliminate food insecurity. Another potential contextual factor that may help explain the observed associations is inadequate availability and affordability of nutritious foods in communities. Reduced intake of healthy foods, such as vegetables and fruit may be due to limited access to supermarkets, as is often the case of “food deserts” [29, 30]. Contextual factors such as these shape communities where families live and consequently their dietary intake [31]. Consequently, as a result of these material circumstances, the barriers to making healthy food and drink choices may be intractable for food insecure families, especially because the prices for vegetables and fruit are less elastic than soda and some other foods and also because high caloric and energy dense foods and drinks are often more affordable [32].
This study has some limitations that should be acknowledged. First, food insecurity was measured using a single item question, which may not capture the latent construct as precisely as the standard 18-item or abbreviated 6-item food security modules used by the USDA [6]. Second, rather than the number of daily servings, we examined typical weekly food and drink intake as the outcomes in this study. Therefore, we are unable to make generalizations regarding the Department of Health and Human Services and USDA dietary guidelines [33]. This study has strengths that should also be acknowledged. First, PRAMS-2 is a population-based sample and collected from the state's population of mothers and toddlers. Therefore, these results may be generalized to children born in Oregon between 2004 and 2005. Second, these findings rely upon state-specific data that are potentially useful for local action at the state- and county-level.
The results of this study augment a growing literature of observational studies on food insecurity and poor nutrition. This evidence concerning the adverse impact of food insecurity on mental, physical, and behavioral health signifies a need for intervention strategies aimed at eliminating food insecurity and improving access to a healthy diet. In particular, the observed independent associations between maternal food insecurity and intake of vegetables, fruit, and soda in this study may represent critical pathways linking food insecurity to health during toddlerhood, a sensitive period in human development. Because of the importance of nutritious food availability and affordability to development, enhancing access to vegetables and fruit should be integral to future intervention strategies for food insecure families in Oregon. Given the importance of contextual factors and sizeable involvement of food insecure families in food, cash, and housing assistance programs, intervention strategies may benefit from engagement from various sectors at the state- and county-level, especially the Oregon Department of Human Services and Oregon Public Health Division because these organizations are the primary providers of safety net programs, and partner organizations, such as the Oregon Hunger Relief Task Force, Oregon Food Bank, and Oregon Pediatric Society.
Acknowledgments
CDC Disclaimer: The findings and conclusions in this report are those of the authors and do not necessarily represent the official position of the Centers for Disease Control and Prevention.
References
- 1.Kaiser LL, Melgar-Quinonez HR, Lamp CL, et al. Food security and nutritional outcomes of preschool-age Mexican-American children. Journal of the American Dietetic Association. 2002;102:924–929. doi: 10.1016/s0002-8223(02)90210-5. [DOI] [PubMed] [Google Scholar]
- 2.Matheson DM, Varady J, Varady A, et al. Household food security and nutritional status of Hispanic children in the fifth grade. American Journal of Clinical Nutrition. 2002;76:210–217. doi: 10.1093/ajcn/76.1.210. [DOI] [PubMed] [Google Scholar]
- 3.Ahluwalia IB, Dodds JM, Baligh M. Social support and coping behaviors of low-income families experiencing food insufficiency in North Carolina. Health Education & Behavior. 1998;25:599–612. doi: 10.1177/109019819802500507. [DOI] [PubMed] [Google Scholar]
- 4.Chilton M, Black MM, Berkowitz C, et al. Food insecurity and risk of poor health among US-born children of immigrants. American Journal of Public Health. 2009;99:556–562. doi: 10.2105/AJPH.2008.144394. [DOI] [PMC free article] [PubMed] [Google Scholar]
- 5.Council NR, editor. Food insecurity and hunger in the United States: An assessment of the measure. The National Academies Press; Washington, DC: 2006. [Google Scholar]
- 6.Nord M, Andrews M, Carlson S. Household Food Security in the United States, 2008. United States Department of Agriculture; Washington, D.C.: 2009. Economic Research Service. ERR- 83. [Google Scholar]
- 7.Edwards ME, Weber B, Bernell S. Identifying factors that influence state-specific hunger rates in the US: A simple analytic method for understanding a persistent problem. Social Indicators Research. 2007;81:579–595. [Google Scholar]
- 8.Bernell SL, Weber BA, Edwards ME. Restricted opportunities, personal choices, ineffective policies: What explains food insecurity in Oregon? Journal of Agricultural and Resource Economics. 2006;31:193–211. [Google Scholar]
- 9.Alaimo K, Olson CM, Frongillo EA., Jr. Food insufficiency and American school-aged children's cognitive, academic, and psychosocial development. Pediatrics. 2001;108:44–53. [PubMed] [Google Scholar]
- 10.Casey PH, Szeto K, Lensing S, et al. Children in food-insufficient, low-income families: prevalence, health, and nutrition status. Archives of Pediatrics and Adolescent Medicine. 2001;155:508–514. doi: 10.1001/archpedi.155.4.508. [DOI] [PubMed] [Google Scholar]
- 11.Slopen N, Fitzmaurice G, Williams DR, et al. Poverty, food insecurity, and the behavior for childhood internalizing and externalizing disorders. Journal of the American Academy of Child and Adolescent Psychiatry. 2010;49:444–452. doi: 10.1097/00004583-201005000-00005. [DOI] [PubMed] [Google Scholar]
- 12.Zaslow M, Bronte-Tinkew J, Capps R, et al. Food security during infancy: Implications for attachment and mental proficiency in toddlerhood. Maternal and Child Health Journal. 2009;13:66–80. doi: 10.1007/s10995-008-0329-1. [DOI] [PubMed] [Google Scholar]
- 13.Ashiabi GS, O'Neal KK. A framework for understanding the association between food insecurity and children's developmental outcomes. Child Development Perspectives. 2008;2:71–77. [Google Scholar]
- 14.Frank DA, Neault NB, Skalicky A, et al. Heat or eat: The low income home energy assistance program and nutritional and health risks among children less than 3 years of age. Pediatrics. 2006;118:e1293–e1302. doi: 10.1542/peds.2005-2943. [DOI] [PubMed] [Google Scholar]
- 15.Cook JT, Frank DA, Berkowitz C, et al. Food insecurity is associated with adverse health outcomes among human infants and toddlers. Journal of Nutrition. 2004;134:1432–1438. doi: 10.1093/jn/134.6.##. [DOI] [PubMed] [Google Scholar]
- 16.Whitaker RC, Phillips SM, Orzol SM. Food insecurity and the risks of depression and anxiety in mothers and behavior problems in their preschool-aged children. Pediatrics. 2006;118:e859–e868. doi: 10.1542/peds.2006-0239. [DOI] [PubMed] [Google Scholar]
- 17.Rosales FJ, Reznick JS, Zeisel SH. Understanding the role of nutrition in the brain and behavioral development of toddlers and preschool children: identifying and addressing methodological barriers. Nutritional Neuroscience. 2009;12:190–202. doi: 10.1179/147683009X423454. [DOI] [PMC free article] [PubMed] [Google Scholar]
- 18.May AL, Dietz WH. The Feeding Infants and Toddlers Study 2008: Opportunities to assess parental, cultural, and environmental influences on dietary behaviors and obesity prevention among young children. Journal of the American Dietetic Association. 2010;110:S11–S15. doi: 10.1016/j.jada.2010.09.006. [DOI] [PubMed] [Google Scholar]
- 19.Savage JS, Fisher JO, Birch LL. Parental influence on eating behavior: Conception to adolescence. Journal of Law, Medicine & Ethics. 2007;35:22–34. doi: 10.1111/j.1748-720X.2007.00111.x. [DOI] [PMC free article] [PubMed] [Google Scholar]
- 20.Rosales FJ, Zeisel SH. Perspectives from the symposium: The role of nutrition in infant and toddler brain and behavioral development. Nutritional Neuroscience. 2008;11:135–143. doi: 10.1179/147683008X301522. [DOI] [PMC free article] [PubMed] [Google Scholar]
- 21.Ness AR, Maynard M, Frankel S, et al. Diet in childhood and adult cardiovascular and all cause mortality: The Boyd Orr cohort. Heart. 2005;91:894–898. doi: 10.1136/hrt.2004.043489. [DOI] [PMC free article] [PubMed] [Google Scholar]
- 22.Law M. Dietary fat and adult diseases and the implications for childhood nutrition: An epidemiologic approach. American Journal of Clinical Nutrition. 2000;72:1291S–1296S. doi: 10.1093/ajcn/72.5.1291s. [DOI] [PubMed] [Google Scholar]
- 23.Kirkpatrick SI, Tarasuk V. Food insecurity is associated with nutrient inadequacies among Canadian adults and adolescents. Journal of Nutrition. 2008;138:604–612. doi: 10.1093/jn/138.3.604. [DOI] [PubMed] [Google Scholar]
- 24.Shulman HB, Gilbert BC, Msphbrenda CG, et al. The pregnancy risk assessment monitoring system (PRAMS): Current methods and evaluation of 2001 response rates. Public Health Reports. 2006;121:74–83. doi: 10.1177/003335490612100114. [DOI] [PMC free article] [PubMed] [Google Scholar]
- 25.Park K, Kersey M, Geppert J, et al. Household food insecurity is a risk factor for iron-deficiency anaemia in a multi-ethnic, low-income sample of infants and toddlers. Public Health Nutrition. 2009;12:2120–2128. doi: 10.1017/S1368980009005540. [DOI] [PubMed] [Google Scholar]
- 26.Skalicky A, Meyers AF, Adams WG, et al. Child food insecurity and iron deficiency anemia in low-income infants and toddlers in the United States. Maternal and Child Health Journal. 2006;10:177–185. doi: 10.1007/s10995-005-0036-0. [DOI] [PubMed] [Google Scholar]
- 27.Rose D. Economic determinants and dietary consequences of food insecurity in the United States. Journal of Nutrition. 1999;129:517S–520S. doi: 10.1093/jn/129.2.517S. [DOI] [PubMed] [Google Scholar]
- 28.Borjas GJ. Food insecurity and public assistance. Journal of Public Economics. 2004;88:1421–1443. [Google Scholar]
- 29.Beaulac J, Kristjansson E, Cummins S. A systematic review of food deserts, 1966–2007. Preventing Chronic Disease. 2009;6:A105. [PMC free article] [PubMed] [Google Scholar]
- 30.Wrigley N. `Food deserts' in British cities: Policy context and research priorities. Urban Studies. 2002;39:2029–2040. [Google Scholar]
- 31.Berkman LF, Kawachi I. Social epidemiology. Oxford University Press; New York: 2000. [Google Scholar]
- 32.Andreyeva T, Long MW, Brownell KD. The impact of food prices on consumption: A systematic review of research on the price elasticity of demand for food. American Journal of Public Health. 2010;100:216–222. doi: 10.2105/AJPH.2008.151415. [DOI] [PMC free article] [PubMed] [Google Scholar]
- 33.United States . Report of the Dietary Guidelines Advisory Committee on the dietary guidelines for Americans, 2010 : To the Secretary of Agriculture and the Secretary of Health and Human Services. United States Department of Agriculture, United States Department of Health and Human Services; Washington, D.C.: 2010. Department of Agriculture. Human Nutrition Information Service. Dietary Guidelines Advisory Committee., United States. Agricultural Research Service. [Google Scholar]