

Abstract
The identification of diagnostic markers and therapeutic candidate genes in common diseases is complicated by the involvement of thousands of genes. We hypothesized that genes co-regulated with a key gene in allergy, IL13, would form a module that could help to identify candidate genes. We identified a T helper 2 (TH2) cell module by small interfering RNA–mediated knockdown of 25 putative IL13-regulating transcription factors followed by expression profiling. The module contained candidate genes whose diagnostic potential was supported by clinical studies. Functional studies of human TH2 cells as well as mouse models of allergy showed that deletion of one of the genes, S100A4, resulted in decreased signs of allergy including TH2 cell activation, humoral immunity, and infiltration of effector cells. Specifically, dendritic cells required S100A4 for activating T cells. Treatment with an anti-S100A4 antibody resulted in decreased signs of allergy in the mouse model as well as in allergen-challenged T cells from allergic patients. This strategy, which may be generally applicable to complex diseases, identified and validated an important diagnostic and therapeutic candidate gene in allergy.
INTRODUCTION
Genomic high-throughput studies have shown that complex diseases are associated with altered interactions between thousands of genes, of which the majority have only small individual effects (1). This makes the prioritization of diagnostic and therapeutic candidate genes for functional and clinical studies a formidable challenge. Here, we present a module-based, translational strategy to address this challenge. The strategy is based on the concept that, when mapped on the human protein-protein network, disease-associated genes tend to form modules, for example, groups of genes that are more interconnected than surrounding genes, and also more functionally related (2–5). The examination of gene modules may facilitate prioritization as it reduces the number of candidate genes, and these genes are likely to be more relevant for the disease than extramodular genes. In landmark studies, module-based approaches have been used to identify a candidate gene associated with breast cancer risk (6) and to subtype autoimmune diseases (7). In the latter case, almost 2000 genes differed in expression between the subtypes. The clinical translation of module-based approaches has been complicated not only by the large number of genes but also by the heterogeneity of complex diseases and the involvement of many different cell types, some of which may not be known or difficult to obtain from patients. Another problem is methodological limitations in the construction of gene modules. For example, if modules are constructed by mapping disease-associated genes on a protein-protein interaction (PPI) network, the interactions may differ in different cell types.
The aim of our study was to test if a translational module-based approach could identify candidate genes with diagnostic and therapeutic potential. Our approach combined genomic, bioinformatics, functional, diagnostic, and therapeutic studies. We analyzed CD4+ T cells from patients with seasonal allergic rhinitis (SAR), which is an optimal disease model because of its well-defined phenotype and pathogenesis. The external trigger (pollen) is known and can be used to challenge CD4+ T cells from allergic patients in vitro. These cells can be analyzed with gene expression microarrays and the candidate genes examined functionally and as therapeutic targets in T helper 2 (TH2)–polarized cells as well as in a mouse model of allergy. Potential diagnostic markers can be analyzed in nasal fluids from patients and healthy controls during the pollen season. We have previously defined modules in SAR by mapping differentially expressed genes from profiling studies on the human PPI network (8–12). Here, however, we defined a gene module by searching for genes co-regulated by the same transcription factors (TFs) as a key cytokine in allergy, interleukin-13 (IL-13) (13). The background to this approach was the observation that genes causing the same disease tend to be co-regulated by the same TFs and form modules of functionally related genes (14–17). Although its functions overlap with other cytokines, such as IL-4, IL-13 was chosen because it regulates immunoglobulin E (IgE) synthesis, airway hyper-secretion, eosinophil infiltration, and mast cell proliferation (18–21), and promising results have been observed in studies that therapeutically target either IL-13 or its receptors in allergic patients (18, 22, 23). However, the identification of a module of genes co-regulated with IL13 is complicated by the thousands of genes that change expression in T cells after allergen challenge or TH2 polarization, of which a large portion is coexpressed with IL13 (10, 24). We present an analytical strategy to identify such a module and diagnostic and therapeutic candidate genes. Specifically, we found that S100A4 has a pivotal role in allergy and is a potential diagnostic and therapeutic target. We propose that the strategy may be generally applicable to complex diseases.
RESULTS
Genes that are co-regulated with IL13 formed a module in TH2-polarized cells, which overlapped with differentially expressed genes in CD4+ T cells from allergic patients
An outline of the study is given in Fig. 1. We started by defining TFs known to regulate IL-13 based on the literature, namely, GATA2, cJUN, MAF, NFATC3, and GATA3 (25–28), and other putative IL-13–regulating TFs by combining bioinformatics predictions and gene expression microarray data from allergen-challenged CD4+ T cells. This resulted in 25 candidate TFs (table S1). To identify an optimal time point for small interfering RNA (siRNA)–mediated knockdown, we analyzed the median mRNA expression of the 25 candidate TFs in human total CD4+ T cells that were polarized toward TH2 for 0, 6, 48, and 96 hours with gene expression microarrays. Sixteen hours of polarization was chosen on the basis of the median expression levels of the TFs at different time points, as well as the kinetics of IL13 (Supplementary Materials and fig. S1). Because siRNAs may induce nonspecific activation of interferon (IFN) signaling, we quantified the expression of genes involved in the IFN signaling system, namely, OAS1, TLR3, TLR7, and TLR8, by quantitative polymerase chain reaction (qPCR) after transfection with the siRNAs (29). We found no increase in the expression of these genes (fig. S2). Fluorescence microscopy revealed that 7 of 10 cells were transfected with a Cy3-labeled negative control siRNA (Supplementary Materials and fig. S3). These results demonstrated that our siRNA system was suitable to detect the involvement of known and unknown genes in the regulation of TH2 cytokines.
Fig. 1. Overview of the study, which aimed to identify disease-relevant diagnostic and therapeutic candidate genes in allergy.

(A) Twenty-five putative IL13-regulating TFs were identified by combining data from mRNA microarrays, sequence-based predictions, and the literature. (B) IL13-regulating TFs were validated by siRNA-mediated knockdown of the 25 TFs in human total CD4+ T cells polarized toward TH2 using IL13 as a readout. The target genes of the TFs were identified by combined siRNA knockdown of the positively screened TFs/known IL-13–regulating TFs from literature and microarray analyses. This resulted in a module of genes that was co-regulated with IL13 in TH2-polarized cells and significantly overlapped with differentially expressed genes from allergen-challenged T cells from allergic patients. For further validation experiments, we focused on module genes that encoded secreted proteins and had not been previously associated with allergy. (C) Functional, diagnostic, and therapeutic studies involving S100A4 were performed in patients with SAR, allergic dermatitis, and a mouse model of allergy.
The siRNA screen was performed in three technical replicates for each TF, which identified 7 of the 25 TFs as potential regulators of IL13 expression, namely, FOS, GATA1, NFKB1, STAT3, NFATC1, RELA, and STAT6 (table S2). We focused on these seven TFs and one TF for which the knockdown in screening did not succeed for technical reasons (ELK1), as well as four TFs that had been described as IL13 regulators in the literature (NFATC3, MAF, cJUN, and GATA3). We repeated the knockdowns of these 12 TFs in five biological replicates, which resulted in 7 TFs for which the knockdowns had significant effects on IL13 expression, namely, STAT3, NFKB1, ELK1, NFATC3, MAF, cJUN, and GATA3 (fig. S4, A and B). Next, we performed gene expression microarray analyses of human TH2-polarized CD4+ cells before and after knockdown of the TFs. The knockdowns resulted in altered expression of genes that were involved in pathways such as “altered T cell and B cell signaling,” “T helper cell differentiation,” and “CD28 signaling in T helper cells” (tables S3 to S5). To analyze these seven sets of differentially expressed genes in a comprehensive way, we mapped them on the human PPI network (Supplementary Materials). In keeping with previous studies, we found that the differentially expressed genes colocalized in the PPI network. This allowed us to identify a network module of genes that are co-regulated with IL13, as well as their close interactors. The genes in the module overlapped significantly with gene expression changes in allergen-challenged CD4+ cells from patients with SAR (2.11-fold enrichment; P = 0.003, Fisher’s exact test). The module contained several pathways and genes of known relevance for allergy and TH cell differentiation, such as IFNG, IL12, IL4, IL5, IL13, and their receptors, as well as candidate genes (table S6). To identify a candidate gene that was also a potential diagnostic marker, we selected genes with potential extracellular protein products, because they would be more likely to be detectable in body fluids. These genes formed a highly interconnected submodule (fig. S5 and table S7). We focused on one of the genes that showed the largest change, S100A4. This gene has pleiotropic roles in cell differentiation and recruitment of inflammatory cells (30). However, it has not been previously studied in allergy and TH2 differentiation. S100A4 was highly expressed in CD4+ T cells, as well as in other cells of potential relevance for allergy, including CD8+ T cells, B cells, monocytes, and eosinophils (fig. S6). In support of the relevance of S100A4 for allergy, we found that transfection with S100A4-specific siRNA led to decreased mRNA expression of TH2 cytokines in human TH2-polarized cells. A 2.2-fold decrease in S100A4 (P = 0.019, t test) resulted in a 2-fold decrease in IL5 (P = 0.029, t test) as well as a 2.6-fold decrease in IL13 expression (P = 0.0021, t test) (fig. S4, C to E). Furthermore, human CD4+ T cells showed increased production of IL-13 protein after treatment with recombinant S100A4 (fig. S7A).
S100A4−/− mice are protected from allergic inflammation
Because S100A4 was increased in allergen-challenged T cells and was involved in TH2 activation, we proceeded with functional studies in a mouse model of allergy. Mouse naïve T cells produced higher levels of IL-13 and IL-6 after stimulation with recombinant S100A4 (fig. S7, B and C). We next speculated that mice deficient in S100A4 would exhibit an altered allergic response compared with wild-type mice. S100A4−/− mice have been reported previously (30). We compared certain features of the wild-type and S100A4−/− mice, including body weight, spleen weight, and the major immune cell composition [CD4 and CD8 T cells, B cells, and dendritic cells (DCs)] in the spleens and the mesenteric lymph nodes. No differences were observed between S100A4+/+ and S100A4−/− animals (fig. S8). Next, we used a mouse TH2-polarized skin provocation model, which bears similarities to the immunological and clinical manifestations of atopic dermatitis in humans (31). Mice were immunized with ovalbumin (OVA) in Alum, a well-characterized TH2-polarizing sensitization (32), followed by challenge in the ear with OVA, which resulted in a typical allergic inflammation. S100A4-deficient mice showed suppressed responses to challenge with OVA. Ear swelling was reduced by more than 70% in S100A4−/− mice compared with wild-type controls (Fig. 2A). The reduced ear swelling was associated with decreased effector cell numbers in the ear and draining lymph nodes, serum OVA-specific antibody levels, and T cell memory responses. Specifically, reduced infiltration of eosinophils, neutrophils, and DCs was observed in the provoked ears of the S100A4−/− mice (Fig. 2B). The recruitment of CD8+ T cells, which contributes to tissue damage, was also compromised in S100A4−/− mice (Fig. 2B). No difference in CD4+ T cell infiltration was observed between S100A4+/+ and S100A4−/− mice (Fig. 2B). The severity of the dermatological inflammatory reaction can also be reflected in the recruitment of inflammatory cells to the cervical lymph nodes (CLNs) that drain the area of provocation. As shown in Fig. 2C, the recruitment of CD4+ and CD8+ T cells, neutrophils, and DCs to the CLNs 24 hours after challenge was lower in S100A4-deficient mice compared to wild-type mice. Furthermore, mouse ear tissue sectioning and staining by hematoxylin and eosin demonstrated reduced leukocyte infiltration in S100A4−/− mice after challenge (fig. S9). Similar to the mice that were deficient in S100A4 protein, mice treated with an S100A4-blocking antibody (fig. S10) demonstrated compromised allergic ear inflammation, evidenced by reduced ear thickness (Fig. 2D). A trend of reduced DC levels in the ear was also noticed after antibody treatment. Together, these data suggest that S100A4 plays a critical role in leukocyte recruitment and migration both at the effector site (ear) and at the regulatory site (draining lymph nodes) after intradermal allergen provocation.
Fig. 2. Deleting S100A4 gene or blocking S100A4 protein protects mice from allergic dermatitis.

S100A4+/+ and S100A4−/− mice were immunized intraperitoneally with OVA in Alum four times with a 1-week interval. One week after the final immunization, mice were injected intradermally with OVA in one ear and PBS in the other as control. P values were calculated using unpaired two-tailed Student’s t test. (A) The allergic inflammation was determined by measuring the thickness of the OVA-challenged ear subtracted by that of the control ear 24 hours after the challenge. (B) Mice were sacrificed, and single-cell suspensions were prepared from the challenged ears to determine by flow cytometry the infiltration of neutrophils, DCs, eosinophils, CD8+ T cells, and CD4+ T cells. (C) Single-cell suspensions were prepared from the draining CLNs. Percentages of CD4+ T cells, CD8+ T cells, neutrophils, and DCs in the CLNs were measured by flow cytometry. (D) Some mice were treated with S100A4-specific blocking antibodies in comparison with PBS and isotype control antibody before measurement of ear thickness as explained in (A). Each dot represents data from a single mouse.
We also observed a reduced humoral immune response in S100A4−/− mice because serum levels of OVA-specific IgG were lower than those of wild-type mice after immunization (Fig. 3A). Anti-S100A4 antibody treatment also attenuated OVA-specific IgG levels [4.10 ± 0.08 and 3.44 ± 0.15 (log10), for control and anti-S100A4 treatment, respectively; P = 0.0022, t test]. An analysis of the IgG subtypes revealed that the major component of the IgG response was IgG1 but not IgG2a (Fig. 3A). IgG1 is an IgG subclass that is produced by TH2 pathways, whereas IgG2a represents a typical TH1-mediated immune response (33, 34). Therefore, reduced antigen-specific IgG1 production in S100A4−/− mice is consistent with a role for S100A4 in TH2 responses. A trend of lower antigen-specific IgE levels was found in S100A4−/− mice, although this did not reach statistical significance (Fig. 3A). Last, ex vivo T cell memory response as a result of antigen reencounter was suppressed in S100A4−/− mice compared to wild-type controls (Fig. 3B), which provides a mechanistic explanation for the reduced antigen-specific serum antibody responses. Furthermore, lower levels of the TH2 cytokines IL-13 and IL-6 were observed in the supernatants of restimulated splenocytes from S100A4−/− mice (Fig. 3C). Secretion of IL-17A, a cytokine that has been recently implicated in allergy (35), was substantially reduced in the S100A4−/− culture (Fig. 3C). Although there was a trend for reduced IFN-γ secretion from S100A4−/− splenocytes, this did not reach statistical significance (Fig. 3C). Similar levels of IL-10, IL-5, TNF-α (tumor necrosis factor–α), and IL-22 were observed in both wild-type and S100A4−/− cultures (fig. S11). Next, we tested whether S100A4−/− mice could be protected also in the contact hypersensitivity reaction, because allergic contact hypersensitivity is dependent on IL-6 and IL-17 (36) and both cytokines were reduced in S100A4−/− T cells after antigen reencounter (Fig. 3C). Indeed, the knockout mice demonstrated reduced ear swelling after sensitization and challenge by topical administration of oxazolone (fig. S12). Together, these findings strongly support a crucial role for S100A4 in TH2-polarized atopic dermatitis and also indicate that S100A4 is a therapeutic target gene in allergy.
Fig. 3. Antigen-specific serum responses and T cell memory response of S100A4+/+ and S100A4−/− mice after allergic sensitization.

Mice were sensitized and challenged as described in Fig. 2. P values were calculated using unpaired two-tailed Student’s t test. (A) Blood was collected 24 hours after the challenge. The serum levels of anti-OVA IgG, anti-OVA IgG1, anti-OVA IgG2a, and anti-OVA IgE were determined by enzyme-linked immunosorbent assay (ELISA). (B and C) Mice were sacrificed 24 hours after the challenge, and single-cell suspensions from the spleens were prepared and incubated at 4 × 10⁵ cells per well with OVA for 3 days. T cell proliferation as a result of antigen restimulation was measured by thymidine incorporation (B). Cytokines released into the supernatant were measured by cytometric bead array (C). Data represent measurements from 11 (S100A4+/+) and 5 (S100A4−/−) mice (A and C) or from 18 (S100A4+/+) and 12 (S100A4−/−) mice (B).
T cell activation as a result of interaction between T cells and antigen-presenting cells such as DCs is a critical step in allergic sensitization. During this interaction, DC not only presents the antigen peptides but also supplies T cells with activation signals. However, S100A4−/− DCs failed to activate T cells to the same extent as DCs from wild-type mice (Fig. 4). The addition of recombinant human S100A4 to the S100A4−/− DC culture partially restored their T cell–activating capacity (Fig. 4), which also suggests that DCs may be one of the cellular targets of S100A4 in addition to T cells (fig. S7).
Fig. 4. DCs from S100A4−/− mice demonstrate a reduced capacity for stimulating T cells.
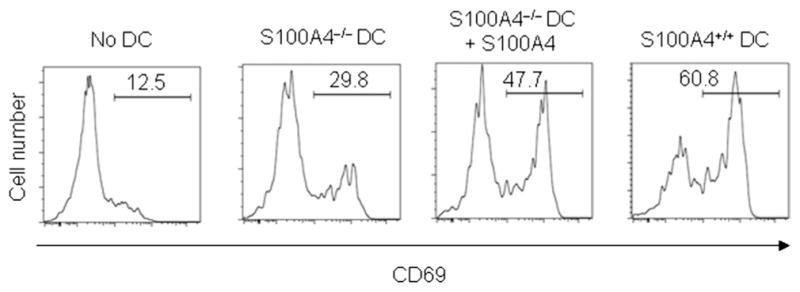
Purified CD11c+ DCs (2 × 10⁴ cells per well) from naïve mice either sufficient or deficient in S100A4 were incubated with OVA in the presence or absence of S100A4 (1 μg/ml) for 2 hours. After being washed, DCs were mixed with CD4+ T cells (2 × 10⁵ cells per well) from OT-II mice and incubated for 72 hours. The activation status of OT-II T cells was determined by CD69 expression.
The expression of S100A4 is increased in patients with SAR and allergic dermatitis
To assess the relevance of S100A4 to allergic rhinitis in humans, we measured protein levels in the nasal fluids and medium supernatants from allergen-challenged cells from patients with SAR, as well as from healthy controls. We found that S100A4 levels were fivefold higher in nasal fluids from allergy patients compared to healthy controls. S100A4 increased from 13 ng/ml in controls to 63 ng/ml in patients (P = 0.025, t test). Similarly, S100A4 levels increased in supernatants from allergen-challenged CD4+ cells, from 88 ng/ml in controls to 202 ng/ml in patients with SAR (P = 0.029, t test) (Fig. 5, A and B). This was associated with increased levels of both IL-5 and IL-13 (Fig. 5, C and D). In addition, S100A4 levels in nasal fluids showed a modest but significant Pearson correlation with disease severity in 42 patients (symptom scores, r = 0.29; P = 0.03, right-tailed). Treatment with a neutralizing S100A4 antibody supported the mouse data, indicating that S100A4 is a therapeutic candidate in allergy: The release of IL-5 and IL-13 in supernatants of peripheral blood mononuclear cells (PBMCs) from allergic patients that have been challenged with birch pollen and a neutralizing S100A4 antibody was significantly lower than that in PBMCs challenged only with birch pollen. For IL-5, we found a decrease of 60% (P = 0.031, Wilcoxon rank-sum test), and for IL-13, a reduction of 52% (P = 0.004, Wilcoxon rank-sum test) of released protein after antibody treatment (Fig. 5, E and F). In addition to S100A4, we also examined the protein levels of two other genes in the module, IL1A and TGFBI (transforming growth factor–β–induced), in nasal fluids or medium supernatants. These proteins, which have not previously been described in SAR, also showed significant changes in either nasal fluids or medium (fig. S13).
Fig. 5. Expression of S100A4 is significantly higher in patients with SAR and allergic dermatitis.

(A to F) PBMCs from 20 healthy controls and 20 patients with SAR were challenged for 1 week with allergen. Nasal fluids from the same individuals were collected. P values in (A) to (D) were calculated using unpaired two-tailed Student’s t test, and those in (E) and (F) using paired single-tailed Wilcoxon rank-sum test. ELISA measurement of S100A4 in cell culture supernatants (A) and nasal fluids (B) and of IL-5 (C) and IL-13 (D) in cell culture supernatants is shown. PBMCs from nine allergic patients with SAR were challenged in vitro for 1 week with allergen alone or in combination with the S100A4-neutralizing antibody 6B12. (E and F) After 1 week of incubation, medium supernatants were collected and measured by ELISA for IL-5 and IL-13. Each line represents cells from one patient. (G) Representative skin biopsies from patients with nonlesional and lesional allergic dermatitis (n = 4), as well as healthy non-atopic controls (n = 2), were stained for S100A4 (pink) and CD3 (brown, arrows). Scale bars, 100 μm.
We also analyzed S1004 in allergic dermatitis and found substantial overproduction of S100A4 together with increased numbers of CD3+ T cells in lesional skin biopsies from patients with this disease compared to nonlesional skin from patients and healthy controls (Fig. 5G).
DISCUSSION
We aimed to develop a translational strategy to identify diagnostic and therapeutic target genes in high-throughput studies of complex diseases using SAR as a model. The identification may be facilitated by defining modules of functionally related and co-regulated disease-associated genes (37–41). This is complicated by the involvement of thousands of genes and disease heterogeneity. Furthermore, in many diseases, important variables are unknown, such as the external trigger or key cell type. Thus, the comprehensive translational application of module-based approaches has proven difficult. However, previous studies have shown the potential of siRNA screens for identifying disease genes or pathways (42–44).
The importance of our study lies in that it presents a translational, module-based strategy to find candidate genes in complex diseases. We combined genomic and bioinformatics analyses with siRNA-mediated knockdowns to define a module of candidate genes and validated one of these genes in functional and clinical studies.
We studied SAR, which presents an optimal model of complex diseases because of its well-defined phenotype and pathogenesis. The power of this system is the combined analysis of T cells from patients challenged with a known environmental triggering factor, pollen, with functional studies of TH2 cells and a well-defined mouse model of allergy. Finally, the clinical relevance of potential markers can be studied in the affected organ by analyzing protein levels in nasal fluids. We hypothesized that genes co-regulated with a known disease gene in allergy, IL13, would form a gene module that would contain candidate genes. We did find a module in TH2-polarized cells, whose relevance was supported by the observation that it contained genes of known relevance for allergy and T cell differentiation, as well as candidate genes. Furthermore, it overlapped significantly with allergen-challenged CD4+ T cells from patients with SAR. We focused on one candidate gene in the module, S100A4, which is a member of the S100 family of calcium-binding proteins that are found exclusively in vertebrates. S100 proteins play dynamic roles in numerous biological processes including protein phosphorylation, cell growth and survival, cell migration, and differentiation (45, 46). Accumulating evidence also implicates S100A4 in cancer (47), neurological diseases (48), and rheumatoid arthritis (47, 49). We showed a central role for S100A4 in allergy by combining clinical and functional studies of human cells as well as mouse models (Fig. 6). The diagnostic potential of S100A4 was supported by the observation that S100A4 levels were five times higher in nasal fluids from allergic patients than in healthy controls during the pollen season. We also found a correlation between symptom scores and S100A4 levels in nasal fluids from symptomatic patients during the pollen season. By contrast, we have previously found that nasal fluid TH2 cytokines are close to the detection limits and do not correlate with symptom scores (50). It is of note that because of variable dilution of nasal fluids, correlations between symptom scores and absolute levels of individual proteins may be lower than if the symptom scores are correlated with altered relations between multiple proteins. We also found increased S100A4 in skin from patients with allergic dermatitis. The therapeutic potential of S100A4 was supported by an S100A4-blocking antibody, decreasing local, cellular, and humoral signs of inflammation in either a mouse model of allergy or allergen-challenged PBMCs from allergic patients.
Fig. 6. Dynamic roles of S100A4 in allergic skin inflammation based on a mouse model of allergy.

Allergic inflammation requires the sensitization of the immune system by allergens, resulting in the production of antigen-specific T cells. The interaction of DCs in the draining lymph node with T cells is a critical step that is dependent on S100A4. B cell maturation as a result of T cell–B cell crosstalk (for example, the release of TH2 cytokines by T cells) leads to the production of IgE and IgG1 by plasma cells. Cytokines and chemokines released by T cells stimulate the migration of circulating granulocytes (for example, neutrophils and eosinophils) to the inflammatory site (skin). Differentiation of naïve T cells into CD8+ cytotoxic T cells will exacerbate the skin damage. Blue arrows indicate the flow of the allergic responses. Green arrows indicate the promotion of these processes by S100A4 (figure created by R. Männel).
The pathogenic importance of S100A4 was demonstrated by our mouse model of allergy, in which suppressing the S100A4 gene by genetic deletion at the gene level or by neutralizing its protein with a blocking antibody protected mice from allergic dermatitis as reflected by substantially reduced ear swelling. Functional studies in human cells as well as the mouse model implicated S100A4 in TH2 cell differentiation in response to allergen. In the mouse model, ex vivo T cell proliferation as a result of antigen reencounter, which represents the memory response, was suppressed in S100A4−/− mice compared to wild-type controls. Presentation of antigen peptides to T cells by DCs is indispensable for this process, which is dependent on S100A4. The release of TH2 cytokines was reduced in S100A4−/− mice. In human TH2-polarized cells, siRNA knockdown of S100A4 resulted in decreased release of TH2 cytokines. In draining lymph nodes, the recruitment of CD4+ T cells was reduced in S100A4−/− mice, as were DCs, neutrophils, and CD8+ cells. In serum, a compromised TH2-like antibody profile was observed in S100A4−/− mice compared to wild-type mice. In the ears, which represented the inflamed tissue, reduced numbers of eosinophils, DCs, neutrophils, and CD8+ T cells were observed in S100A4−/− mice. Our findings agree with previous studies showing that S100A4 directly affects cellular recruitment because S100A4 is known to modulate leukocyte adhesion and migration (30, 51, 52). Furthermore, our human and mouse data support a model in which S100A4 may directly act on DCs to promote their capacity to stimulate T cells that may provide the cellular source of S100A4, thus forming a positive feedback loop.
IL-17A levels were also reduced from ex vivo T cells derived from S100A4−/− mice. Although we did not functionally investigate this finding, it may be important because IL-17A is released by TH17 cells, which are increasingly recognized as important in allergy and other inflammatory diseases (35).
Some 10 to 20% of patients with SAR do not respond to treatment with topical steroids and therefore need alternative therapeutic options (53). On the basis of our findings, we propose that S100A4 is a therapeutic target in allergy. Apart from specific antibodies targeting S100A4, as in our study, compounds that disrupt S100A4/protein target interactions have been described, suggesting that this may also be a viable therapeutic approach (54–56). It is, however, of note that previous therapeutic studies specifically targeting IL-13 showed that this was mainly effective in patients with high IL-13 levels (23). In our analyses of allergen-challenged cells from patients with SAR, antibodies targeting S100A4 had the largest effects on IL-13 in T cells from patients with high pretreatment IL-13. Future studies are warranted to examine the therapeutic potential of anti-S100A4 treatment and if patients need to be stratified according to IL-13 levels. From a therapeutic perspective, anti-S100A4 treatment has the advantage that it affects not only IL-13 but also multiple components of allergy.
In addition to the identification of a therapeutic candidate, our studies demonstrate the diagnostic relevance of the module-based approach. We examined three module genes that had not been previously described in allergy and found that the protein levels of all three showed statistically significant changes in supernatants of allergen-challenged cells and/or nasal fluids from patients compared to controls.
Limitations in our study include that the module was defined in in vitro–polarized TH2 cells, which is only one of several T cell subsets that are activated or inactivated in allergen-challenged T cells from allergic patients. The siRNA-mediated knockdowns of TFs may have unspecific effects. The bioinformatic definition of the module may be confounded by limited knowledge of protein interactions. On the other hand, the clinical relevance of the module was supported by significant overlap with allergen-challenged T cells from allergic patients. From a clinical perspective, S100A4 is only one of many genes in the module. Given the complexity of common diseases like SAR, it is likely that combinations of multiple transcripts or proteins will be needed for diagnostic purposes. In a recent study, almost 2000 genes differed in expression between two subgroups with an autoimmune disease (7). Analysis of such genes could help to stratify patients for individualized medicine, particularly in diseases with severe symptoms and poor prognosis or where long-term expensive medication is needed. On the other hand, to make stratification clinically feasible, analysis of a smaller number of genes will probably be needed. Further studies are needed to identify and prioritize combinations of diagnostic markers that are optimal for different diseases. We propose that the analytical approach described in this study may be generally applicable to such studies.
MATERIALS AND METHODS
Study design
We hypothesized that genes co-regulated with a key gene in allergy, namely, IL13, cluster in a module that would allow the identification of candidate genes in allergy (Fig. 1). To test this hypothesis, we identified known and putative IL13-regulating TFs. The effects of siRNA-mediated knockdown of these TFs were examined with mRNA expression arrays in human TH2-polarized cells. Next, we tested if the genes affected by the knockdowns in TH2-polarized cells formed a module, and if the genes in that module were also differentially expressed in allergen-challenged CD4+ cells from patients with SAR. Finally, we performed clinical and experimental studies to examine whether the module contained diagnostic and therapeutic candidate genes. The sizes of the materials for gene expression microarrays were based on our previous studies of allergen-challenged T cells from allergic patients (8–12). Blinding was used in the mouse experiments, but no randomization was used during the sample collection or the experimental validation.
To experimentally confirm the roles of S100A4 in allergy, we used two mouse skin allergic inflammatory models: allergic dermatitis induced by intradermal delivery of OVA and contact hypersensitivity induced by topical application of oxazolone. S100A4+/+ and S100A4−/− mice (30) both on C57BL/6 background were used. For the OVA model, mice were sensitized four times at a 1-week interval by an intraperitoneal injection of 10 μg of OVA (Sigma-Aldrich) admixed to 4 mg of aluminum hydroxide hydrate (Alum, Sigma-Aldrich). One week after the final sensitization, mice were challenged with 40 μg of OVA in 10 μl of phosphate-buffered saline (PBS) intradermally in one ear and PBS in the other as control. Ear thickness was measured 24 hours later by an observer blinded to the identity of the mice with a micrometer (Mitutoyo), and differences between the two ears were recorded as the net increase of ear thickness. In some experiments, 75 μg of S100A4-specific blocking antibody (clone 6B12) (57) or isotype mouse IgG1 in 100 μl of PBS was injected intraperitoneally shortly before each sensitization and 3 days after each sensitization. For mice that had received intraperitoneal antibodies, the ear challenge was accompanied with a dose of 7.5 μg of S100A4 antibody or isotype mouse IgG1 in addition to 40 μg of OVA. The antibody treatment plan was based on experience obtained from previous studies (57). A detailed treatment protocol is shown in fig. S10. Mice were sacrificed immediately after the thickness measurement, and single-cell suspensions of ears were prepared by digesting minced ear skins in Liberase (25 μg/ml) (Roche Applied Science) and deoxyribonuclease (DNase) I (400 U/ml) (Roche Applied Science) at 37°C for 30 min. The cervical draining lymph nodes and spleens were removed for flow cytometric analyses or T cell memory reaction assessment. Blood was collected for ELISA measurements of serum antibodies. Alternatively, contact hypersensitivity was induced and developed in S100A4+/+ or S100A4−/− mice. Essentially, mice were sensitized on shaved abdominal skin with 100 μl of 2% oxazolone (Sigma-Aldrich) dissolved in ethanol. Five days later, mice were challenged with 10 μl of 1% oxazolone topically on each side of one ear and were given an equal amount of ethanol on the other ear. The ear thickness was measured and presented as explained in the OVA-induced dermatitis model. We used n ≤ 18 but n ≥ 5 for in vivo tests and n between 2 and 5 for in vitro analyses.
Study subjects
Five different materials were analyzed. (i) Allergen-challenged PBMCs from 20 patients with SAR and 20 matched healthy controls outside of the pollen season were analyzed for S100A4 and other proteins in supernatants. CD4+ T cells were also extracted from this material and analyzed with gene expression microarrays (58). The mean age ± SEM of patients and controls was 25 ± 2 and 26 ± 2 years, respectively. (ii) Allergen-challenged PBMCs from nine patients with asymptomatic SAR outside of the season were incubated with a neutralizing antibody [clone 6B12, 200 μg added on days 0, 3, and 5 that recognized both human and mouse S100A4 (57) for 1 week]. The mean age ± SEM of these patients was 23 ± 2 years. (iii) Nasal fluids from the same patients and controls described in (i) were analyzed for S100A4 and other proteins during the pollen season. (iv) Fifty patients with symptomatic SAR seen during the pollen season were analyzed to test for correlation between S100A4 and symptom scores. The mean age ± SEM of patients was 29 ± 1 years. The inclusion criteria for SAR were a positive history for seasonal rhinitis for at least 2 years, as well as positive skin prick tests for birch and/or grass pollen. All patients were untreated when the samples were obtained, and had no other known diseases. Symptom scores and nasal fluids were obtained as previously described (11, 59). (v) Skin biopsies from four patients with allergic dermatitis who fulfilled the criteria of Williams et al. (60), including elevated IgE levels. None of the patients had received local or systemic treatment with glucocorticoids or tacrolimus (FK506) within 2 weeks. Skin biopsies were also obtained from two healthy controls, who had normal levels of IgE and were all symptom-free and had no history of allergic dermatitis or any other atopic or chronic disease. Skin biopsies were obtained from lesional and nonlesional skin. The mean age of the patients was 28 years, of whom two were females. The mean age of the controls was 29 years. Two punch biopsies (4-mm diameter) were taken under local anesthesia from lesional skin from each patient and matching skin location from each control. The biopsies were snap-frozen in liquid nitrogen and stored at −70°C until immunohistochemistry preparation. Informed consent was obtained from all subjects involved in the study. The study was approved by the ethics board of University of Gothenburg.
Identification of potential IL13-regulating TFs
Gene expression microarray data from 17 patients with SAR were analyzed after challenge with allergen or diluents for 1 week (8). The PRIMA software was used to identify TFs that changed in expression and whose TF binding sites were found in the IL13 promotor. Each TF predicted to regulate IL13 was given a score representing its likelihood to be an IL13 regulator. The score was compiled with sequence-based target predictions, expression profiling, and known relevant cellular pathways. Briefly, each source gave each TF a score between 0 and 1. Each source was then given a weight depending on its relevance for this context by manual assessment. Sequence-based predictions were considered the most reliable source, given a weight of 0.9. The score for each TF was calculated as follows:
In the formula, i represents the different sources, s represents the score obtained from source i, and w represents the weight of layer i. Each source contributes to increasing the total score of each TF, but its contribution is dependent on the weight of the source. In the siRNA screen, described below, we selected TFs that were down-regulated by at least one siRNA and used a fold change of 45% as cutoff for changes in IL13 and the corresponding TF. By contrast, in the siRNA-mediated knockdowns in biological replicates, we used statistical analysis of the changes in IL13 to select TFs.
Identification of optimal time point for knockdown of candidate TFs
Total CD4+ T cells from four different healthy blood donors were isolated from PBMCs with the CD4+ T Cell Isolation Kit II from Miltenyi. The isolated cells were washed and polarized toward TH2 for 0, 6, 48, and 96 hours. To plot the median mRNA expression of all candidate TFs, we used MATLAB software with default settings.
siRNA-mediated gene knockdowns, quantitative real-time PCR, and gene expression microarrays
Human CD4+ T cells (5 × 10⁴) (Lonza) were transfected in a 96-well plate with the Amaxa nucleofection program 96-F0-115. For the whole screening, T cells from the same blood donor and the same batch were used. To down-regulate NFKB1, STAT4, NFATC2, STAT6, GATA1, REL, JUN, MYC, STAT1, STAT5B, ELF2, STAT3, NFKB2, FOS, CIITA, SPI1, DBP, CREBBP, EP300 MYB, BATF, STAT5A, NFATC1, NFAT5, and ELK1, each gene was targeted by three different siRNAs individually at a final concentration of 1 μM. Cells were also transfected with nontargeting siRNA or with buffer. For each TF, three technical repeats were performed. For the knockdowns that had been used for the gene expression microarrays, 1 × 10⁶ human CD4+ T cells (Lonza) were transfected in a cuvette with 1 μM of the corresponding siRNA with the Amaxa nucleofection program U-014 as previously described (8). Six hours after the nucleofection, cells were washed, activated, and polarized toward TH2 for 16 hours with plate-bound anti-CD3 (500 ng/ml), soluble anti-CD28 (500 ng/ml), anti–IL-12 (5 μg/ml), IL-4 (10 ng/ml), and IL-2 (17 ng/ml) (all from R&D Systems Ltd.). After polarization, cells were harvested and counted, and an assessment of viability was done with a cell counter from Bio-Rad. Cells were lysed in 600 μl of Qiazol. Quantitative real-time PCR, gene expression microarrays, and identification of differentially expressed genes were performed as described previously (24).
Flow cytometric analyses
Mouse tissue cells were stained with the following antibodies: fluorescein isothiocyanate (FITC)–CD8 and phycoerythrin (PE)–Siglec-F (ImmunoTools); V450-Gr1, PE-CD69, and allophycocyanin (APC)–CD11c (eBioscience); and FITC-CD3, APC-CD8, PE-CD19, FITC–MHC-II (major histocompatibility complex II), PE-Cy7-CD4, Alexa Fluor 700–CD11c, and APC-CD11b (BD Biosciences). Cells were also stained with 7-amino-actinomycin D (Sigma-Aldrich) to exclude dead cells. Neutrophils, eosinophils, and DCs were defined as Gr1+/CD11b+, Siglec-F+/CD11c−, and CD11b+/CD11c+ cells, respectively. Human peripheral blood–derived T cells were stained with FITC-CD4 and PE–IL-13 (BD Biosciences) after fixation and permeabilization (eBioscience). Flow cytometry was carried out with an LSR-II flow cytometer (BD Biosciences), and data were analyzed by the FlowJo software (BD Biosciences).
Serological analyses
OVA-specific IgG, IgG1, IgG2a, and IgE levels in serum were determined with ELISA. Direct alkaline phosphatase (AP)–conjugated antibodies against mouse IgG, IgG1, or IgG2a (Sigma-Aldrich) and indirect biotin-conjugated anti-mouse IgE (Serotec) were used. OVA-specific IgE levels were expressed with the optical density values. OVA-specific IgG levels were expressed in titers (Magellan 7.1 Data Analysis Software, Tecan).
T cell proliferation and cytokine detection
Splenocytes (4 × 10⁴ per well) were seeded into a 96-well round-bottom plate in the presence or absence of OVA (1 mg/ml) and cultured at 37°C in 5% CO2 for 72 hours. [3H]Thymidine (1 μCi per well) was added for the last 6 hours. The amount of incorporated [3H]thymidine was recorded with a β-scintillation counter with readout expressed originally in counts per minute (CPM) ± SEM, which was later normalized and shown as arbitrary units. Supernatants were pooled for cytokine detection with a cytometric bead array (eBioscience) according to the manufacturer’s instruction.
DC-dependent T cell activation assay
Mesenteric lymph nodes and spleens from S100A4−/− or S100A4+/+ mice, which had received Flt-3L cells to expand DCs, were harvested, pooled, and digested with a combination of Liberase TM and DNase I (Roche Applied Science). DCs were purified by CD11c MicroBeads (Miltenyi Biotec GmbH) and incubated with OVA (1 mg/ml) in the presence or absence of recombinant human S100A4 (1 μg/ml) for 2 hours followed by extensive washing. T cells were sorted from the pooled lymph nodes and spleens of OT-II mice with CD4+ T Cell Isolation Kit II (Miltenyi Biotec GmbH). Next, washed DCs (2 × 10⁴ cells per well) were mixed with CD4+ T cells (2 × 10⁵ cells per well) and incubated for 72 hours. The activation status of OT-II T cells as a consequence of interaction with DCs was determined by CD69 expression on CD4+ cells by flow cytometry.
Characterization and purification of recombinant S100A4
For the production of untagged protein, the codon-optimized human S100A4 sequence was subcloned into the Nde I/Bam HI sites of pET11b (Novagen). The wild-type S100A4 was purified as described previously (56) and then gel-filtered on a HiLoad Superdex 75 26/60 column (GE Healthcare). The elution profile of the wild-type S100A4 showed one major peak consistent with an S100A4 dimer. S100A4 protein concentrations were determined with the Bradford protein assay (Bio-Rad) and an S100A4 standard of known concentration. The concentration of the S100A4 standard was determined by quantitative amino acid analysis (Keck Biotechnology Resource Laboratory at Yale University, New Haven, CT). The endotoxin levels of the recombinant S100A4 were 0.01 endotoxin unit/μg as determined with the QCL-1000 Endpoint Chromogenic LAL assay kit (Lonza).
Purification and characterization of neutralizing S100A4 antibody
The purification of monoclonal anti-S100A4 antibodies from clone 6B12 was done as described previously (57). Briefly, hybridoma cells were grown in RPMI 1640 until they reached a density of 1 × 10⁶ cells/ml. After centrifugation, the supernatants were sterile-filtered and degassed, and the pH was adjusted to 7.2. The monoclonal antibodies were purified through affinity chromatography. After neutralization, the antibody-containing fractions were concentrated using Amicon Ultra-15 centrifugal filter units (Millipore) with a molecular weight cutoff (MWCO) of 10 kD. The purified antibody was dialyzed against 1× PBS-Ca2+/Mg2+ (Gibco) using dialysis tubing with an MWCO of 12 to 14 kD (Spectrum Laboratories Inc.). The concentration of the antibody was then adjusted to 2 mg/ml, sterile-filtered (0.22 μm), divided into aliquots, and stored at −80°C. The anti-S100A4 monoclonal antibody (clone 6B12) can neutralize both human and mouse S100A4. It binds to an epitope between amino acids 66 and 89 (RDNEVDFQEYCVFLSCIAMMCNEF) but not to other regions (57). There is 100% sequence identity between the mouse and human S100A4 in this region. The 6B12 antibody binds only to human and mouse S100A4 but not to human S100A1, S100A2, S100A5, S100A9, S100A12, or S100B (57). Furthermore, because the 6B12 antibody does not cross-react with extract of activated fibroblasts deficient in S100A4, and because S100A8 is expressed in activated fibroblasts (61), this would rather exclude the cross-reactivity of 6B12 to S100A8. The epitope that is recognized by the 6B12 antibody does not exist on the S100A8 molecule.
Analysis of secreted proteins in supernatants from allergen-challenged PBMCs and nasal fluid proteins
S100A4 was analyzed with an ELISA kit from MBL International, whereas IL-5 and IL-13 were analyzed with ELISA kits from R&D Systems Ltd.
Immunohistochemical analysis of S100A4 in allergic dermatitis
The tissue distribution of S100A4 protein was investigated by immunohistochemistry on punch biopsy samples (4 mm) from lesional and nonlesional skin of patients (n = 4) and healthy control subjects (n = 2). Deparaffinized formalin-fixed tissue sections (4 μm) were mounted on slides, warmed at room temperature for 30 min, and fixed in ice-cold acetone for 5 min. Slides were air-dried for 3 min and washed in PBS. Immunostaining was accomplished by an automated staining machine (DAKO TechMate 500 PLUS; DakoCytomation). Essentially, slides were incubated for 1 hour with the polyclonal anti-S100A4 antibody (57 ) and mouse anti-human CD3 antibody (Abcam) followed by counterstaining with a peroxidase- and AP-based method (EnVision G|2 Doublestain System; Dako), revealing the mouse and rabbit primary antibodies, respectively, according to the manufacturer’s instruction. All sections were examined and photographed with standard bright-field optics (Olympus XC30).
Statistical analysis
The gene expression microarray data were quantile-normalized, and differentially expressed genes were determined with LIMMA package in R, with 0.01 false discovery rate according to the Storey method. For the in vitro validation, each experiment was repeated three to five times, unless otherwise noted. For the in vivo experiments, each measurement was repeated three or four times. Unless otherwise noted, data are given as means ± SEM, and unpaired two-tailed Student’s t test was applied to compare two groups of independent samples. In the treatment experiments, the starting values varied greatly, and we used paired single-tailed Wilcoxon rank-sum test to determine the decrease after treatment. In some of the mouse model analyses, outliers were removed according to Grubb’s test (α = 0.01). At most, one mouse was removed in each of the analyses (n ≥ 12).
Supplementary Material
Acknowledgments
We thank J. Nedergaard Larsen (ALK-Abello) for providing allergen extract and L. Norwood Toro (Albert Einstein College of Medicine) for technical support. We thank K. Sandstedt for her excellent collections of samples from patients and controls. We also thank R. Männel for the illustration of Fig. 6.
Funding: This research has been supported by the European Commission under the Seventh Framework Programme (grant agreement number 223367), MultiMod, the Swedish Medical Research Council, ALF, and Mucosal Immunobiology and Vaccine Center, Gothenburg.
Footnotes
Author contributions: Z.X. and M.B. supervised the study. S.B. designed and performed the experiments that include RNAi, gene expression microarrays, and ELISA measurements for human samples. Y.F. designed and performed all the animal experiments and the assay on human T cell stimulation by S100A4 recombinant protein. F.B., M.G., and C.N. were involved in the design of the study and bioinformatics analyses. H.W., H.Z., and Y.Z. were involved in the knockdown experiments and clinical studies. J.K. and M.K.B. performed the antibody array. Aelita K. was involved in the immunohistochemistry and in the experiments with the neutralizing S100A4 antibody. Andrea K. and B.S. performed and supervised the RNAi screening. N.D. purified the human S100A4 recombinant protein. A.B. provided the S100A4 knockout mice and intellectual input in the experimental design. E.B. performed the studies of allergic dermatitis. J.K. and N.A. purified anti-S100A4 antibodies and performed functional studies. S.B., Y.F., Z.X., and M.B. wrote the manuscript with input from other authors. M.B. conceived the study.
Competing interests: The authors declare that they have no competing financial interests.
Data and materials availability: The microarray data have been submitted to a publicly available database under the Gene Expression Omnibus accession number GSE46333.
REFERENCES AND NOTES
- 1.Petretto E, Liu ET, Aitman TJ. A gene harvest revealing the archeology and complexity of human disease. Nat Genet. 2007;39:1299–1301. doi: 10.1038/ng1107-1299. [DOI] [PubMed] [Google Scholar]
- 2.Segal E, Friedman N, Kaminski N, Regev A, Koller D. From signatures to models: Understanding cancer using microarrays. Nat Genet. 2005;37:S38–S45. doi: 10.1038/ng1561. [DOI] [PubMed] [Google Scholar]
- 3.Mootha VK, Lindgren CM, Eriksson KF, Subramanian A, Sihag S, Lehar J, Puigserver P, Carlsson E, Ridderstråle M, Laurila E, Houstis N, Daly MJ, Patterson N, Mesirov JP, Golub TR, Tamayo P, Spiegelman B, Lander ES, Hirschhorn JN, Altshuler D, Groop LC. PGC-1α-responsive genes involved in oxidative phosphorylation are coordinately downregulated in human diabetes. Nat Genet. 2003;34:267–273. doi: 10.1038/ng1180. [DOI] [PubMed] [Google Scholar]
- 4.Lamb J, Ramaswamy S, Ford HL, Contreras B, Martinez RV, Kittrell FS, Zahnow CA, Patterson N, Golub TR, Ewen ME. A mechanism of cyclin D1 action encoded in the patterns of gene expression in human cancer. Cell. 2003;114:323–334. doi: 10.1016/s0092-8674(03)00570-1. [DOI] [PubMed] [Google Scholar]
- 5.Huang E, Ishida S, Pittman J, Dressman H, Bild A, Kloos M, D’Amico M, Pestell RG, West M, Nevins JR. Gene expression phenotypic models that predict the activity of oncogenic pathways. Nat Genet. 2003;34:226–230. doi: 10.1038/ng1167. [DOI] [PubMed] [Google Scholar]
- 6.Pujana MA, Han JD, Starita LM, Stevens KN, Tewari M, Ahn JS, Rennert G, Moreno V, Kirchhoff T, Gold B, Assmann V, Elshamy WM, Rual JF, Levine D, Rozek LS, Gelman RS, Gunsalus KC, Greenberg RA, Sobhian B, Bertin N, Venkatesan K, Ayivi-Guedehoussou N, Solé X, Hernández P, Lázaro C, Nathanson KL, Weber BL, Cusick ME, Hill DE, Offit K, Livingston DM, Gruber SB, Parvin JD, Vidal M. Network modeling links breast cancer susceptibility and centrosome dysfunction. Nat Genet. 2007;39:1338–1349. doi: 10.1038/ng.2007.2. [DOI] [PubMed] [Google Scholar]
- 7.McKinney EF, Lyons PA, Carr EJ, Hollis JL, Jayne DR, Willcocks LC, Koukoulaki M, Brazma A, Jovanovic V, Kemeny DM, Pollard AJ, Macary PA, Chaudhry AN, Smith KG. A CD8+ T cell transcription signature predicts prognosis in autoimmune disease. Nat Med. 2010;16:586–591. doi: 10.1038/nm.2130. [DOI] [PMC free article] [PubMed] [Google Scholar]
- 8.Bruhn S, Barrenäs F, Mobini R, Andersson BA, Chavali S, Egan BS, Hovig E, Sandve GK, Langston MA, Rogers G, Wang H, Benson M. Increased expression of IRF4 and ETS1 in CD4+ cells from patients with intermittent allergic rhinitis. Allergy. 2012;67:33–40. doi: 10.1111/j.1398-9995.2011.02707.x. [DOI] [PMC free article] [PubMed] [Google Scholar]
- 9.Benson M, Carlsson L, Guillot G, Jernås M, Langston MA, Rudemo M, Andersson B. A network-based analysis of allergen-challenged CD4+ T cells from patients with allergic rhinitis. Genes Immun. 2006;7:514–521. doi: 10.1038/sj.gene.6364322. [DOI] [PubMed] [Google Scholar]
- 10.Wang H, Barrenäs F, Bruhn S, Mobini R, Benson M. Increased IFN-γ activity in seasonal allergic rhinitis is decreased by corticosteroid treatment. J Allergy Clin Immunol. 2009;124:1360–1362. doi: 10.1016/j.jaci.2009.09.037. [DOI] [PubMed] [Google Scholar]
- 11.Benson M, Langston MA, Adner M, Andersson B, Torinssson-Naluai A, Cardell LO. A network-based analysis of the late-phase reaction of the skin. J Allergy Clin Immunol. 2006;118:220–225. doi: 10.1016/j.jaci.2006.03.006. [DOI] [PubMed] [Google Scholar]
- 12.Barrenäs F, Chavali S, Alves AC, Coin L, Jarvelin MR, Jörnsten R, Langston MA, Ramasamy A, Rogers G, Wang H, Benson M. Highly interconnected genes in disease-specific networks are enriched for disease-associated polymorphisms. Genome Biol. 2012;13:R46. doi: 10.1186/gb-2012-13-6-r46. [DOI] [PMC free article] [PubMed] [Google Scholar]
- 13.Wills-Karp M. IL-12/IL-13 axis in allergic asthma. J Allergy Clin Immunol. 2001;107:9–18. doi: 10.1067/mai.2001.112265. [DOI] [PubMed] [Google Scholar]
- 14.Ideker T, Sharan R. Protein networks in disease. Genome Res. 2008;18:644–652. doi: 10.1101/gr.071852.107. [DOI] [PMC free article] [PubMed] [Google Scholar]
- 15.Amit I, Regev A, Hacohen N. Strategies to discover regulatory circuits of the mammalian immune system. Nat Rev Immunol. 2011;11:873–880. doi: 10.1038/nri3109. [DOI] [PMC free article] [PubMed] [Google Scholar]
- 16.Ideker T, Krogan NJ. Differential network biology. Mol Syst Biol. 2012;8:565. doi: 10.1038/msb.2011.99. [DOI] [PMC free article] [PubMed] [Google Scholar]
- 17.Vidal M, Cusick ME, Barabási AL. Interactome networks and human disease. Cell. 2011;144:986–998. doi: 10.1016/j.cell.2011.02.016. [DOI] [PMC free article] [PubMed] [Google Scholar]
- 18.Brightling C, Saha S, Hollins F. Interleukin-13: Prospects for new treatments. Clin Exp Allergy. 2010;40:42–49. doi: 10.1111/j.1365-2222.2009.03383.x. [DOI] [PMC free article] [PubMed] [Google Scholar]
- 19.Tachdjian R, Al Khatib S, Schwinglshackl A, Kim HS, Chen A, Blasioli J, Mathias C, Kim HY, Umetsu DT, Oettgen HC, Chatila TA. In vivo regulation of the allergic response by the IL-4 receptor α chain immunoreceptor tyrosine-based inhibitory motif. J Allergy Clin Immunol. 2010;125:1128–1136.e8. doi: 10.1016/j.jaci.2010.01.054. [DOI] [PMC free article] [PubMed] [Google Scholar]
- 20.Kelly-Welch AE, Hanson EM, Boothby MR, Keegan AD. Interleukin-4 and interleukin-13 signaling connections maps. Science. 2003;300:1527–1528. doi: 10.1126/science.1085458. [DOI] [PubMed] [Google Scholar]
- 21.Wills-Karp M. Interleukin-13 in asthma pathogenesis. Immunol Rev. 2004;202:175–190. doi: 10.1111/j.0105-2896.2004.00215.x. [DOI] [PubMed] [Google Scholar]
- 22.Adcock IM, Caramori G, Chung KF. New targets for drug development in asthma. Lancet. 2008;372:1073–1087. doi: 10.1016/S0140-6736(08)61449-X. [DOI] [PubMed] [Google Scholar]
- 23.Corren J, Lemanske RF, Jr, Hanania NA, Korenblat PE, Parsey MV, Arron JR, Harris JM, Scheerens H, Wu LC, Su Z. Lebrikizumab treatment in adults with asthma. N Engl J Med. 2011;365:1088–1098. doi: 10.1056/NEJMoa1106469. [DOI] [PubMed] [Google Scholar]
- 24.Bruhn S, Katzenellenbogen M, Gustafsson M, Krönke A, Sönnichsen B, Zhang H, Benson M. Combining gene expression microarray- and cluster analysis with sequence-based predictions to identify regulators of IL-13 in allergy. Cytokine. 2012;60:736–740. doi: 10.1016/j.cyto.2012.08.009. [DOI] [PubMed] [Google Scholar]
- 25.Masuda A, Yoshikai Y, Kume H, Matsuguchi T. The interaction between GATA proteins and activator protein-1 promotes the transcription of IL-13 in mast cells. J Immunol. 2004;173:5564–5573. doi: 10.4049/jimmunol.173.9.5564. [DOI] [PubMed] [Google Scholar]
- 26.Lorentz A, Klopp I, Gebhardt T, Manns MP, Bischoff SC. Role of activator protein 1, nuclear factor-κB, and nuclear factor of activated T cells in IgE receptor-mediated cytokine expression in mature human mast cells. J Allergy Clin Immunol. 2003;111:1062–1068. doi: 10.1067/mai.2003.1342. [DOI] [PubMed] [Google Scholar]
- 27.Chen J, Amasaki Y, Kamogawa Y, Nagoya M, Arai N, Arai K, Miyatake S. Role of NFATx (NFAT4/NFATc3) in expression of immunoregulatory genes in murine peripheral CD4+ T cells. J Immunol. 2003;170:3109–3117. doi: 10.4049/jimmunol.170.6.3109. [DOI] [PubMed] [Google Scholar]
- 28.Zheng W, Flavell RA. The transcription factor GATA-3 is necessary and sufficient for Th2 cytokine gene expression in CD4 T cells. Cell. 1997;89:587–596. doi: 10.1016/s0092-8674(00)80240-8. [DOI] [PubMed] [Google Scholar]
- 29.Cullen BR. Enhancing and confirming the specificity of RNAi experiments. Nat Methods. 2006;3:677–681. doi: 10.1038/nmeth913. [DOI] [PubMed] [Google Scholar]
- 30.Li ZH, Dulyaninova NG, House RP, Almo SC, Bresnick AR. S100A4 regulates macrophage chemotaxis. Mol Biol Cell. 2010;21:2598–2610. doi: 10.1091/mbc.E09-07-0609. [DOI] [PMC free article] [PubMed] [Google Scholar]
- 31.Boguniewicz M, Leung DYM. Atopic dermatitis: A disease of altered skin barrier and immune dysregulation. Immunol Rev. 2011;242:233–246. doi: 10.1111/j.1600-065X.2011.01027.x. [DOI] [PMC free article] [PubMed] [Google Scholar]
- 32.Lindblad EB. Aluminium adjuvants—In retrospect and prospect. Vaccine. 2004;22:3658–3668. doi: 10.1016/j.vaccine.2004.03.032. [DOI] [PubMed] [Google Scholar]
- 33.Finkelman FD, Holmes J, Katona IM, Urban JF, Jr, Beckmann MP, Park LS, Schooley KA, Coffman RL, Mosmann TR, Paul WE. Lymphokine control of in vivo immunoglobulin isotype selection. Annu Rev Immunol. 1990;8:303–333. doi: 10.1146/annurev.iy.08.040190.001511. [DOI] [PubMed] [Google Scholar]
- 34.Coffman R, Savelkoul H, Lebman D. Cytokine regulation of immunoglobulin isotype switching and expression. Semin Immunol. 1989;1:55–63. [PubMed] [Google Scholar]
- 35.Oboki K, Ohno T, Saito H, Nakae S. Th17 and allergy. Allergol Int. 2008;57:121–134. doi: 10.2332/allergolint.R-07-160. [DOI] [PubMed] [Google Scholar]
- 36.Christensen AD, Haase C. Immunological mechanisms of contact hypersensitivity in mice. APMIS. 2012;120:1–27. doi: 10.1111/j.1600-0463.2011.02832.x. [DOI] [PubMed] [Google Scholar]
- 37.Ge H, Liu Z, Church GM, Vidal M. Correlation between transcriptome and interactome mapping data from Saccharomyces cerevisiae. Nat Genet. 2001;29:482–486. doi: 10.1038/ng776. [DOI] [PubMed] [Google Scholar]
- 38.Minguez P, Dopazo J. Assessing the biological significance of gene expression signatures and co-expression modules by studying their network properties. PLOS One. 2011;6:e17474. doi: 10.1371/journal.pone.0017474. [DOI] [PMC free article] [PubMed] [Google Scholar]
- 39.Narayanan M, Vetta A, Schadt EE, Zhu J. Simultaneous clustering of multiple gene expression and physical interaction datasets. PLOS Comput Biol. 2010;6:e1000742. doi: 10.1371/journal.pcbi.1000742. [DOI] [PMC free article] [PubMed] [Google Scholar]
- 40.Ramani AK, Li Z, Hart GT, Carlson MW, Boutz DR, Marcotte EM. A map of human protein interactions derived from co-expression of human mRNAs and their orthologs. Mol Syst Biol. 2008;4:180. doi: 10.1038/msb.2008.19. [DOI] [PMC free article] [PubMed] [Google Scholar]
- 41.Chen J, Liang H, Fernández A. Protein structure protection commits gene expression patterns. Genome Biol. 2008;9:R107. doi: 10.1186/gb-2008-9-7-r107. [DOI] [PMC free article] [PubMed] [Google Scholar]
- 42.Zhang C, Browne A, Child D, Divito JR, Stevenson JA, Tanzi RE. Loss of function of ATXN1 increases amyloid b-protein levels by potentiating b-secretase processing of β-amyloid precursor protein. J Biol Chem. 2010;285:8515–8526. doi: 10.1074/jbc.M109.079079. [DOI] [PMC free article] [PubMed] [Google Scholar]
- 43.Colland F, Jacq X, Trouplin V, Mougin C, Groizeleau C, Hamburger A, Meil A, Wojcik J, Legrain P, Gauthier JM. Functional proteomics mapping of a human signaling pathway. Genome Res. 2004;14:1324–1332. doi: 10.1101/gr.2334104. [DOI] [PMC free article] [PubMed] [Google Scholar]
- 44.Wu W, Hodges E, Höög C. Thorough validation of siRNA-induced cell death phenotypes defines new anti-apoptotic protein. Nucleic Acids Res. 2006;34:e13. doi: 10.1093/nar/gnj015. [DOI] [PMC free article] [PubMed] [Google Scholar]
- 45.Donato R. S100: A multigenic family of calcium-modulated proteins of the EF-hand type with intracellular and extracellular functional roles. Int J Biochem Cell Biol. 2001;33:637–668. doi: 10.1016/s1357-2725(01)00046-2. [DOI] [PubMed] [Google Scholar]
- 46.Donato R, Cannon BR, Sorci G, Riuzzi F, Hsu K, Weber DJ, Geczy CL. Functions of S100 proteins. Curr Mol Med. 2013;13:24–57. [PMC free article] [PubMed] [Google Scholar]
- 47.Oslejsková L, Grigorian M, Gay S, Neidhart M, Senolt L. The metastasis associated protein S100A4: A potential novel link to inflammation and consequent aggressive behaviour of rheumatoid arthritis synovial fibroblasts. Ann Rheum Dis. 2008;67:1499–1504. doi: 10.1136/ard.2007.079905. [DOI] [PubMed] [Google Scholar]
- 48.Zimmer DB, Chaplin J, Baldwin A, Rast M. S100-mediated signal transduction in the nervous system and neurological diseases. Cell Mol Biol. 2005;51:201–214. [PubMed] [Google Scholar]
- 49.Mishra SK, Siddique HR, Saleem M. S100A4 calcium-binding protein is key player in tumor progression and metastasis: Preclinical and clinical evidence. Cancer Metastasis Rev. 2012;31:163–172. doi: 10.1007/s10555-011-9338-4. [DOI] [PubMed] [Google Scholar]
- 50.Benson M, Strannegård IL, Strannegård Ö, Wennergren G. Topical steroid treatment of allergic rhinitis decreases nasal fluid TH2 cytokines, eosinophils, eosinophil cationic protein, and IgE but has no significant effect on IFN-γ, IL-1β, TNF-α, or neutrophils. J Allergy Clin Immunol. 2000;106:307–312. doi: 10.1067/mai.2000.108111. [DOI] [PubMed] [Google Scholar]
- 51.Bian L, Strzyz P, Jonsson IM, Erlandsson M, Hellvard A, Brisslert M, Ohlsson C, Ambartsumian N, Grigorian M, Bokarewa M. S100A4 deficiency is associated with efficient bacterial clearance and protects against joint destruction during Staphylococcal infection. J Infect Dis. 2011;204:722–730. doi: 10.1093/infdis/jir369. [DOI] [PubMed] [Google Scholar]
- 52.Österreicher CH, Penz-Österreicher M, Grivennikov SI, Guma M, Koltsova EK, Datz C, Sasik R, Hardiman G, Karin M, Brenner DA. Fibroblast-specific protein 1 identifies an inflammatory subpopulation of macrophages in the liver. Proc Natl Acad Sci USA. 2011;108:308–313. doi: 10.1073/pnas.1017547108. [DOI] [PMC free article] [PubMed] [Google Scholar]
- 53.Bousquet J, Bachert C, Canonica GW, Casale TB, Cruz AA, Lockey RJ, Zuberbier T Extended Global Allergy and Asthma European Network, World Allergy Organization and Allergic Rhinitis and its Impact on Asthma Study Group. Unmet needs in severe chronic upper airway disease (SCUAD) J Allergy Clin Immunol. 2009;124:428–433. doi: 10.1016/j.jaci.2009.06.027. [DOI] [PubMed] [Google Scholar]
- 54.Malashkevich VN, Dulyaninova NG, Ramagopal UA, Liriano MA, Varney KM, Knight D, Brenowitz M, Weber DJ, Almo SC, Bresnick AR. Phenothiazines inhibit S100A4 function by inducing protein oligomerization. Proc Natl Acad Sci USA. 2010;107:8605–8610. doi: 10.1073/pnas.0913660107. [DOI] [PMC free article] [PubMed] [Google Scholar]
- 55.Garrett SC, Hodgson L, Rybin A, Toutchkine A, Hahn KM, Lawrence DS, Bresnick AR. A biosensor of S100A4 metastasis factor activation: Inhibitor screening and cellular activation dynamics. Biochemistry. 2008;47:986–996. doi: 10.1021/bi7021624. [DOI] [PMC free article] [PubMed] [Google Scholar]
- 56.Dulyaninova NG, Hite KM, Zencheck WD, Scudiero DA, Almo SC, Shoemaker RH, Bresnick AR. Cysteine 81 is critical for the interaction of S100A4 and myosin-IIA. Biochemistry. 2011;50:7218–7227. doi: 10.1021/bi200853y. [DOI] [PMC free article] [PubMed] [Google Scholar]
- 57.Klingelhöfer J, Grum-Schwensen B, Beck MK, Knudsen RS, Grigorian M, Lukanidin E, Ambartsumian N. Anti-S100A4 antibody suppresses metastasis formation by blocking stroma cell invasion. Neoplasia. 2012;14:1260–1268. doi: 10.1593/neo.121554. [DOI] [PMC free article] [PubMed] [Google Scholar]
- 58.Chavali S, Bruhn S, Tiemann K, Sætrom P, Barrenäs F, Saito T, Kanduri K, Wang H, Benson M. MicroRNAs act complementarily to regulate disease-related mRNA modules in human diseases. RNA. 2013;19:1552–1562. doi: 10.1261/rna.038414.113. [DOI] [PMC free article] [PubMed] [Google Scholar]
- 59.Wang H, Gottfries J, Barrenäs F, Benson M. Identification of novel biomarkers in seasonal allergic rhinitis by combining proteomic, multivariate and pathway analysis. PLOS One. 2011;6:e23563. doi: 10.1371/journal.pone.0023563. [DOI] [PMC free article] [PubMed] [Google Scholar]
- 60.Williams H, Jburney P, Hay R, Archer C, Shipley M, Ahunter J, Bingham E, Finlay A, Pembroke A, Graham-Brown RC, Atherton DA, Lewis-Jones MS, Holden CA, Harper JI, Champion RH, Poyner TF, Launer J, David TJ. The U.K. Working Party’s Diagnostic Criteria for Atopic Dermatitis. I. Derivation of a minimum set of discriminators for atopic dermatitis. Br J Dermatol. 1994;131:383–396. doi: 10.1111/j.1365-2133.1994.tb08530.x. [DOI] [PubMed] [Google Scholar]
- 61.Rahimi F, Hsu K, Endoh Y, Geczy CL. FGF-2, IL-1β and TGF-β regulate fibroblast expression of S100A8. FEBS J. 2005;272:2811–2827. doi: 10.1111/j.1742-4658.2005.04703.x. [DOI] [PubMed] [Google Scholar]
- 62.Szklarczyk D, Franceschini A, Kuhn M, Simonovic M, Roth A, Minguez P, Doerks T, Stark M, Muller J, Bork P, Jensen LJ, von Mering C. The STRING database in 2011: Functional interaction networks of proteins, globally integrated and scored. Nucleic Acids Res. 2011;39:D561–D568. doi: 10.1093/nar/gkq973. [DOI] [PMC free article] [PubMed] [Google Scholar]
- 63.Schwenk F, Baron U, Rajewsky K. A cre-transgenic mouse strain for the ubiquitous deletion of loxP-flanked gene segments including deletion in germ cells. Nucleic Acids Res. 1995;23:5080–5081. doi: 10.1093/nar/23.24.5080. [DOI] [PMC free article] [PubMed] [Google Scholar]
- 64.Abdali S, De Laere B, Poulsen M, Grigorian M, Lukanidin E, Klingelhöfer JR. Toward methodology for detection of cancer-promoting S100A4 protein conformations in sub-nanomolar concentrations using Raman and SERS. J Phys Chem C. 2010;114:7274–7279. [Google Scholar]
- 65.Zhang H, Nestor CE, Zhao S, Lentini A, Bohle B, Benson M, Wang H. Profiling of human CD4+ T-cell subsets identifies the TH2-specific noncoding RNA GATA3-AS1. J Allergy Clin Immunol. 2013;132:1005–1008. doi: 10.1016/j.jaci.2013.05.033. [DOI] [PubMed] [Google Scholar]
- 66.Sönnichsen B, Koski L, Walsh A, Marschall P, Neumann B, Brehm M, Alleaume AM, Artelt J, Bettencourt P, Cassin E, Hewitson M, Holz C, Khan M, Lazik S, Martin C, Nitzsche B, Ruer M, Stamford J, Winzi M, Heinkel R, Röder M, Finell J, Häntsch H, Jones SJ, Jones M, Piano F, Gunsalus KC, Oegema K, Gönczy P, Coulson A, Hyman AA, Echeverri CJ. Full-genome RNAi profiling of early embryogenesis in Caenorhabditis elegans. Nature. 2005;434:462–469. doi: 10.1038/nature03353. [DOI] [PubMed] [Google Scholar]
Associated Data
This section collects any data citations, data availability statements, or supplementary materials included in this article.