

Abstract
Presence of fatty acid ethyl esters (FAEE), ethyl glucuronide (EtG), and ethyl sulfate (EtS) in meconium, the first neonatal feces, identifies maternal alcohol consumption during pregnancy. Current meconium alcohol marker assays require separate analyses for FAEE and EtG/EtS. We describe development and validation of the first quantitative liquid chromatography tandem mass spectrometry assay for 9 FAEEs, EtG, and EtS in 100 mg meconium. For the first time, these alcohol markers are analyzed in the same meconium aliquot, enabling comparison of the efficiency of gestational ethanol exposure detection. 100 mg meconium was homogenized in methanol and centrifuged. The supernatant was divided, and applied to two different solid phase extraction columns for optimized analyte recovery. Limits of quantification for ethyl laurate, myristate, linolenate, palmitoleate, arachidonate, linoleate, palmitate, oleate, and stearate ranged from 25–50 ng/g, with calibration curves to 2,500–5,000 ng/g. EtG and EtS linear dynamic ranges were 5–1,000 and 2.5–500 ng/g, respectively. Mean bias and between-day imprecision were <15 %. Extraction efficiencies were 51.2–96.5 %. Matrix effects ranged from −84.7 to 16.0 %, but were compensated for by matched deuterated internal standards when available. All analytes were stable (within ±20 % change from baseline) in 3 authentic positive specimens, analyzed in triplicate, after 3 freeze/thaw cycles (−20 °C). Authentic EtG and EtS also were stable after 12 h at room temperature and 72 h at 4 °C; some FAEE showed instability under these conditions, although there was large inter-subject variability. This novel method accurately detects multiple alcohol meconium markers and enables comparison of markers for maternal alcohol consumption.
Keywords: Meconium, Ethyl glucuronide, Fatty acid ethyl esters, Alcohol, Liquid chromatography-tandem mass spectrometry
Introduction
Maternal alcohol consumption during pregnancy is associated with fetal alcohol spectrum disorder (FASD) that encompasses growth retardation, craniofacial dysmorphology, cognitive disorders common and social impairments [1–3]. According to the 2012 National Survey on Drug Use and Health in the United States, 8.5 % of pregnant respondents 15–44 years old reported current alcohol use (≥1 drink in last 30 days), with 2.7 % reporting binge drinking (≥5 drinks/day once in past 30 days) [4]. Heavily alcohol-exposed children lacking syndromal craniofacial dysmorphology may still exhibit cognitive impairments [5, 6]. If an in utero alcohol exposure marker predicted poor infant outcomes, identified infants could be provided early access to FASD assistive services.
Most ingested ethanol (90–98 %) is oxidized to acetaldehyde in the liver [7, 8], with only a small percentage undergoing non-oxidative metabolism yielding fatty acid ethyl esters (FAEE), ethyl glucuronide (EtG), and ethyl sulfate (EtS), whose windows of drug detection are longer than ethanol. FAEE are formed by ethanol and endogenous free fatty acids esterification via FAEE synthases and acyl-CoA:ethanol acyltransferases primarily in the liver [9, 10]. Ethanol is converted to EtG and EtS following ethanol and glucuronic acid or activated sulfate conjugation by UDP-glucuronosyltransferases and sulphotransferases, respectively [11, 12].
The debate continues on which of these non-oxidative alcohol markers provides the most sensitive and specific detection of maternal alcohol consumption. Maternal self-reported alcohol consumption is frequently underreported due to societal disapproval of drinking while pregnant [13, 14]. Maternal blood or urine EtG or FAEE monitoring during pregnancy only identifies alcohol ingestion for a short period, requiring repeated sampling throughout gestation; however, identification early in pregnancy may help deter and prevent further fetal alcohol exposure. EtG is detected in blood for 10–14 h and urine for 25–44 h after 0.5 g/kg ethanol [15, 16]. FAEE remain elevated in blood for 16–30 h after the last drink in non-dependent individuals and 48–96 h in dependent individuals during detoxification [7, 17]. Meconium, the first neonatal feces, begins to form during gestational weeks 12–13, detecting drug exposure during the third and perhaps second trimesters [18]. Combining maternal self-reported alcohol consumption during pregnancy and meconium alcohol marker results improves detection of in utero alcohol exposure.
A major limitation of meconium alcohol marker assays is the requirement for two separate analyses to quantify FAEE [19–22] and EtG/EtS [19, 23, 24]. A combined extraction procedure from the same meconium aliquot would permit direct comparison of these markers’ ability to predict in utero exposure and provide more information for result interpretation due to the lack of homogeneity in meconium. We developed and validated the first quantitative liquid chromatography tandem mass spectrometry (LC-MS/MS) assay for 9 FAEEs, EtG, and EtS in 100 mg meconium. Our novel sample preparation approach permitted simultaneous extraction of all analytes from the same 100 mg meconium specimen. While two previous LC-MS/MS FAEE meconium methods are published [20, 22] and EtG and EtS are historically quantified by LC-MS/MS in all matrices, no method to date extracted all analytes from a single specimen aliquot.
Materials and methods
Meconium
Blank meconium pools were confirmed negative for all analytes at the assay’s limits of quantification (LOQs) prior to calibrator and quality control (QC) preparation. Method applicability and analyte stability were demonstrated by analyzing authentic positive meconium specimens.
Reagents
Ethyl laurate (E12:0), ethyl myristate (E14:0), ethyl palmitate (E16:0), ethyl palmitoleate (E16:1), ethyl stearate (E18:0), ethyl oleate (E18:1), ethyl linoleate (E18:2), ethyl linolenate (E18:3), and ethyl arachidonate (E20:4) were purchased from Cayman Chemical Company (Ann Arbor, MI). Available deuterated FAEE internal standards were obtained from Toronto Research Chemicals Inc (Toronto, Canada). EtG, EtS, EtG-d5, and EtS-d5 were acquired from Cerilliant Corporation (Round Rock, Texas). LCMS grade methanol and formic acid, HPLC grade acetonitrile, and ACS grade hydrochloric acid were from Fisher Scientific (Fair Lawn, NJ). Water was purified with an ELGA Purelab Ultra Scientific purifier (Siemens Water Technologies, Lowell, MA). Evolute-AX anion exchange solid-phase extraction (SPE) cartridges (100 mg/3 mL) and Isolute supported liquid extraction (SLE) columns (1 mg/6 mL) were purchased from Biotage (Charlotte, NC).
Instrumentation
Alcohol markers were quantified on an AB Sciex 5500 Qtrap® mass spectrometer equipped with a TurboV electrospray ionization (ESI) source (AB Sciex, Foster City, CA), interfaced to a Shimadzu UFLCXR system with two LC-20ADXR pumps, a CTO-20 AC column oven, and a SIL-20ACXR autosampler (Shimadzu Corporation, Columbia, MD). Analyst 1.5.1 was utilized for data acquisition and processing. SPE was performed with a CEREX-48 positive-pressure manifold (SPEware Corporation, Baldwin Park, CA).
Preparation of standard solutions
Individual ethanol FAEE standard solutions were diluted to 1 g/L in acetonitrile. Serial acetonitrile dilutions yielded 0.1, 0.2, 0.4, 2, 4, 10, and 20 mg/L FAEE working calibrator solutions. 100 mg blank meconium was fortified with 25 μL working calibrator solutions producing 25–5,000 ng/g calibrators. FAEE QC solutions were prepared in acetonitrile from different preparations than calibrators. Low, medium, and high QCs were prepared across the linear dynamic range for each analyte. Powdered deuterated FAEE standards were reconstituted in the manufacturer’s recommended solvent. A 0.4 mg/L FAEE working internal standard solution was prepared in acetonitrile by diluting 1.0 and 2.5 g/L stock solutions. Separate EtG and EtS calibrator, QC, and internal standard solutions were prepared in methanol. Standard EtG and EtS solutions were diluted to 100 mg/L. Serial dilutions in methanol created 0.01, 0.02, 0.1, 0.4, 1, 2, and 4 mg/L mixed working calibrator solutions. Three QCs were prepared across the linear dynamic range for each analyte. A 0.1 mg/L working internal standard solution was prepared by diluting 100 mg/L d5-EtG and d5-EtS solutions in methanol. All standard solutions were stored in amber glass vials at −20 °C.
Procedures
Sample preparation
Blank meconium (0.1±0.003 g) was weighed into a 1.5 mL microcentrifuge tube and fortified with calibrator or QC FAEE (25 μL) and EtG/EtS (25 μL) solutions. 25 μL internal standard solutions were added to calibrators, QCs, and authentic specimens. 25 μL acetonitrile and 25 μL methanol were added to authentic specimens to account for calibrator and QC preparations. 1 mL methanol was added and specimens homogenized with wooden applicator sticks, vortexed vigorously, and centrifuged at 18,000×g for 5 min at 4 °C. Supernatants were transferred to 16×100 mm conical polypropylene tubes. An additional 1 mL methanol was added, specimens were vortexed for 1 min, and centrifuged again. The supernatant was added to the previous aliquot and vortexed.
Solid phase extraction
900 μL supernatant was transferred to SLE + columns for FAEE extraction. After 5 min equilibration at ambient pressure, FAEE were eluted with 5 mL ethyl acetate into 16× 100 mm conical polypropylene tubes. Fine positive pressure was gradually applied to 2.4 L/min until 4 mL of final eluent was obtained. Samples were dried under nitrogen at 40 °C and reconstituted in 200 μL 75:25 mobile phase B:A (0.1 % formic acid in methanol (v/v): 0.1 % formic acid in water (v/v)). Samples were centrifuged for 5 min at 4,000×g at 4 °C, transferred to a 350 μL polypropylene 96-well plate, and 5 μL injected.
Meconium EtG and EtS were extracted by Biotage’s recommended urine procedure with minor modification [25]. 1.8 mL acetonitrile was added to the remaining meconium supernatant, specimens were vortexed, and decanted onto Evolute-AX columns pre-conditioned with 1.5 mL methanol, water, and acetonitrile. Columns were washed with 1.5 mL acetonitrile and methanol before eluting EtG and EtS into 15 mL conical polypropylene tubes with 4 mL 1 % hydrochloric acid in acetonitrile. Extracts were dried under nitrogen at 40 °C, reconstituted in 200 μL mobile phase A, centrifuged for 5 min at 11,500×g at 4 °C, and transferred to a polypropylene 96-well plate. 10 μL was injected.
LC-MS/MS
FAEE chromatographic separation was achieved on a Poroshell 120 EC-C8 column (2.1×150 mm, 2.7 μm) fitted with a 2.1×5 mm, 2.7 μm, Poroshell 120 C8 Fast Guard (Agilent Technologies, Santa Clara, CA). Gradient elution began with 82%B, increased to 90%B over 6 min, increased to 100%B over 1 min, held for 4 min, decreased to 82%B in 0.1 min, and held for 4 min. Total run time and flow were 15 min and 0.3 mL/min, respectively. LC eluent was diverted to waste for the first 4 min and final 4.2 min of analysis. EtG and EtS chromatographic separation was achieved using a Kinetex XB-C18 column (2.1× 100 mm, 2.6 μm) fitted with a 0.5 μm Krud Katcher Ultra UHPLC in-line filter (Phenomenex, Torrance, CA) with 0.3 mL/min flow rate. The gradient program started at 0%B, increased to 95%B over 3.6 min, held for 3.9 min, decreased to 0%B in 0.1 min, and held for 3.4 min; total run time was 10 min. LC eluent was diverted to waste for the final 6.5 min. Autosampler and column oven temperatures were 4 and 40ºC, respectively, for both methods.
Mass spectrometric data were acquired via positive and negative ESI for FAEE and EtG/EtS methods, respectively. Compound-specific MS/MS parameters were optimized via direct infusion of 10–200 μg/L reference solutions at 10 μL/ min in initial mobile phase conditions (Table 1). Optimized FAEE source parameters were as follows: 30 psi gas1, 35 psi gas2, 50 psi curtain gas, 500 °C source temperature, and 5,000 V ion spray voltage. Scheduled multiple reaction monitoring (MRM) scan mode was employed for FAEE and internal standards with a 60 s MRM window and a 0.7 s target scan time. EtG and EtS source parameters were 30 psi for gas1 and gas2, 50 psi curtain gas, 600 °C source temperature, and −3,500 V ion spray voltage. EtG, EtS, and internal standards were acquired in unscheduled MRM mode with dwell times of 30 msec. All experiments utilized unit resolution.
Table 1.
MS/MS parameters for alcohol markers in meconium
| Analyte | Q1 mass (m/z) |
Q3 mass (m/z) |
DP (V) |
CE (V) |
CXP (V) |
RT (min) |
Internal standard |
Q1 mass (m/z) |
Q3 mass (m/z) |
DP (V) |
CE (V) |
CXP (V) |
RT (min) |
|---|---|---|---|---|---|---|---|---|---|---|---|---|---|
| Ethyl laurate | 229.1 | 201.1 | 56 | 13 | 20 | 5.26 | Ethyl myristate-d5 | 262.2 | 230.3 | 81 | 15 | 16 | 6.85 |
| 229.1 | 88.9 | 56 | 19 | 14 | 262.2 | 103.9 | 81 | 19 | 12 | ||||
| Ethyl myristate | 257.2 | 229.2 | 85 | 15 | 20 | 6.89 | Ethyl myristate-d5 | 262.2 | 230.3 | 81 | 15 | 16 | 6.85 |
| 257.2 | 103 | 85 | 17 | 12 | 262.2 | 103.9 | 81 | 19 | 12 | ||||
| Ethyl linolenate | 307.1 | 81.0 | 71 | 33 | 12 | 7.08 | Ethyl linoleate-d5 | 314.2 | 263.3 | 81 | 13 | 20 | 7.97 |
| 307.1 | 261.3 | 71 | 13 | 20 | 314.2 | 245.2 | 81 | 15 | 16 | ||||
| Ethyl palmitoleate | 283.1 | 219.2 | 60 | 17 | 16 | 7.43 | Ethyl palmitate-d5 | 290.3 | 258.4 | 86 | 17 | 12 | 8.42 |
| 283.1 | 237.1 | 60 | 13 | 30 | 290.3 | 71.0 | 86 | 23 | 12 | ||||
| Ethyl arachidonate | 333.2 | 287.2 | 66 | 15 | 20 | 7.90 | Ethyl arachidonate-d5 | 338.4 | 287.3 | 96 | 13 | 20 | 7.88 |
| 333.2 | 90.9 | 66 | 57 | 10 | 338.4 | 91.0 | 96 | 59 | 14 | ||||
| Ethyl linoleate | 309.2 | 263.3 | 56 | 13 | 14 | 8.01 | Ethyl linoleate-d5 | 314.2 | 263.3 | 81 | 13 | 20 | 7.97 |
| 309.2 | 245.3 | 56 | 15 | 18 | 314.2 | 245.2 | 81 | 15 | 16 | ||||
| Ethyl palmitate | 285.1 | 257.3 | 41 | 15 | 22 | 8.45 | Ethyl palmitate-d5 | 290.3 | 258.4 | 86 | 17 | 12 | 8.42 |
| 285.1 | 71.1 | 41 | 21 | 34 | 290.3 | 71.0 | 86 | 23 | 12 | ||||
| Ethyl oleate | 311.2 | 265.3 | 100 | 15 | 24 | 8.69 | Ethyl oleate-d5 | 316.3 | 265.4 | 86 | 15 | 22 | 8.67 |
| 311.2 | 247.2 | 100 | 17 | 20 | 316.3 | 247.1 | 86 | 17 | 20 | ||||
| Ethyl stearate | 313.1 | 285.3 | 46 | 17 | 22 | 9.06 | Ethyl stearate-d5 | 318.3 | 286.2 | 56 | 17 | 22 | 9.05 |
| 313.1 | 71.1 | 46 | 25 | 10 | 318.3 | 71.1 | 56 | 25 | 10 | ||||
| Ethyl sulfate (EtS) | 124.9 | 96.9 | −50 | −22 | −9 | 1.38 | d5-EtS | 129.9 | 97.9 | −75 | −24 | −9 | 1.36 |
| 124.9 | 79.9 | −50 | −40 | −9 | 129.9 | 79.8 | −75 | −40 | −13 | ||||
| Ethyl glucuronide (EtG) | 221.0 | 75.0 | −60 | −22 | −7 | 2.14 | d5-EtG | 226.0 | 74.9 | −100 | −22 | −5 | 2.09 |
| 221.0 | 85.0 | −60 | −20 | −9 | 226.0 | 84.9 | −100 | −22 | −5 |
Bold font denotes quantifier transition. Entrance potential was ±10 V for all analytes
DP declustering potential, CE collision energy, CXP collision exit potential
Validation
Sensitivity, specificity, linearity, bias, imprecision, extraction efficiency, matrix effect, carryover, dilution integrity, and analyte stability were evaluated according to the Scientific Working Group for Forensic Toxicology guidelines [26].
Sensitivity was defined by limits of detection (LOD) and quantification (LOQ); decreasing concentrations of drug-fortified meconium were analyzed to empirically determine LOD and LOQ. LOD was evaluated in triplicate experiments with duplicates from different meconium sources and was defined as the lowest concentration with transition peak area ratios within 20 % of mean calibrator ratios, retention time within ±0.1 min of the mean calibrator retention time, and acceptable peak shape. LOQ also was evaluated in the same manner and defined as the lowest concentration meeting LOD criteria and measured concentration within ±20 % of target. Linearity was evaluated with calculation of a least squares regression line with 1/x2 weighting. Linearity assessment for each analyte utilized 6 concentrations on 5 separate days.
Specificity was evaluated by relative retention time within ±0.1 min of mean calibrator retention time and transition peak area ratios within ±20 % of mean calibrator peak area ratios for each analyte. Endogenous interferences were evaluated from 6 blank meconium pools fortified with internal standards. Interferences from common therapeutic and illicit drugs were evaluated by fortifying drugs into low QC samples. Potential interferents were tested at 10,000 ng/g including cocaine (COC), benzoylecgonine (BE), cocaethylene (CE), norCE, norCOC, norBE, m-hydroxyCOC, p-hydroxyCOC, m-hydroxyBE, p-hydroxyBE, ecgonine, ecgonine ethyl ester, ecgonine methyl ester, anhydroecgonine methyl ester, buprenorphine, norbuprenorphine, morphine, normorphine, morphine-3-glucuronide, morphine-6-glucuronide, codeine, norcodeine, 6-acetylcodeine, 6-acetylmorphine, oxymorphone, oxycodone, noroxymorphone, noroxycodone, hydromorphone, hydrocodone, propoxyphene, nicotine, nornicotine, norcotinine, cotinine, trans-3′-hydroxycotinine, methamphetamine, amphetamine, p-hydroxymethamphetamine, p-hydroxyamphetamine, p-methoxymethamphetamine, p-methoxyamphetamine, 4-hydroxy-3-methoxyamphetamine, 3-methoxymethamphetamine, 3,4-methylenedioxymethamphetamine, 3,4-methylene-dioxyethylamphetamine, 3,4-methylenedioxyamphetamine, 3,4-methylenedioxy-N-methyl-butanamine, cathinone, N-ethylamphetamine, 4-bromo-2,5-dimethoxyphenethylamine, imipramine, clomipramine, fluoxetine, norfluoxetine, paraxetine, clonidine, acetylsalicylic acid, ibuprofen, acetaminophen, pentazocine, caffeine, diphenhydramine, chlorpheniramine, brompheniramine, dextromethorphan, ketamine, phentermine, (±)-ephedrine, (±)-pseudoephedrine, methadone, 2-ethylidene-1,5-dimethyl-3,3-diphenylpyrrolidine, 2-ethyl-5-methyl-3,3-diphenylpyrroline, Δ9-tetrahydrocannabinol (THC), 11-hydroxy-THC, 11-nor-9-carboxy-THC, cannabinol, cannabidiol, alprazolam, bromazepam, clonazepam, 7-aminoclonazepam, diazepam, flunitrazepam, 7-aminoflunitrazepam, flurazepam, lorazepam, nitrazepam, 7-aminonitrazepam, nordiazepam, oxazepam, and temazepam. Potential interference from EtG, EtS, and FAEE at 10,000 ng/g also was tested in the respective methods.
Bias and between-run imprecision were determined from 4 replicates at 3 QC concentrations analyzed over 5 days with separate calibration curves (n=20). Bias was defined as percent deviation from expected concentration and was determined from overall mean QC concentrations compared to expected concentrations. Imprecision was expressed as % coefficient of variation (%CV) of target. Within-run imprecision was determined each day from 4 QC replicates and largest %CVs were reported.
Extraction efficiency and matrix effect were determined by post-extraction addition (n=5) [26, 27]. Three sets of samples were prepared. In set 1, five blank meconium sources were fortified with analytes and internal standards prior to homogenization. In set 2, different aliquots of the same 5 sources were extracted and fortified with analytes and internal standards after SLE or SPE. In the final set, analytes and internal standards were prepared in mobile phase. Extraction efficiency was calculated from mean analyte peak areas of set 1 divided by set 2 and expressed as a percentage. Matrix effect was assessed by dividing mean analyte peak areas from set 2 by set 3, converting to a percentage, and subtracting from 100. Positive and negative values indicate ion enhancement and suppression, respectively.
Carryover was assessed in triplicate by injecting extracted blank meconium with internal standards immediately after a sample containing analytes at twice the highest upper limit of linearity (ULOL). Absence of carryover was documented by failure of LOD criteria in blank meconium specimens. Dilution integrity (1/10) was assessed with 3 meconium specimens fortified with twice the ULOL and internal standards, and homogenized in methanol as previously described. After the final centrifugation, 400 μL supernatant was combined with 1,600 μL supernatant from meconium fortified with only internal standard.
Analyte stability during extraction was determined by fortifying blank meconium with each analyte individually at its ULOL prior to homogenization. Stability also was evaluated with triplicate blank meconium fortified at low and high QC concentrations stored for 12 h at room temperature, 72 h at 4 °C, and at −20 °C with 3 freeze/thaw cycles. Fortified stability specimen’s calculated concentrations were compared to target concentrations. Autosampler stability was assessed by reinjecting QC specimens after 72 h and comparing calculated concentrations to target based on initial calibration curves. Three authentic meconium specimens were analyzed in triplicate at baseline, and after 12 h at room temperature, 72 h at 4 °C, and 3 freeze/thaw cycles to demonstrate method applicability and assess authentic analyte stability.
Results
Simultaneous extraction refers to our simultaneous extraction of FAEE, EtG, and EtS from the same meconium aliquot, enabling a direct comparison of results. This is the first time all of these analytes were extracted from the same meconium aliquot. However, we were not able to achieve simultaneous LC separation and mass spectrometric detection. Two LC-MS/MS injections were required as initial experiments revealed FAEE autosampler instability in 50–100 % aqueous mobile phase; normal reverse phase columns require EtG and EtS to be in aqueous mobile phase as these polar analytes elute at low organic conditions. Initial experiments also indicated that separate LC columns with different chemistries offered the best peak shape and chromatographic separation from matrix components for all analytes. Ethyl stearate, oleate, linoleate, and palmitate did not elute until 100%B conditions were held for a substantial period on a C18 LC column, while EtS and EtG were minimally retained on a C8 column. A tailored LC approach, with 2 different LC columns and different autosampler mobile phase conditions was developed, achieving short run times and appropriate LOQs.
Six blank meconium sources contained no interfering peaks. None of 92 potential exogenous interferences fortified at 10,000 ng/g into low QC samples caused transition ratio or quantification criteria failure; additionally, FAEE did not interfere with low EtG and EtS QC samples, and EtG and EtS did not interfere with low FAEE QCs; all low QC samples had measured concentrations within ±20 % of target. FAEE LODs ranged from 15 to 50 ng/g and LOQs from 25 to 50 ng/g (Table 2). EtG and EtS LOQs were 5 and 2.5 ng/g, respectively (Table 2). Quantifier ion chromatograms are shown in Fig. 1. Linear ranges spanned 2–2.5 orders of magnitude for all analytes. All calibration curve correlation coefficients (R2) from least squares regression with 1/x2 weighting were >0.990. Percent bias and imprecision were evaluated with 4 replicates of 3 QC concentrations across the linear range over 5 days. Mean between-run bias was −2.0–12.3 % (n=20) and within-run bias −16.9–17.8 % (n=4) of target (Table 3). Between-run imprecision was 3.0–10.4 % and maximum within-run imprecision 3.4–14.2 % (Table 3).
Table 2.
Linearity, limits of detection (LOD) and quantification (LOQ) results for alcohol markers in meconium
| Analyte | LOD ng/g (nmol/g) | LOQ ng/g (nmol/g) | Linear range ng/g (nmol/g) | y-intercept (mean ± SD, n=5) | Slope (mean ± SD, n=5) | R2 (range, n=5) |
|---|---|---|---|---|---|---|
| Ethyl laurate | 50 (0.219) | 50 (0.219) | 50–5,000 (0.219–21.9) | −0.003±0.017 | 0.273±0.133 | 0.990–0.997 |
| Ethyl myristate | 25 (0.098) | 25 (0.098) | 25–5,000 (0.098–19.5) | 0.009±0.014 | 0.864±0.155 | 0.996–0.999 |
| Ethyl linolenate | 15 (0.049) | 25 (0.082) | 25–5,000 (0.082–16.3) | −0.007±0.012 | 1.081±0.236 | 0.997–1.000 |
| Ethyl palmitoleate | 15 (0.053) | 25 (0.088) | 25–5,000 (0.088–17.7) | −0.181±0.149 | 3.466±1.169 | 0.990–0.996 |
| Ethyl arachidonate | 15 (0.045) | 25 (0.075) | 25–2,500 (0.075–7.5) | 0.095±0.038 | 4.000±0.088 | 0.997–1.000 |
| Ethyl linoleate | 15 (0.049) | 25 (0.081) | 25–5,000 (0.081–16.2) | 0.040±0.017 | 0.905±0.029 | 0.997–0.999 |
| Ethyl palmitate | 50 (0.176) | 50 (0.176) | 50–5,000 (0.176–17.6) | 0.125±0.029 | 1.342±0.036 | 0.993–0.997 |
| Ethyl oleate | 15 (0.048) | 25 (0.081) | 25–5,000 (0.081–16.1) | 0.199±0.088 | 0.940±0.019 | 0.995–0.999 |
| Ethyl stearate | 50 (0.160) | 50 (0.160) | 50–5,000 (0.160–16.0) | 0.295±0.462 | 1.204±0.071 | 0.997–0.999 |
| Ethyl sulfate (EtS) | 2.5 (0.020) | 2.5 (0.020) | 2.5–500 (0.020–3.96) | 0.308±0.047 | 1.024±0.066 | 0.992–0.996 |
| Ethyl glucuronide (EtG) | 5 (0.023) | 5 (0.023) | 5–1,000 (0.023–4.51) | 0.446±0.096 | 1.240±0.250 | 0.995–1.000 |
Fig. 1.

Multiple reaction monitoring chromatograms for alcohol marker quantifier ions in a blank meconium fortified at analyte limits of quantification and in b authentic positive meconium specimens with concentrations of alcohol markers listed under the name of each marker
Table 3.
Mean bias and imprecision results for alcohol markers in meconium at 3 quality control concentrations
| Analyte | Concentration (ng/g) | Mean between- run bias (%, n=20) | Within-run bias range (%, n=4) | Between-run imprecision (%CV, n=20) | Maximum-within run imprecision (%CV, n=5) |
|---|---|---|---|---|---|
| Ethyl laurate | 150 | 0.3 | −16.7–17.3 | 11.3 | 11.6 |
| 750 | 2.1 | −16.1–17.3 | 11.5 | 18.0 | |
| 4,000 | −0.4 | −15.5–14.0 | 10.0 | 10.4 | |
| Ethyl myristate | 75 | 1.1 | −6.3–15.3 | 5.1 | 6.7 |
| 750 | 1.5 | −5.2–11.5 | 3.9 | 5.7 | |
| 4,000 | 3.5 | −8.8–12.0 | 4.7 | 7.4 | |
| Ethyl linolenate | 75 | 3.7 | −6.3–13.9 | 5.1 | 5.6 |
| 750 | 4.3 | −3.5–17.6 | 6.3 | 6.1 | |
| 4,000 | 0.5 | −10.5–17.3 | 7.8 | 5.7 | |
| Ethyl palmitoleate | 75 | −3.7 | −17.6–13.5 | 8.6 | 13.3 |
| 750 | 0.3 | −11.3–14.7 | 8.5 | 11.0 | |
| 4,000 | 3.9 | −14.5–15.0 | 8.7 | 11.4 | |
| Ethyl arachidonate | 75 | −2.0 | −8.7–5.7 | 4.1 | 4.2 |
| 750 | −0.1 | −4.5–7.1 | 3.0 | 3.4 | |
| 2,000 | −0.8 | −5.5–6.5 | 3.2 | 4.1 | |
| Ethyl linoleate | 75 | −0.3 | −11.1–8.9 | 5.4 | 7.1 |
| 750 | 1.0 | −5.9–11.7 | 5.0 | 3.5 | |
| 4,000 | 1.4 | −8.0–14.3 | 5.8 | 6.4 | |
| Ethyl palmitate | 150 | −0.4 | −16.7–16.0 | 10.4 | 14.2 |
| 750 | −1.5 | −12.9–11.6 | 6.3 | 6.1 | |
| 4,000 | 1.8 | −13.5–14.8 | 7.8 | 11.5 | |
| Ethyl oleate | 75 | 4.1 | −10.4–14.1 | 6.1 | 8.1 |
| 750 | 3.6 | −10.0–16.8 | 7.6 | 8.1 | |
| 4,000 | 4.7 | −8.8–16.8 | 7.8 | 8.3 | |
| Ethyl stearate | 150 | 7.3 | −4.0–16.0 | 5.6 | 6.5 |
| 750 | 0.9 | −10.3–14.5 | 7.1 | 8.7 | |
| 4,000 | 0.4 | −12.5–14.5 | 7.0 | 6.4 | |
| Ethyl sulfate (EtS) | 7.5 | −1.1 | −16.9–11.6 | 10.0 | 11.3 |
| 75 | 3.8 | −15.5–16.4 | 7.6 | 10.1 | |
| 450 | 12.3 | 2.2–16.4 | 3.4 | 6.0 | |
| Ethyl glucuronide (EtG) | 15 | 3.1 | −12.7–16.0 | 7.2 | 9.9 |
| 150 | 5.2 | −12.7–16.7 | 7.5 | 7.1 | |
| 900 | 11.6 | 3.0–17.8 | 3.6 | 4.1 |
All FAEEs demonstrated adequate extraction efficiency of 51.2–62.0 % (Table 4). FAEE matrix effects were −84.7–16.0 %; matched deuterated internal standards had similar matrix effects (−89.6–16.0 %). Extraction efficiencies for EtG and EtS were 84.1–96.5 % and 54.8–65.6 %, respectively (Table 4). EtG and EtS matrix effects were −76.0 to –35.3 %. Matched deuterated internal standards had similar matrix effects (−71.8 to −54.7 %). There was no carryover in negative specimens injected after samples containing twice the ULOL (n=3). Dilution integrity was acceptable; 10-fold dilution of specimens fortified with twice the ULOL showed a mean (range) 103 % (85–114) of expected concentrations.
Table 4.
Extraction efficiency and matrix effect for alcohol markers in meconium
| Analyte | Extraction efficiency (n=5)
|
Matrix effect (n=5)
|
||
|---|---|---|---|---|
| Lowa | Highb | Low | High | |
| Ethyl laurate | 51.2 % | 54.6 % | 12.5 % | −21.2 % |
| Ethyl myristate | 54.9 % | 56.0 % | 16.0 % | −3.2 % |
| Ethyl linolenate | 55.4 % | 59.6 % | −44.8 % | −41.3 % |
| Ethyl palmitoleate | 57.7 % | 62.0 % | −30.2 % | −46.4 % |
| Ethyl arachidonate | 54.8 % | 56.0 % | −33.5 % | −27.7 % |
| Ethyl linoleate | 56.8 % | 51.4 % | −58.7 % | −51.7 % |
| Ethyl palmitate | 52.9 % | 54.0 % | −52.6 % | −61.0 % |
| Ethyl oleate | 58.0 % | 52.6 % | −39.8 % | −56.9 % |
| Ethyl stearate | 60.6 % | 53.0 % | −72.1 % | −84.7 % |
| Ethyl sulfate (EtS) | 65.6 % | 54.8 % | −35.3 % | −57.4 % |
| Ethyl glucuronide (EtG) | 96.5 % | 84.1 % | −45.6 % | −76.0 % |
Low QC concentration was 150 ng/g for ethyl laurate, ethyl palmitate, and ethyl stearate; 75 ng/g for all other FAEE; 7.5 ng/g for EtS; and 15 ng/ g for EtG
High QC concentration was 4,000 ng/g for all FAEE, except 2,500 ng/g for ethyl arachidonate, 450 ng/g for EtS, and 900 ng/g for EtG
All analytes were −9.7–16.3 % of target when fortified at low and high QC concentrations for 12 h at room temperature, 72 h at 4 °C, and after 3 freeze/thaw cycles at −20 °C (Table 5). Extracted samples also were stable after 72 h on the 4 °C autosampler. Thirteen meconium specimens were screened to identify 3 authentic positive sources that contained as many analytes as possible for further stability experiments. In these 3 sources (Fig. 1b chromatograms), EtG and EtS concentrations were 26.8–541 ng/g and 6.5–7.6 ng/g, respectively. FAEE concentrations were generally 75–750 ng/g, although ethyl linoleate, palmitate, and oleate were higher. Figure 2 illustrates that all analytes were stable (<±20 % change in concentration) in authentic positive sources after 3 freeze/thaw cycles at −20 °C with mean (range) %baseline concentrations 103.2 % (87.6–115.1). Ethyl stearate, EtG, and EtS also were stable in authentic specimens after 12 h at room temperature and 72 h at 4 °C (Fig. 2). Other FAEE showed instability after storage at room temperature and refrigerated conditions, although there was large inter-subject variability. Across all analytes, mean (range) %baseline concentration was 79.5 % (42.5–108.1) after 12 h at room temperature and 71.7 % (32.4–109.3) after 72 h at 4 °C. Intra-subject variability was low as %CVs from triplicate analyses from each subject under each test condition were 0.7–17.6 %, and subjects with poor room temperature stability also showed poor refrigerated stability.
Table 5.
Stability (% difference, n=3) of fortified meconium specimens and extracted specimens on the autosampler
| Analyte | 12 h room temperature
|
72 h 4 °C
|
3 freeze/thaw cycles
|
72 h autosampler (4 °C)
|
||||
|---|---|---|---|---|---|---|---|---|
| Lowa | Highb | Low | High | Low | High | Low | High | |
| Ethyl laurate | 15.0 | −7.5 | 9.0 | 10.3 | 9.3 | 16.3 | −1.6 | −7.7 |
| Ethyl myristate | 0.8 | 3.5 | −4.9 | −2.6 | 1.6 | −1.8 | −0.2 | 2.7 |
| Ethyl linolenate | 6.7 | 4.4 | −0.6 | 6.0 | −1.1 | 2.4 | 2.1 | 1.8 |
| Ethyl palmitoleate | −0.1 | −2.6 | 1.8 | 8.3 | 7.0 | 13.3 | 10.8 | 11.5 |
| Ethyl arachidonate | −0.2 | −1.4 | −9.3 | −8.3 | −2.3 | −5.3 | −7.4 | −5.0 |
| Ethyl linoleate | 0.8 | 3.7 | −0.6 | −0.6 | −0.9 | −1.1 | 3.4 | 8.5 |
| Ethyl palmitate | 7.7 | −1.0 | −5.7 | −3.7 | −1.4 | −5.2 | −8.3 | 4.6 |
| Ethyl oleate | −7.4 | −5.8 | −4.9 | −9.7 | −3.6 | −2.6 | −8.6 | −6.5 |
| Ethyl stearate | −3.7 | −2.0 | −1.3 | −6.6 | −3.7 | −1.5 | 7.0 | −6.2 |
| Ethyl sulfate (EtS) | −9.0 | 11.0 | −2.2 | 13.7 | 5.0 | 12.3 | −7.8 | 13.3 |
| Ethyl glucuronide (EtG) | 3.7 | 7.3 | 4.9 | 12.3 | −3.5 | 12.0 | −3.8 | 11.0 |
Low QC concentration was 150 ng/g for ethyl laurate, ethyl palmitate, and ethyl stearate; 75 ng/g for all other FAEE; 7.5 ng/g for EtS; and 15 ng/g for EtG
High QC concentration was 4,000 ng/g for all FAEE, except 2,500 ng/g for ethyl arachidonate, 450 ng/g for EtS, and 900 ng/g for EtG
Fig. 2.
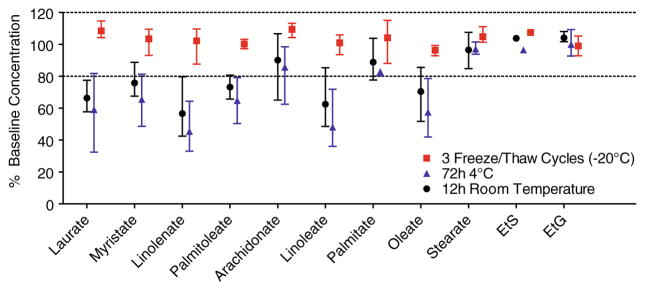
Mean (range) percent baseline concentrations after 3 freeze/thaw cycles, 72 h at 4 °C, and 12 h at room temperature in 3 authentic positive meconium specimens (1 positive EtS source, 2 positive ethyl palmitoleate sources). Triplicate specimens were analyzed under all test conditions, including baseline; %CVs from triplicate analyses ranged from 0.7 to 17.6 %
Discussion
A novel quantitative LC-MS/MS assay for 9 FAEEs, EtG, and EtS from 100 mg meconium was developed and validated. This method is highly useful to evaluate these markers alone and in combination for fetal alcohol exposure identification. This method also permits, for the first time, comparison of ethanol markers from the same meconium aliquot, and evaluation of the best marker to predict adverse neonatal and child outcomes associated with in utero alcohol exposure. Alternatives to FAEE or combined use of FAEE with EtG and EtS are increasingly recommended for meconium [19, 28–30] and hair [31, 32] testing to identify alcohol exposure.
A major limitation of current meconium alcohol marker assays is that two separate analyses for FAEE and EtG/EtS are required. Initially, we sought to develop a single sample preparation procedure for all analytes, investigating whether methods quantifying FAEE alone [22, 33] or EtG and EtS alone [23, 24, 34–36] could be modified for all analytes. Liquid-liquid extraction (LLE) with water, acetone, and hexane recovered FAEE in hexane [22, 33]; however, EtG and EtS were undetectable in the water-acetone layer due to severe matrix suppression. LLE with acetonitrile homogenization and hexane, allowed recovery of EtG and EtS from acetonitrile, but recovery was lower than with methanol homogenization. Acetonitrile also did not thoroughly homogenize meconium yielding highly variable, lower measured concentrations from authentic positive specimens compared to methanolic homogenization.
Initial experiments with aminopropyl SPE columns and combinations of published methods were evaluated including different loading conditions, followed by FAEE elution in hexane, further sample clean-up with various solvents, and finally EtG/EtS elution, to test whether a single SPE approach could be achieved for all analytes. None of the evaluated conditions sufficiently removed large matrix interferences affecting EtG and EtS. Clean Screen EtG columns (United Chemical Technologies, Bristol, PA) [34, 35] failed to retain EtS under all tested acidic loading conditions (10 % hydrochloric acid, trifluroacetic acid, acetic acid, and formic acid). An anion exchange approach [25, 37, 38], offered efficient sample clean-up and sufficient EtS extraction efficiency (Table 4), obtaining a low 2.5 ng/g LOQ. Lower EtS extraction efficiency compared to EtG was most likely due to strong sulfate group retention on the quaternary amine SPE phase [25]. FAEE performance was similar on SLE + and aminopropyl SPE columns; however, SLE + was selected because direct methanolic supernatant loading was possible without evaporation and reconstitution in hexane, as is required for aminopropyl columns [22, 33]. Our SLE + FAEE extraction efficiencies (51–62 %) were similar to aminopropyl SPE methods (45–95 %) [20, 22, 39] and to a recent SLE + application of nonpolar cannabinoids (34–41 %) [40]. Although this novel validated procedure utilizes 2 SPE approaches, its strength is quantification of all analytes in a single 100 mg meconium aliquot. Previous assays [20–22, 39, 41] required 0.5–1 g meconium for a more limited number of ethanol markers; this large meconium amount also frequently limits the number of other drugs that can be tested.
It was important to dilute FAEE standards in acetonitrile rather than ethanol, as fortified stability experiments with ethanol and ethanolic FAEE standards indicated artificial FAEE formation, described previously in tissue extracts [42] and meconium [43]. Triplicate blank meconium specimens fortified with ethanol and extracted after 72 h at 4 °C showed artificial formation of ethyl oleate >1,000 ng/g, ethyl linoleate and ethyl palmitate >250 ng/g, ethyl myristate >175 ng/g, and ethyl arachidonate, palmitoleate, and linolenate from 30 to 100 ng/g. The extent to which artificial FAEE formation occurs in vivo in meconium from EtOH produced through normal metabolism is unknown [43]. FAEE quantification in tissue extracts by Kinnunen and Lange suggested conversion of FAEE to fatty acid methyl esters in methanol [42]. However, stability of fortified QC samples was demonstrated after 72 h in methanolic reconstitution solvent (75 % methanol 0.1 % formic acid) suggesting no conversion of FAEE to fatty acid methyl esters in the autosampler over 3 days.
Internal standard selection for FAEE without commercially available matched deuterated analogs was determined by retention time and/or structural similarity in carbon chain length. The selected internal standards for these FAEE (ethyl laurate, linolenate, and palmitoleate) also showed similar extraction efficiencies and matrix effects between the d0 and d5 analytes.
Previous meconium FAEE, EtG, and EtS stability experiments consisted of 3–75 days fortified stability [21, 23], and repeat analysis of authentic specimens after 3–12 months at −20 °C [19, 22, 23]. Fortified FAEE stability by Moore et al. indicated FAEE instability at room temperature and refrigerated conditions; total FAEE were 35 % of total target concentration after 24 h at room temperature, and 75–80 % after 48–72 h refrigerated [21]. Earlier freeze/thaw stability experiments in authentic positive specimens showed FAEE, EtG, and EtS concentrations within 11 % of initial results [22, 23]. Previous study results were confirmed by our stability experiments in authentic specimens, documenting alcohol marker stability at −20 °C, and after 3 freeze/thaw cycles. We also showed that some FAEE are unstable at room temperature and 4 °C. Our fortified stability results contradicted these results. Fortified stability tests may not adequately mimic FAEE incorporation in authentic positive meconium, despite centrifugation of fortified FAEE into meconium prior to storage. This study demonstrated that EtG and EtS are more stable in room temperature and refrigerated authentic meconium than FAEE, and all markers were stable in frozen meconium, even after 3 freeze/thaw cycles. It is recommended that meconium is frozen immediately after collection to permit accurate FAEE quantification; however, when immediate freezing is not possible, EtG/EtS quantification is recommended.
In comparison to previously published methods, this new method achieves similar, and in some cases more sensitive, LOQs for EtG and FAEE in less meconium; previous FAEE methods required 0.5–1 g meconium [20–22, 41]. Our LOQ for EtS (2.5 ng/g) is slightly higher than Morini et al.’s LOQ of 1 ng/g [23]. Therefore, low EtS concentrations (<2.5 ng/g) may be undetectable by this new method. EtS is found in fewer meconium samples than EtG and concentrations are generally an order of magnitude lower than EtG. Utility of EtS meconium concentrations are still being discussed but work by Morini et al. suggests EtS may be useful in confirming diagnoses of prenatal alcohol exposure determined by EtG concentrations [44]. Our validated method also requires 100 rather than 200 mg meconium as described previously [23].
Future applications of this method will include determination of which markers, FAEE or EtG and EtS, are most sensitive and specific for identifying in utero alcohol exposure. Due to large variability in FAEE profiles in meconium, a summation of selected FAEE is recommended to determine maternal alcohol drinking during pregnancy. Zelner et al. also suggested that delayed meconium collection postnatally can result in false-positive FAEE tests, with cumulative concentrations above the 2 nmol/g cutoff [43]. FAEE also may be present in meconium from non-drinking women due to maternal diet [45], postnatal diet prior to stool collection [43], and ethanol-producing microorganisms in the fetal gastrointestinal tract [43]. Quantitative EtG and EtS measurement in meconium may not have these same limitations, although postnatal formation of EtG from ethanol produced by gut microorganisms may be possible as ethanol glucuronidation capacity develops postnatally [46, 47]. Although research on EtG and EtS meconium concentrations is more limited than FAEE, EtG and EtS may offer an alternative to FAEE. With a robust cutoff [19, 44, 45], EtG and EtS could offer similar in utero alcohol exposure detection rates, without the many FAEE false-positive issues. This novel validated meconium method for simultaneous extraction of FAEE, EtG, and EtS will be helpful for investigation of many issues surrounding the best markers to identify in utero alcohol exposure.
Conclusion
Meconium biomarkers provide objective confirmation of in utero drug exposure. However, in the case of alcohol exposure, meconium alcohol markers must be accurately interpreted because markers may be present in infant meconium from non-drinking women. Recent studies shed light on limitations associated with meconium FAEE, including association with maternal diet and timing of collection postnatally. Additional research is needed to understand the advantages and limitations of meconium FAEE and EtG/EtS, and determine which markers best correlate with maternal drinking behavior and predict neonatal outcomes associated with FASD. This novel validated LC-MS/MS method quantifying 9 FAEE, EtG, and EtS in 100 mg meconium will be applied to further investigate the important public health issue of maternal gestational alcohol intake.
References
- 1.Burd L, Klug MG, Martsolf JT, Kerbeshian J. Fetal alcohol syndrome: neuropsychiatric phenomics. Neurotoxicol Teratol. 2003;25(6):697–705. doi: 10.1016/j.ntt.2003.07.014. [DOI] [PubMed] [Google Scholar]
- 2.Greenbaum RL, Stevens SA, Nash K, Koren G, Rovet J. Social cognitive and emotion processing abilities of children with fetal alcohol spectrum disorders: a comparison with attention deficit hyperactivity disorder. Alcohol Clin Exp Res. 2009;33(10):1656–1670. doi: 10.1111/j.1530-0277.2009.01003.x. [DOI] [PubMed] [Google Scholar]
- 3.Jones KL, Smith DW, Ulleland CN, Streissguth P. Pattern of malformation in offspring of chronic alcoholic mothers. Lancet. 1973;1(7815):1267–1271. doi: 10.1016/s0140-6736(73)91291-9. [DOI] [PubMed] [Google Scholar]
- 4.Substance Abuse and Mental Health Services Administration. NSDUH Series H-46, HHS Publication No. (SMA) 13-4795. Substance Abuse and Mental Health Services Administration; Rockville: 2013. Results from the 2012 National Survey on Drug Use and Health: Summary of National Findings. [Google Scholar]
- 5.Suttie M, Foroud T, Wetherill L, Jacobson JL, Molteno CD, Meintjes EM, Hoyme HE, Khaole N, Robinson LK, Riley EP, Jacobson SW, Hammond P. Facial dysmorphism across the fetal alcohol spectrum. Pediatrics. 2013;131(3):e779–e788. doi: 10.1542/peds.2012-1371. [DOI] [PMC free article] [PubMed] [Google Scholar]
- 6.Mattson SN, Riley EP, Gramling L, Delis DC, Jones KL. Heavy prenatal alcohol exposure with or without physical features of fetal alcohol syndrome leads to IQ deficits. J Pediatr. 1997;131(5):718–721. doi: 10.1016/s0022-3476(97)70099-4. [DOI] [PubMed] [Google Scholar]
- 7.Borucki K, Schreiner R, Dierkes J, Jachau K, Krause D, Westphal S, Wurst FM, Luley C, Schmidt-Gayk H. Detection of recent ethanol intake with new markers: comparison of fatty acid ethyl esters in serum and of ethyl glucuronide and the ratio of 5-hydroxytryptophol to 5-hydroxyindole acetic acid in urine. Alcohol Clin Exp Res. 2005;29(5):781–787. doi: 10.1097/01.alc.0000164372.67018.ea. [DOI] [PubMed] [Google Scholar]
- 8.Albermann ME, Musshoff F, Madea B. A high-performance liquid chromatographic-tandem mass spectrometric method for the determination of ethyl glucuronide and ethyl sulfate in urine validated according to forensic guidelines. J Chromatogr Sci. 2012;50(1):51–56. doi: 10.1093/chromsci/bmr012. [DOI] [PMC free article] [PubMed] [Google Scholar]
- 9.Laposata M. Fatty acid ethyl esters: nonoxidative ethanol metabolites with emerging biological and clinical significance. Lipids. 1999;34(Suppl):S281–S285. doi: 10.1007/BF02562318. [DOI] [PubMed] [Google Scholar]
- 10.Treloar T, Madden LJ, Winter JS, Smith JL, de Jersey J. Fatty acid ethyl ester synthesis by human liver microsomes. Biochim Biophys Acta. 1996;1299(2):160–166. doi: 10.1016/0005-2760(95)00199-9. [DOI] [PubMed] [Google Scholar]
- 11.Foti RS, Fisher MB. Assessment of UD P -glucuronosyltransferase catalyzed formation of ethyl glucuronide in human liver microsomes and recombinant UGTs. Forensic Sci Int. 2005;153(2–3):109–116. doi: 10.1016/j.forsciint.2004.12.003. [DOI] [PubMed] [Google Scholar]
- 12.Schneider H, Glatt H. Sulpho-conjugation of ethanol in humans in vivo and by individual sulphotransferase forms in vitro. Biochem J. 2004;383(Pt. 3):543–549. doi: 10.1042/BJ20040925. [DOI] [PMC free article] [PubMed] [Google Scholar]
- 13.Ernhart CB, Morrowtlucak M, Sokol RJ, Martier S. Underreporting of alcohol use in pregnancy. Alcohol Clin Exp Res. 1988;12(4):506–511. doi: 10.1111/j.1530-0277.1988.tb00233.x. [DOI] [PubMed] [Google Scholar]
- 14.Sokol RJ, Martier S, Ernhart C. Identification of alcohol abuse in the prenatal clinic. In: Chang NC, Chao M, editors. Early identification of alcohol abuse. Alcohol, Drug Abuse, and Mental Health Administration Research; Rockville: 1983. pp. 209–227. Monograph No. 17. [Google Scholar]
- 15.Halter CC, Dresen S, Auwaerter V, Wurst FM, Weinmann W. Kinetics in serum and urinary excretion of ethyl sulfate and ethyl glucuronide after medium dose ethanol intake. Int J Legal Med. 2008;122(2):123–128. doi: 10.1007/s00414-007-0180-8. [DOI] [PubMed] [Google Scholar]
- 16.Hoiseth G, Bernard JP, Karinen R, Johnsen L, Helander A, Christophersen AS, Morland J. A pharmacokinetic study of ethyl glucuronide in blood and urine: applications to forensic toxicology. Forensic Sci Int. 2007;172(2–3):119–124. doi: 10.1016/j.forsciint.2007.01.005. [DOI] [PubMed] [Google Scholar]
- 17.Borucki K, Dierkes J, Wartberg J, Westphal S, Genz A, Luley C. In heavy drinkers, fatty acid ethyl esters remain elevated for up to 99 hours. Alcohol Clin Exp Res. 2007;31(3):423–427. doi: 10.1111/j.1530-0277.2006.00323.x. [DOI] [PubMed] [Google Scholar]
- 18.Gray T, Huestis M. Bioanalytical procedures for monitoring in utero drug exposure. Anal Bioanal Chem. 2007;388(7):1455–1465. doi: 10.1007/s00216-007-1228-9. [DOI] [PMC free article] [PubMed] [Google Scholar]
- 19.Bakdash A, Burger P, Goecke TW, Fasching PA, Reulbach U, Bleich S, Hastedt M, Rothe M, Beckmann MW, Pragst F, Kornhuber J. Quantification of fatty acid ethyl esters (FAEE) and ethyl glucuronide (EtG) in meconium from newborns for detection of alcohol abuse in a maternal health evaluation study. Anal Bioanal Chem. 2010;396(7):2469–2477. doi: 10.1007/s00216-010-3474-5. [DOI] [PubMed] [Google Scholar]
- 20.Kwak HS, Kang YS, Han KO, Moon JT, Chung YC, Choi JS, Han JY, Kim MY, Velazquez-Armenta EY, Nava-Ocampo AA. Quantitation of fatty acid ethyl esters in human meconium by an improved liquid chromatography/tandem mass spectrometry. J Chromatogr B Anal Technol Biomed Life Sci. 2010;878(21):1871–1874. doi: 10.1016/j.jchromb.2010.05.001. [DOI] [PubMed] [Google Scholar]
- 21.Moore C, Jones J, Lewis D, Buchi K. Prevalence of fatty acid ethyl esters in meconium specimens. Clin Chem. 2003;34(1):133–136. doi: 10.1373/49.1.133. [DOI] [PubMed] [Google Scholar]
- 22.Pichini S, Pellegrini M, Gareri J, Koren G, Garcia-Algar O, Vall O, Vagnarelli F, Zuccaro P, Marchei E. Liquid chromatography-tandem mass spectrometry for fatty acid ethyl esters in meconium: assessment of prenatal exposure to alcohol in two European cohorts. J Pharm Biomed Anal. 2008;48(3):927–933. doi: 10.1016/j.jpba.2008.07.026. [DOI] [PubMed] [Google Scholar]
- 23.Morini L, Marchei E, Pellegrini M, Groppi A, Stramesi C, Vagnarelli F, Garcia-Algar O, Pacifici R, Pichini S. Liquid chromatography with tandem mass spectrometric detection for the measurement of ethyl glucuronide and ethyl sulfate in meconium: new biomarkers of gestational ethanol exposure? Ther Drug Monit. 2008;30(6):725–732. doi: 10.1097/FTD.0b013e31818b2fd9. [DOI] [PubMed] [Google Scholar]
- 24.Tarcomnicu I, van Nuijs AL, Aerts K, De Doncker M, Covaci A, Neels H. Ethyl glucuronide determination in meconium and hair by hydrophilic interaction liquid chromatography-tandem mass spectrometry. Forensic Sci Int. 2010;196(1–3):121–127. doi: 10.1016/j.forsciint.2009.12.043. [DOI] [PubMed] [Google Scholar]
- 25.Jones R, Williams L, Senior A, Davies G, Lodder H, Jordan S, Vandell V, Jones G, Desbrow C. Evaluation of SPE strategies for the simultaneous extraction of ethyl glucuronide and ethyl sulfate prior to LC-MS/MS analysis. Society of Forensic Toxicologists 2012 Annual Meeting; Boston, MA, USA. 2012. Poster available at http://appnotes.biotage.com/filearea/appnotes/120/SOFT_EVOLUTE-EtG-EtS_FinalPN45.pdf. [Google Scholar]
- 26.Scientific Working Group for Forensic Toxicology. Scientific Working Group for Forensic Toxicology (SWGTOX) standard practices for method validation in forensic toxicology. J Anal Toxicol. 2013;37(7):452–474. doi: 10.1093/jat/bkt054. [DOI] [PubMed] [Google Scholar]
- 27.Matuszewski BK, Constanzer ML, Chavez-Eng CM. Strategies for the assessment of matrix effect in quantitative bioanalytical methods based on HPLC-MS/MS. Anal Chem. 2003;75(13):3019–3030. doi: 10.1021/ac020361s. [DOI] [PubMed] [Google Scholar]
- 28.Joya X, Friguls B, Ortigosa S, Papaseit E, Martinez SE, Manich A, Garcia-Algar O, Pacifici R, Vall O, Pichini S. Determination of maternal-fetal biomarkers of prenatal exposure to ethanol: a review. J Pharm Biomed Anal. 2012;69:209–222. doi: 10.1016/j.jpba.2012.01.006. [DOI] [PubMed] [Google Scholar]
- 29.Morini L, Marchei E, Vagnarelli F, Garcia Algar O, Groppi A, Mastrobattista L, Pichini S. Ethyl glucuronide and ethyl sulfate in meconium and hair-potential biomarkers of intrauterine exposure to ethanol. Forensic Sci Int. 2010;196(1–3):74–77. doi: 10.1016/j.forsciint.2009.12.035. [DOI] [PubMed] [Google Scholar]
- 30.Pichini S, Morini L, Marchei E, Palmi I, Rotolo MC, Vagnarelli F, Garcia-Algar O, Vall O, Zuccaro P. Ethylglucuronide and ethylsulfate in meconium to assess gestational ethanol exposure: preliminary results in two Mediterranean cohorts. Can J Clin Pharmacol. 2009;16(2):e370–e375. [PubMed] [Google Scholar]
- 31.Albermann ME, Musshoff F, Madea B. Comparison of ethyl glucuronide (EtG) and fatty acid ethyl esters (FAEEs) concentrations in hair for testing abstinence. Anal Bioanal Chem. 2011;400(1):175–181. doi: 10.1007/s00216-010-4443-8. [DOI] [PubMed] [Google Scholar]
- 32.Pragst F, Yegles M. Determination of fatty acid ethyl esters (FAEE) and ethyl glucuronide (EtG) in hair: a promising way for retrospective detection of alcohol abuse during pregnancy? Ther Drug Monit. 2008;30(2):255–263. doi: 10.1097/FTD.0b013e318167d602. [DOI] [PubMed] [Google Scholar]
- 33.Moore CM, Lewis D. Fatty acid ethyl esters in meconium: biomarkers for the detection of alcohol exposure in neonates. Clin Chim Acta. 2001;312(1–2):235–237. doi: 10.1016/s0009-8981(01)00628-3. [DOI] [PubMed] [Google Scholar]
- 34.Kronstrand R, Brinkhagen L, Nystrom FH. Ethyl glucuronide in human hair after daily consumption of 16 or 32 g of ethanol for 3 months. Forensic Sci Int. 2012;215(1–3):51–55. doi: 10.1016/j.forsciint.2011.01.044. [DOI] [PubMed] [Google Scholar]
- 35.Matlow JN, Lubetsky A, Aleksa K, Berger H, Koren G. The transfer of ethyl glucuronide across the dually perfused human placenta. Placenta. 2013;34(4):369–373. doi: 10.1016/j.placenta.2012.12.016. [DOI] [PubMed] [Google Scholar]
- 36.Shah R, Lacourse WR. An improved method to detect ethyl glucuronide in urine using reversed-phase liquid chromatography and pulsed electrochemical detection. Anal Chim Acta. 2006;576(2):239–245. doi: 10.1016/j.aca.2006.06.017. [DOI] [PubMed] [Google Scholar]
- 37.Zheng Y, Helander A. Solid-phase extraction procedure for ethyl glucuronide in urine. J Anal Toxicol. 2008;32(9):778–781. doi: 10.1093/jat/32.9.778. [DOI] [PubMed] [Google Scholar]
- 38.Jones J, Jones M, Plate C, Lewis D. The detection of 1-palmitoyl-2-oleoyl-sn-glycero-3-phosphoethanol and ethyl glucuronide in human umbilical cord. Am J Anal Chem. 2012;3:800–810. [Google Scholar]
- 39.Bernhardt TG, Cannistraro PA, Bird DA, Doyle KM, Laposata M. Purification of fatty acid ethyl esters by solid-phase extraction and high-performance liquid chromatography. J Chromatogr B Biomed Appl. 1996;675(2):189–196. doi: 10.1016/0378-4347(95)00387-8. [DOI] [PubMed] [Google Scholar]
- 40.Scheidweiler KB, Desrosiers NA, Huestis MA. Simultaneous quantification of free and glucuronidated cannabinoids in human urine by liquid chromatography tandem mass spectrometry. Clin Chim Acta. 2012;413(23–24):1839–1847. doi: 10.1016/j.cca.2012.06.034. [DOI] [PMC free article] [PubMed] [Google Scholar]
- 41.Bearer CF, Lee S, Salvator AE, Minnes S, Swick A, Yamashita T, Singer LT. Ethyl linoleate in meconium: a biomarker for prenatal ethanol exposure. Alcohol Clin Exp Res. 1999;23(3):487–493. [PMC free article] [PubMed] [Google Scholar]
- 42.Kinnunen PM, Lange LG. Identification and quantitation of fatty acid ethyl esters in biological specimens. Anal Biochem. 1984;140(2):567–576. doi: 10.1016/0003-2697(84)90208-2. [DOI] [PubMed] [Google Scholar]
- 43.Zelner I, Hutson JR, Kapur BM, Feig DS, Koren G. False-positive meconium test results for fatty acid ethyl esters secondary to delayed sample collection. Alcohol Clin Exp Res. 2012;36(9):1497–1506. doi: 10.1111/j.1530-0277.2012.01763.x. [DOI] [PubMed] [Google Scholar]
- 44.Morini L, Groppi A, Marchei E, Vagnarelli F, Algar OG, Zuccaro P, Pichini S. Population baseline of meconium ethyl glucuronide and ethyl sulfate concentrations in newborns of nondrinking women in 2 Mediterranean cohorts. Ther Drug Monit. 2010;32(3):359–363. doi: 10.1097/FTD.0b013e3181d5f14a. [DOI] [PubMed] [Google Scholar]
- 45.Chan D, Bar-Oz B, Pellerin B, Paciorek C, Klein J, Kapur B, Farine D, Koren G. Population baseline of meconium fatty acid ethyl esters among infants of nondrinking women in Jerusalem and Toronto. Ther Drug Monit. 2003;25(3):271–278. doi: 10.1097/00007691-200306000-00004. [DOI] [PubMed] [Google Scholar]
- 46.Coughtrie MW, Burchell B, Leakey JE, Hume R. The inadequacy of perinatal glucuronidation: immunoblot analysis of the developmental expression of individual UDP-glucuronosyltransferase isoenzymes in rat and human liver microsomes. Mol Pharmacol. 1988;34(6):729–735. [PubMed] [Google Scholar]
- 47.Onishi S, Kawade N, Itoh S, Isobe K, Sugiyama S. Postnatal development of uridine diphosphate glucuronyltransferase activity towards bilirubin and 2-aminophenol in human liver. Biochem J. 1979;184(3):705–707. doi: 10.1042/bj1840705. [DOI] [PMC free article] [PubMed] [Google Scholar]