

Abstract
Purpose
High RPE iron levels have been associated with age-related macular degeneration. Mutation of the ferroxidase ceruloplasmin leads to RPE iron accumulation and degeneration in patients with aceruloplasminemia; mice lacking ceruloplasmin and its homolog hephaestin have a similar RPE degeneration. To determine whether a high iron diet (HID) could cause RPE iron accumulation, possibly contributing to RPE oxidative stress in AMD, we tested the effect of dietary iron on mouse RPE iron.
Methods
Male CD1 strain mice were fed either a standard iron diet (SID) or the same diet with extra iron added (HID) for either 3 months or 10 months. Mice were analyzed with immunofluorescence and Perls' histochemical iron stain to assess iron levels. Levels of ferritin, transferrin receptor, and oxidative stress gene mRNAs were measured by quantitative PCR (qPCR) in neural retina (NR) and isolated RPE. Morphology was assessed in plastic sections.
Results
Ferritin immunoreactivity demonstrated a modest increase in the RPE in 10-month HID mice. Analysis by qPCR showed changes in mRNA levels of iron-responsive genes, indicating moderately increased iron in the RPE of 10-month HID mice. However, even by age 18 months, there was no Perls' signal in the retina or RPE and no retinal degeneration.
Conclusions
These findings indicate that iron absorbed from the diet can modestly increase the level of iron deposition in the wild-type mouse RPE without causing RPE or retinal degeneration. This suggests regulation of retinal iron uptake at the blood-retinal barriers.
Keywords: iron overload, hemochromatosis, retinal damage, retinal degeneration, oxidation, free radical, retinal pigment epithelium, metabolism, AMD
Iron absorbed from the diet can modestly increase the level of iron deposition in the WT mouse RPE without causing RPE or retinal degeneration. This has relevance to the basic science of iron uptake across the blood retinal barrier and implications for clinical diet studies.
Iron is a mineral that is present in food, dietary supplements, and is essential for normal cellular metabolism.1 Dietary iron can be found in heme or nonheme (inorganic) forms.1,2 Plants and iron-fortified products have only nonheme iron. Meat, poultry, and seafood have both heme and nonheme iron. A standard adult diet requires approximately 3 to 4 g of elemental iron; 2.5 g of this iron is used in the synthesis of hemoglobin, and the remainder is stored as ferritin in the bone marrow, liver, and spleen.1,2 Ultimately, once heme and nonheme iron are absorbed by the intestinal lumen, both dietary sources contribute to a general pool of iron.
Dietary iron supplementation is a common therapy that is used to treat individuals who suffer from iron deficiency anemia (IDA). Clinically, IDA is defined as a hemoglobin concentration that is lower than 13 g/dL in men and 12 g/dL in women.1 Iron deficiency causes the body to increase its absorptive abilities to facilitate uptake of all available dietary iron.1
Conversely, too much iron can be harmful. We have observed that there are elevated iron levels in the retinal pigment epithelium (RPE) of patients with age-related macular degeneration (AMD).3 A patient with aceruloplasminemia, which caused retinal iron overload, had a maculopathy that resembles AMD with onset in his early 40s. Several additional lines of evidence suggest iron dysregulation could contribute to the pathogenesis of AMD.3–14 The mechanisms of this iron accumulation in AMD are incompletely understood.
In the intestines, nonheme iron is absorbed by divalent metal transporter (DMT1).1,2 Divalent metal transporter imports only ferrous iron (Fe2+); however, most nonheme iron that enters the duodenum is in the ferric (Fe3+) form.1,2 Thus, intestinal brush border ferric reductases, such as duodenal cytochrome B (Dcytb) or ascorbic acid are needed to convert Fe3+ to Fe2+. Once in the enterocyte, iron is either stored as ferritin or exported into the circulation.1,2
Ferroportin (Fpn), the only known cellular iron exporter, is located on the basal membrane of the enterocyte.6 Ferrous iron is exported into the circulation through Fpn, and subsequently oxidized to its ferric form by membrane bound ferroxidases such as ceruloplasmin (Cp), hephaestin (Heph), or zyklopen (Zp). This oxidation promotes iron export.6,7,15,16 Transferrin (Tf), an iron-binding glycoprotein, binds to Fe3+ and facilitates its systemic distribution in the blood stream. Transferrin bound iron (TBI) is internalized by cells when it binds to membrane bound transferrin receptor 1 (TfR1), leading to receptor-mediated endocytosis.17 Once inside the acidified endosome, iron is released from Tf and reduced to Fe2+. Iron is exported from the endosome by DMT1 to enter the cytosol.17
Non-TBI (NTBI) is classified as iron unbound to transferrin, heme, or ferritin.18 This form of iron is produced in pathological states of iron overload (e.g., hereditary hemochromatosis, transfusion-dependent beta-thalassemia). Once iron saturates all available transferrin in the blood, NTBI begins to accumulate. It is subsequently imported into the cell by way of DMT1/ZIP14. Zrt–Irt-like protein 14 (ZIP14), a zinc transporter, is the other main transporter involved in NTBI uptake by hepatocytes and possibly other organs.19
Ferroxidases play an important role in diminishing the potential oxidative stress burden that unregulated Fe2+ can promote. This is well exemplified in mice that have combined deficiency of Cp and Heph.11 These double knockout mice develop age dependent iron accumulation in the neural retina (NR) and RPE and subsequent iron induced retinal toxicity.3,11 The RPE becomes hypertrophic, autofluorescent, and dysplastic.
Hepcidin (Hepc), a liver-synthesized peptide hormone, is expressed in the retina20 and can limit cellular iron export by triggering Fpn degradation.8,21 The transcription of Hepc is upregulated by bone morphogenic protein 6 (Bmp6).22 Both Bmp6 and Hepc knockout mice develop retinal iron accumulation and retinal degeneration,8 as do mice with knockout of hemojuvelin (Hjv), another Hepc-regulatory gene.23
Amyloid-beta precursor protein (App) is an iron regulatory protein that promotes iron export by binding to, and stabilizing, Fpn.24 It is also regulated by iron, and elevated intracellular iron levels cause an increase APP translation.15,16 Furthermore, chronic iron overload increases the byproduct of APP processing, generating toxic Aβ species.15,16,25
In the present study, we investigated whether dietary nonheme iron supplementation could increase iron levels in the NR and the RPE, potentially promoting retinal degeneration. Alternatively, local iron regulatory mechanisms might protect the retina from the high serum iron.
Materials and Methods
Animals
CD1 strain male 2-month-old wild-type mice were fed a diet with an additional 20,000 ppm, 2% iron carbonyl (catalog number TD.110255, Harlan Teklad, Madison, WI, USA) compared to mice fed the same diet without the additional carbonyl iron (normal iron in feed is 270 ppm) for 3, 10, or 16 months. The mice in this study, both control and experimental, were started on a standard iron diet (SID) from weaning at 3 weeks until the age of 2 months. At 2 months, the mice are fully mature; this is particularly important because we wanted to test the effects of a high iron diet (HID) on age-related changes, rather than eye development. After 2 months, the experimental mice were divided further into acute and chronic iron exposure groups. Both groups were fed an HID, but the acute group was killed at 5 months (totaling a 3-month exposure to an HID, “3-month HID”), and the chronic group was killed at 12 months (totaling a 10-month exposure to an HID, “10-month HID”) or 18 months. Immediately after this period, the mice were killed and tissues were studied as detailed below. Mice were maintained in a temperature-controlled room at 21 to 23°C. Experimental procedures were performed in accordance with the Association for Research in Vision and Ophthalmology (ARVO) Statement for the Use of Animals in Ophthalmic and Vision Research. The animal care review board of the University of Pennsylvania (Philadelphia, PA, USA) approved all protocols. The eyes were enucleated immediately after death and were fixed overnight in 4% paraformaldehyde for immunofluorescence and morphological analysis.
Quantitative Iron Detection
Samples of the liver, heart, and brain were placed in separate tubes, and total nonheme iron was quantified using the bathophenanthroline (BPS) spectrophotometric protocol described by Torrance and Bothwell.26 Briefly, snap frozen tissue was digested overnight at 65°C in acid digest solution (0.1% trichloroacetic acid and 0.03 M HCl). Following digestion, samples were centrifuged, and the supernatant (20 μL) was added to 1 mL of chromagen reagent (2.25 M sodium acetate pretreated with Chelex 100, 0.01% bathophenanthroline, and 0.1% thioglycolic acid). The absorbances were read at 535 nm. Iron levels were calculated by comparing absorbances of tissue-chromagen samples to serial dilutions of iron standard (Sigma-Aldrich Corp., St. Louis, MO, USA).
Perls' Prussian Blue Stain for Iron
Plastic sections were stained with 5% K4Fe(CN)6 and 5% HCl in the dark for 45 minutes at 65°C as we have described.11
Morphological Preparation
Enucleated eyes were immersion fixed in 2% paraformaldehyde and 2% glutaraldehyde, and eye cups were made by dissecting away the cornea and lens. The tissues were then dehydrated in increasing concentrations of ethanol, infiltrated overnight, and embedded the next day in plastic (JB4; Polysciences, Inc., Warrington, PA, USA). For standard histology, 3-μm-thick plastic sections were cut in the sagittal plane and were toluidine blue stained by incubation of the sections in 1% toluidine blue O and 1% sodium tetraborate decahydrate (Sigma-Aldrich Corp.) for 5 seconds. Stained sections were observed and photographed using bright-field illumination (model TE300; Nikon, Tokyo, Japan).
Immunolabeling
Mouse globes fixed in 4% paraformaldehyde were rinsed in PBS, and the eyecups were dissected. The eyecups were cryoprotected in 30% sucrose solution overnight then embedded in optimal cutting temperature compound (Tissue-Tek; Sakura Finetek, Torrance, CA, USA) and slowly frozen in 2-methylbutane on dry ice. Immunofluorescence was performed on sections of 10-μm thickness, as described previously.14 Primary antibody used was rabbit anti-L-ferritin (E17) at 1:200 dilution (kind gift from Paolo Arosio, University of Brescia). Control sections were treated identically, except that primary antibodies were omitted. Sections were analyzed by fluorescence microscopy with identical exposure parameters using a Nikon TE300 microscope equipped with ImagePro Plus version 6.1 software (Media Cybernetics, Inc., Bethesda, MD, USA).
RPE Isolation
Purified RPE cells were isolated by removing the anterior segment (cornea, iris, and lens) from enucleated mouse eyes after a two-step digestion. The eyes were incubated at 37°C for 40 minutes in 2% w/v dispase in 1× Hanks' balanced salt solution (HBSS) with Ca2+ and Mg2+ (HBSS+; Invitrogen, Carlsbad, CA, USA). After digestion with dispase, slits were made in the cornea with a scalpel blade, and the eyes were incubated for an additional 10 minutes in 1 mg/mL hyaluronidase in HBSS without Ca2+ and Mg2+ (HBSS−). After two washes in HBSS+, the anterior segment was removed and the eyecup was placed in HBSS−, where the NR was removed. The NR was frozen on dry ice and stored at −80°C until the RNA isolation was performed (RNeasy Mini Kit; Qiagen, Inc., Valencia, CA, USA) according to the manufacturer's protocol. The RPE cells were gently brushed from the eyecup in fresh HBSS−, collected, and pelleted at 1200 g for 15 minutes. The supernatant was removed and the cells were stored at −80°C until the RNA isolation was performed (RNeasy Micro Kit; Qiagen, Inc.) according to the manufacturer's protocol. The purity of the NR and isolated RPE cells was verified by relative quantification of RPE-specific 65-kDa protein (Rpe65) mRNA, specific to the RPE; and rhodopsin (Rho), specific to the NR.
Quantitative Real-Time PCR
NR and RPE samples obtained from HID and SID mice were analyzed using quantitative real-time PCR for gene expression, as described previously.27 RNA isolation was performed with an RNeasy mini kit (Qiagen, category number 74106) according to the manufacturer's protocol. The RNA was quantified with a spectrophotometer and stored at −80°C. cDNA was synthesized using TaqMan reverse transcription reagents (category number 808-0234, Applied Biosystems, Foster City, CA, USA) according to the manufacturer's protocol. TaqMan gene expression assays were obtained from Applied Biosystems and used for PCR analysis. Probes included transferrin receptor (Tfrc, Mm 00441941_m1), ferritin light chain 1 (Ftl1, Mm03030144_g1), retinal pigment epithelium 65 (Rpe65, Mm00504133_m1), Rho (Mm00520345_m1), Heph (Mm00515970_m1), Hepc antimicrobial peptide (Mm00519025_m1), glutathione peroxidase 1 (Gpx1, Mm00656767_g1*), Cp (Mm00432654_m1), amyloid beta (A4) precursor protein (App, Mm01344172_m1), superoxide dismutase 1 (Sod1, Mm00437992_m1), and superoxide dismutase 2 (Sod2, Mm01313000_m1). Eukaryotic 18S rRNA (Hs99999901_s1) served as an internal control due to its constant expression level among the studied sample sets. Real-time TaqMan RT-PCR (Applied Biosystems) was performed on an ABI Prism 7500 detection system using the ΔΔCT method, which provided normalized expression values. The amount of target mRNA was compared among groups of interest. All reactions were performed in biological (three mice) and technical (three real-time PCR replicates per mouse) triplicates.
Statistical Analysis
The mean ± SE were calculated for each comparison pair. For each comparison, the n = 3. The Student's two-group, two-sided t-test was used to perform statistical analysis for relative pixel density and relative mRNA levels. All statistical analysis was performed in GraphPad Prism (San Diego, CA, USA); P > 0.05 (not significant [ns]), *P < 0.05, **0.001 ≤ P ≤ 0.01, ***P < 0.001 was considered statistically significant.
Results
Systemic Iron Levels Were Increased by the HID
Changes in the levels of several iron-responsive mRNAs were consistent with elevated liver iron levels (Fig. 1A). Light-ferritin (L-Ft) and Hepc mRNAs were increased in both 3- and 10-month HID mouse livers. Transferrin receptor demonstrated a decreased mRNA level in 3-month HID mice, indicating that liver iron levels were increased even after this shorter exposure to the HID (Fig. 1A). Tissue iron levels were quantified in the liver, heart, and brain of the 10-month HID mice and found to be increased relative to the SID group (Fig. 1B). Iron was increased in the liver by 25-fold, in the heart by twofold, and in the brain by 1.3-fold (Fig. 1B). This method was not used to quantify retinal iron, as the small amount of tissue in the mouse retina results in high variability. Below, we present retinal iron quantification using other techniques. These techniques, in order of greatest to least sensitivity are as follows: quantitative PCR (qPCR) for transferrin receptor mRNA, then qPCR for L-Ft mRNA, then immunolabeling for ferritin protein, then Perls' staining.
Figure 1.

Tissue mRNA levels and iron quantification in various organs of SID and HID fed mice. (A) Graphs showing relative mRNA levels of iron regulated genes in livers of 3- and 10-month SID versus HID mice. Three months and 10 months refer to the exposure time to an HID, initiated at age 2 months. (B) Graph showing total nonheme iron quantification by BPS in the brain, heart, and liver of 10-month-old CD1 strain mice. *P < 0.05, **0.001 ≤ P ≤ 0.01, ***P < 0.001.
Transferrin Receptor Was Increased in the Retinas of 3-Month HID Mice
Most of the mRNAs for iron regulatory genes (L-Ft, TfR, Hepc, Heph, Cp, and App) had no change in expression levels in the NR at 3 months and 10 months (Figs. 2A, 2B). Surprisingly, NR from 3-month HID mice demonstrated an increased Tfrc mRNA level (Fig. 2A), possibly resulting from local iron regulatory mechanisms that were activated to keep iron out of the retina. NR from 10-month HID mice did not show a measurable difference in the levels of any of the tested mRNAs (Fig. 2B). Rho mRNA levels were increased in the 3-month HID NR. This may result from the diminished NR iron levels; we have previously observed an increase in Rho mRNA following treatment with the oral iron chelator deferiprone (data not shown).
Figure 2.

Levels of mRNA from iron responsive genes in NR of 3- and 10-month SID versus HID mice. Neural retina iron response genes expression assessed by qPCR. (A) Three months NR relative expression for: L-Ft, Tfrc, Rho, Hepc, Heph, Cp, and amyloid precursor protein (App). (B) Ten months NR relative expression for the indicated mRNAs. *P < 0.05, ***P < 0.001.
HID Caused Modest RPE Iron Accumulation and Changes in RPE65 mRNA Levels
The mRNA levels of the iron-dependent enzyme RPE65 were measured at the 3-month and 10-month time points. Three-month HID mice had increased mRNA levels in the RPE (Fig. 3A). Ten-month HID mice demonstrated a decreased mRNA level in the RPE (Fig. 3B). Moreover, RPEs of 10-month HID mice had decreased Tfrc mRNA levels when compared to RPEs of 10-month SID mice, which is consistent with elevated iron levels (Fig. 3B).
Figure 3.

Levels of mRNAs from iron responsive genes in RPE of 3 and 10 months SID versus HID mice. Relative mRNA levels for indicated genes. RPE and Chr were isolated from mice that had been on either the SID or HID diet for 3 months (A). (B) Same as (A), except only RPE was isolated and mice had been in the SID or HID diet for 10 months. **0.001 ≤ P ≤ 0.01, ***P < 0.001.
RPE L-Ft Immunolabeling Increased With a High Iron Diet
Immunofluorescence for L-Ft, which is upregulated by elevated iron levels, on retinas from 3-month HID mice showed an increase only in the choroid (Chr) when compared to 3-month SID retinas (Figs. 4A–D). The 10-month HID mice (Figs. 4E–H) showed a striking increase in the Chr, but only modestly increased L-Ft labeling in the RPE. Relative pixel density was mildly increased in the RPE of 10-month HID mice (Fig. 4M). Additionally, 3- and 10-month HID mice showed increased choroidal L-Ft pixel density (Figs. 4K, 4N).
Figure 4.

L-ferritin immunofluorescence in the NR, RPE, and Chr. Fluorescence photomicrographs of retinas from HID mice compared with SID mice. (A) L-ferritin (red) labeling of 3-month SID mice. (B) Same as (A), except nuclear stain (diamidino-2-phenylindole [DAPI]-blue) is added. (C) L-ferritin labeling of 3-month HID mice. (D) L-ferritin + DAPI of 3-month HID mice. (E) L-ferritin labeling of 10-month SID mice. (F) L-ferritin labeling + DAPI 10-month SID mice, RPE outlined in white. (G) L-ferritin labeling 10-month HID mice. (H) L-ferritin + DAPI of 10-month HID mice, RPE outlined in white. (I) L-ferritin relative pixel density in NR of 3-month SID versus HID. (J) L-ferritin relative pixel density in RPE of 3-month SID versus HID. (K) L-ferritin relative pixel density in Chr of 3-month SID versus HID. (L) L-ferritin relative pixel density in NR of 10-month SID versus HID. (M) L-ferritin relative pixel density in RPE of 10-month SID versus HID. (N) L-ferritin relative pixel density in Chr of 10-month SID versus HID. *P < 0.05, **0.001 ≤ P ≤ 0.01. Scale bar (D): 100 μm (A–D). Scale bar (H): 100 μm (E–H).
mRNA Levels of Sod1 and Sod2 Were Altered by the HID
The NR mRNA levels of Sod1 and Sod2 were increased in the 3-month HID group when compared to the SID mice (Fig. 5A). RPE Sod1 in 3-month HID mice was increased, and 10-month RPE Sod1 and Sod2 mRNA levels were decreased in HID mice (Figs. 5B, 5D).
Figure 5.

Relative mRNA levels of oxidative stress genes in 3- and 10-month SID versus HID mice. (A) Three months NR: Sod1 and Sod2, catalase (Cat), and Gpx1. (B) Three months RPE. (C) Ten months NR. (D) Ten months RPE. *P < 0.05, **0.001 ≤ P ≤ 0.01.
Retinal Morphology in 16-Month HID Mice
Morphology of SID and HID mouse retinas was compared and demonstrated no structural differences between the two groups. Moreover, there was moderately increased Perls' stain in the choroid, but not the NR or RPE after 16 months of HID exposure (Fig. 6D).
Figure 6.
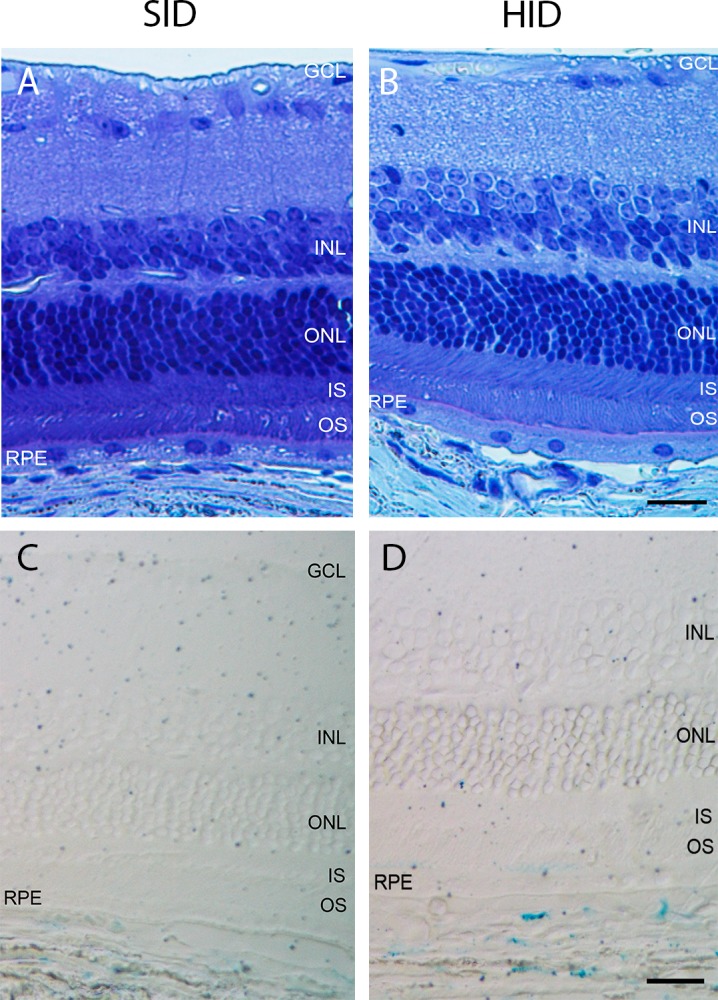
Bright-field photomicrographs of plastic sections of 18-month SID and HID mice. (A) Eighteen-month SID plastic section photomicrograph. (B) Eighteen-month HID plastic section photomicrograph. (C) Eighteen-month SID Perls' stain photomicrograph. (D) Eighteen-month HID Perls' stain photomicrograph. Scale bars (B, D): 25 μm (A–D).
Discussion
Retinal iron overload has been shown to cause retinal degeneration in previous studies.4–8,10,11,14,27 The mechanisms of retinal iron accumulation require elucidation. This study examined whether an HID, as a means to increase systemic iron levels, would lead to retinal iron accumulation. The HID caused increased iron levels in the liver, heart, and brain (Fig. 1). L- ferritin immunolabeling, a measure of labile iron levels, in RPE of 10-month HID mice was modestly increased when compared to 10-month SID mice (Figs. 4E–H). When compared to 3-month HID mice, the 10-month HID RPE exhibited higher levels of L-Ft labeling (Figs. 4D, 4H). Consistent with increased RPE iron, transferrin receptor mRNA levels were decreased in the RPE of 10-month HID mice (Fig. 3B).
Iron homeostasis genes (L-Ft, Hepc, Heph, Cp, and App) did not have significant mRNA level changes in the NR at 3 and 10 months (Figs. 2A, 2B). This is consistent with the blood retinal barrier being able to shield the NR of HID mice from becoming significantly iron loaded at 3 and 10 months.4,28–32 However, the 3-month HID demonstrated an increase in NR Tfrc mRNA (Fig. 2A). This suggests a paradoxical reduction in NR iron levels caused by the HID. Perhaps this represents overcompensation by cells in the blood retinal barrier, engaging mechanisms that keep iron out of the NR.
While the blood brain barrier and inner blood retinal barriers seem similar in that both have capillary endothelial cells with tight junctions, pericytes, and juxtaposed glial cells, they may have some iron regulatory differences. The fact that we found increased brain iron in 10-month HID mice compared to SID while there was no measurable increase in NR iron suggests that the NR may have tighter regulation of iron import than the brain.
At 10 months, the RPE of HID mice had changes in iron regulatory genes and L-Ft immunofluorescence indicating increased iron levels in the RPE (Fig. 3B). It is not surprising that high oral iron levels increased iron in the RPE but not the NR. The outer blood retinal barrier (oBRB) is the RPE. The oBRB shields the NR from high serum iron levels. The NR is also shielded from high serum iron by the vascular endothelial cells, forming the inner BRB (iBRB).
Three-month HID mice showed increased mRNA levels of RPE65, an iron-binding retinol isomerase6,33 within the RPE; subsequently, 10-month HID mice demonstrated a decrease in RPE65 mRNA (Figs. 3A, 3B). The increased RPE65 at 3 months suggest that a moderate change in iron bioavailability within the RPE, while not detected through immunofluorescence or qPCR of iron responsive genes, may upregulate RPE65. The modest decrease in RPE65 at 10 months may be caused by increased RPE iron.
Iron has been implicated in oxidative damage through the Fenton reaction, in which iron reacts with hydrogen peroxide to produce damaging hydroxyl free radicals.6,10,34 Previous studies have delineated iron's oxidative impact on the RPE and retina.5,6,9,10,27 In this study, we found decreased Sod1 and Sod2 levels in RPE of 10-month HID mice when compared to 10-month SID mice (Figs. 5B, 5D). Sod may be downregulated by RPE cells with increased iron to decrease production of hydrogen peroxide, which can react with iron in the Fenton reaction to produce harmful hydroxyl radical. Consistent with this hypothesis, the slightly iron-deficient NR from 3-month HID mice had higher Sod1 and Sod2 levels than the NR from 3-month SID mice (Fig. 5A).
At these time points, we did not see structural changes in the retina representing degeneration. Only sparse TUNEL positive cells were identified in the 10-month HID mice, no more than the SID mice (data not shown). Retinal morphology was normal even after 16 months of HID. In contrast, our previous studies with genetically iron overloaded RPE indicate that highly elevated RPE iron levels are harmful to RPE cells.6 In the current study, the lack of retinal damage is probably due to the CD1 WT mouse retina's ability to regulate iron uptake even when an HID elevates serum and liver iron levels.8,10 Even though the HID mouse livers had a 25-fold increase in iron levels, the NR showed no evidence of increased iron levels and the RPE only demonstrated a modest increase, barely detectable with ferritin immunofluorescence and not detectable with Perls' stain. These results suggest that retinal iron-induced damage occurs mainly when there are defects in local iron regulatory mechanism.
While our study did not detect changes in retinal iron levels that we have detected after high-dose intraperitoneal iron injection, we cannot rule out a small increase in retinal iron caused by an HID. This change would be below the limits of detection of this study. It is possible that a small increase would have been detected with a larger sample size. If such a small increase did occur, it was not enough to cause retinal degeneration.
Furthermore, we have only tested an HID on one mouse strain, CD1. In the literature, C57BL/6J mice have lower tissue (i.e., liver, spleen) iron levels compared to other strains.35 Moreover, we chose the CD1 strain for this study, as recently published work from our lab demonstrated that CD1 Bmp6 KO mice exhibited rapid iron uptake in the retina.4 However, it is possible that other mouse strains would yield different results.
The results presented herein, albeit using only a limited number of mice of one strain, suggest that high levels of dietary nonheme iron ingested over short (3 months), longer (10 months), or even 16-month periods do not result in detectable increases in NR iron, and do not cause enough RPE iron accumulation to induce RPE or retinal degeneration.
Acknowledgments
Supported by National Institutes of Health/National Eye Institute RO1 EY015240, a Research to Prevent Blindness Medical Student Fellowship and unrestricted funding from Research to Prevent Blindness, the F.M. Kirby Foundation, an Alpha Omega Alpha Carolyn L. Kuckein Medical Student Research Fellowship, and the Richard T. Beebe Medical Student Research Fellowship. The authors alone are responsible for the content and writing of the paper.
Disclosure: D.L. Bhoiwala, None; Y. Song, None; A. Cwanger, None; E. Clark, None; L.-L. Zhao, None; C. Wang, None; Y. Li, None; D. Song, None; J.L. Dunaief, None
References
- 1. Zimmermann MB,, Hurrell RF. Nutritional iron deficiency. Lancet. 2007. ; 370: 511–520. [DOI] [PubMed] [Google Scholar]
- 2. Dunn LL,, Suryo Rahmanto Y,, Richardson DR, Iron uptake and metabolism in the new millennium. Trends Cell Biol. 2007; 17: 93–100. [DOI] [PubMed] [Google Scholar]
- 3. Dunaief JL,, Richa C,, Franks EP,, et al. Macular degeneration in a patient with aceruloplasminemia, a disease associated with retinal iron overload. Ophthalmology. 2005. ; 112: 1062–1065. [DOI] [PubMed] [Google Scholar]
- 4. Zhao LL,, Li Y,, Song D,, et al. A high serum iron level causes mouse retinal iron accumulation despite an intact blood-retinal barrier. Am J Pathol. 2014. ; 184: 2862–2867. [DOI] [PMC free article] [PubMed] [Google Scholar]
- 5. Song D,, Zhao L,, Li Y,, et al. The oral iron chelator deferiprone protects against systemic iron overload-induced retinal degeneration in hepcidin knockout mice. Invest Ophthalmol Vis Sci. 2014. ; 55: 4525–4532. [DOI] [PMC free article] [PubMed] [Google Scholar]
- 6. Song D,, Dunaief JL. Retinal iron homeostasis in health and disease. Front Aging Neurosci. 2013. ; 5: 24. [DOI] [PMC free article] [PubMed] [Google Scholar]
- 7. Wolkow N,, Song D,, Song Y,, et al. Ferroxidase hephaestin's cell-autonomous role in the retinal pigment epithelium. Am J Pathol. 2012. ; 180: 1614–1624. [DOI] [PMC free article] [PubMed] [Google Scholar]
- 8. Hadziahmetovic M,, Song Y,, Ponnuru P,, et al. Age-dependent retinal iron accumulation and degeneration in hepcidin knockout mice. Invest Ophthalmol Vis Sci. 2011. ; 52: 109–118. [DOI] [PMC free article] [PubMed] [Google Scholar]
- 9. Wong RW,, Richa DC,, Hahn P,, Green WR,, Dunaief JL. Iron toxicity as a potential factor in AMD. Retina. 2007. ; 27: 997–1003. [DOI] [PubMed] [Google Scholar]
- 10. Dunaief JL. Iron induced oxidative damage as a potential factor in age-related macular degeneration: the Cogan Lecture. Invest Ophthalmol Vis Sci. 2006. ; 47: 4660–4664. [DOI] [PubMed] [Google Scholar]
- 11. Hahn P,, Qian Y,, Dentchev T,, et al. Disruption of ceruloplasmin and hephaestin in mice causes retinal iron overload and retinal degeneration with features of age-related macular degeneration. Proc Natl Acad Sci U S A. 2004. ; 101: 13850–13855. [DOI] [PMC free article] [PubMed] [Google Scholar]
- 12. Hahn P,, Dentchev T,, Qian Y,, Rouault T,, Harris ZL,, Dunaief JL. Immunolocalization and regulation of iron handling proteins ferritin and ferroportin in the retina. Mol Vis. 2004. ; 10: 598–607. [PubMed] [Google Scholar]
- 13. Chen L,, Dentchev T,, Wong R,, et al. Increased expression of ceruloplasmin in the retina following photic injury. Mol Vis. 2003. ; 9: 151–158. [PubMed] [Google Scholar]
- 14. Dunaief JL,, Dentchev T,, Ying GS,, Milam AH. The role of apoptosis in age-related macular degeneration. Arch Ophthalmol. 2002. ; 120: 1435–1442. [DOI] [PubMed] [Google Scholar]
- 15. Guo LY,, Alekseev O,, Li Y,, Song Y,, Dunaief JL. Iron increases APP translation and amyloid-beta production in the retina. Exp Eye Res. 2014. ; 129: 31–37. [DOI] [PMC free article] [PubMed] [Google Scholar]
- 16. Duce JA,, Tsatsanis A,, Cater MA,, et al. Iron-export ferroxidase activity of beta-amyloid precursor protein is inhibited by zinc in Alzheimer's disease. Cell. 2010. ; 142: 857–867. [DOI] [PMC free article] [PubMed] [Google Scholar]
- 17. Ganz T. Hepcidin and iron regulation, 10 years later. Blood. 2011. ; 117: 4425–4433. [DOI] [PMC free article] [PubMed] [Google Scholar]
- 18. Hershko C,, Graham G,, Bates GW,, Rachmilewitz EA. Non-specific serum iron in thalassaemia: an abnormal serum iron fraction of potential toxicity. Br J Haematol. 1978. ; 40: 255–263. [DOI] [PubMed] [Google Scholar]
- 19. Brissot P,, Ropert M,, Le Lan C,, Loreal O. Non-transferrin bound iron: a key role in iron overload and iron toxicity. Biochim Biophys Acta. 2012. ; 1820: 403–410. [DOI] [PubMed] [Google Scholar]
- 20. Gnana-Prakasam JP,, Martin PM,, Mysona BA,, Roon P,, Smith SB,, Ganapathy V. Hepcidin expression in mouse retina and its regulation via lipopolysaccharide/Toll-like receptor-4 pathway independent of Hfe. Biochem J. 2008. ; 411: 79–88. [DOI] [PMC free article] [PubMed] [Google Scholar]
- 21. Nemeth E,, Ganz T. Regulation of iron metabolism by hepcidin. Ann Rev Nutr. 2006. ; 26: 323–342. [DOI] [PubMed] [Google Scholar]
- 22. Meynard DKL,, Darnaud V,, Canonne-Hergaux F,, Coppin H,, Roth M-P. Lack of the bone morphogenetic protein BMP6 induces massive iron overload. Nat Genet. 2009. ; 41: 478–481. [DOI] [PubMed] [Google Scholar]
- 23. Gnana-Prakasam JP,, Tawfik A,, Romej M,, et al. Iron-mediated retinal degeneration in haemojuvelin-knockout mice. Biochem J. 2012. ; 441: 599–608. [DOI] [PMC free article] [PubMed] [Google Scholar]
- 24. Wong BX,, Tsatsanis A,, Lim LQ,, Adlard PA,, Bush AI,, Duce JA, Beta-amyloid precursor protein does not possess ferroxidase activity but does stabilize the cell surface ferrous iron exporter ferroportin. PLoS One. 2014; 9: e114174. [DOI] [PMC free article] [PubMed] [Google Scholar]
- 25. Dasari B,, Prashanthi JR,, Marwarha G,, Singh BB,, Ghribi O. The oxysterol 27-hydroxycholesterol increases b-amyloid and oxidative stress in retinal pigment epithelial cells. BMC Ophthalmol. 2010. ; 10: 22. [DOI] [PMC free article] [PubMed] [Google Scholar]
- 26. Torrance JD,, Bothwell TH. A simple technique for measuring storage iron concentrations in formalinised liver samples. S Afr J Med Sci. 1968. ; 33: 9–11. [PubMed] [Google Scholar]
- 27. Song D,, Song Y,, Hadziahmetovic M,, Zhong Y,, Dunaief JL. Systemic administration of the iron chelator deferiprone protects against light-induced photoreceptor degeneration in the mouse retina. Free Radic Biol Med. 2012. ; 53: 64–71. [DOI] [PMC free article] [PubMed] [Google Scholar]
- 28. Harned J,, Nagar S,, McGahan MC. Hypoxia controls iron metabolism and glutamate secretion in retinal pigmented epithelial cells. Biochim Biophys Acta. 2014. ; 1840: 3138–3144. [DOI] [PubMed] [Google Scholar]
- 29. Gnana-Prakasam JP,, Baldowski RB,, Ananth S,, Martin PM,, Smith SB,, Ganapathy V. Retinal expression of the serine protease matriptase-2 (Tmprss6) and its role in retinal iron homeostasis. Mol Vis. 2014. ; 20: 561–574. [PMC free article] [PubMed] [Google Scholar]
- 30. Iancu TC. Ultrastructural aspects of iron storage transport and metabolism. J Neural Transm. 2011. ; 118: 329–335. [DOI] [PubMed] [Google Scholar]
- 31. He X,, Hahn P,, Iacovelli J,, et al. Iron homeostasis and toxicity in retinal degeneration. Prog Retin Eye Res. 2007. ; 26: 649–673. [DOI] [PMC free article] [PubMed] [Google Scholar]
- 32. Steuer H,, Jaworski A,, Elger B,, et al. Functional characterization and comparison of the outer blood-retina barrier and the blood-brain barrier. Invest Ophthalmol Vis Sci. 2005. ; 46: 1047–1053. [DOI] [PubMed] [Google Scholar]
- 33. Moiseyev G,, Chen Y,, Takahashi Y,, Wu BX,, Ma JX. RPE65 is the isomerohydrolase in the retinoid visual cycle. Proc Natl Acad Sci U S A. 2005. ; 102: 12413–12418. [DOI] [PMC free article] [PubMed] [Google Scholar]
- 34. Lukinova N,, Iacovelli J,, Dentchev T,, et al. Iron chelation protects the retinal pigment epithelial cell line ARPE-19 against cell death triggered by diverse stimuli. Invest Ophthalmol Vis Sci. 2009. ; 50: 1440–1447. [DOI] [PMC free article] [PubMed] [Google Scholar]
- 35. Wang F,, Paradkar PN,, Custodio AO,, et al. Genetic variation in Mon1a affects protein trafficking and modifies macrophage iron loading in mice. Nat Genet. 2007. ; 39: 1025–1032. [DOI] [PubMed] [Google Scholar]