

Abstract
Quantitatively tracking engraftment of intracerebrally or intravenously transplanted stem cells and evaluating their concomitant therapeutic efficacy for stroke has been a challenge in the field of stem cell therapy. In this study, first, an MRI/SPECT/fluorescent tri-modal probe (125I-fSiO4@SPIOs) is synthesized for quantitatively tracking mesenchymal stem cells (MSCs) transplanted intracerebrally or intravenously into stroke rats, and then the therapeutic efficacy of MSCs delivered by both routes and the possible mechanism of the therapy are evaluated. It is demonstrated that (125)I-fSiO4@SPIOs have high efficiency for labeling MSCs without affecting their viability, differentiation, and proliferation capacity, and found that 35% of intracerebrally injected MSCs migrate along the corpus callosum to the lesion area, while 90% of intravenously injected MSCs remain trapped in the lung at 14 days after MSC transplantation. However, neurobehavioral outcomes are significantly improved in both transplantation groups, which are accompanied by increases of vascular endothelial growth factor, basic fibroblast growth factor, and tissue inhibitor of metalloproteinases-3 in blood, lung, and brain tissue (p < 0.05). The study demonstrates that 125I-fSiO4@SPIOs are robust probe for long-term tracking of MSCs in the treatment of ischemic brain and MSCs delivered via both routes improve neurobehavioral outcomes in ischemic rats.
1. Introduction
Stem cell therapy has great potential for central nervous system disease treatment, including ischemic stroke, brain trauma, Parkinson disease, and Alzheimer’s disease.[1] However, translating the therapy from animal models to clinical patients remains a daunting task owing to the difficulty of following the grafting process of the transplanted stem cells in vivo in terms of migration, distribution, and the amount of cells grafting to the target organ. Previously, intracerebral (IC), intravenous (IV), and intra-arterial (IA) transplantation of stem cells has been advocated for stroke therapy. However, there are insufficient data to support, which transplantation route is optimal for achieving the best therapeutic efficacy.[2,3] To elucidate these problems, advanced imaging techniques that provide noninvasive, reproducible, and quantitative tracking of implanted cells are desperately needed. Therefore, in recent years, biomedical imaging techniques, such as magnetic resance imaging (MRI),[4-7] single photon emission computed tomography/positron emission tomography (SPECT/PET),[8,9] and fluorescent imaging,[10,11] have been extensively explored for noninvasive cell tracking.
Among these imaging techniques, MRI has high spatial resolution and soft tissue contrast. For MR stem cell imaging, cells need to be labeled with magnetic tags, such as superparamagnetic iron oxide nanoparticles (SPIOs) and gadolinium-based contrast agents.[12,13] Previous studies showed that SPIO-labeled stem cells injected IC could be detected by MRI to migrate from the injection site to the infarct area, even when injected in the contralateral hemisphere.[14-16] However, it is difficult to achieve whole body imaging of the distribution of SPIO-labeled cells by MRI, as the dark signal induced by SPIOs may also be derived from other sources.
Nuclear imaging is highly sensitive and quantitative, and can achieve whole body imaging and dynamically observe the biodistribution of implanted cells in vivo.[17,18] To this end, 111In(111In-oxine), 99mTc, 18F (18F-FDG), and 64Cu have been explored for cell labeling to determine the biodistribution of the cells after transplantation,[19-23] However, nuclear imaging has low spatial resolution and it is not possible to obtain the anatomical location of the ischemic brain. Therefore, either MRI or nuclear imaging alone is insufficient to obtain all the necessary information. However, combining these two imaging modalities could solve this problem.
In this context, MRI/SPECT (PET) dual-mode imaging has been pursued in recent years to track stem cells in vivo.[24] For this purpose, cells are often labeled with MRI contrast agents and radioisotopes sequentially. However, this two-step labeling strategy is time consuming.[25] Moreover, the half-life of 111In, 99mTc, and 18F are relatively short and it is difficult to track the cell grafting process for long periods of time.
In this study, we synthesized a MRI/SPECT/fluorescent trifunctional probe by labeling fluorescent silica coated SPIOs with 125iodine (125I-fSiO4@SPIOs) to label and noninvasively and quantitatively track the migration and biodistribution of mesenchymal stem cells (MSCs)-injected IV or IC in ischemic rats. Moreover, we explored one of the possible mechanisms for the beneficial effects of transplanted MSCs in the ischemic brain.
2. Results
2.1. (125)I-fSiO4@SPIOs and MSCs
125I-fSiO4@SPIOs were synthesized by labeling fluorescent silica-coated SPIOs with 125iodine. SPIOs were prepared by thermal decomposition of Fe(acac)3 in the presence of surfactants.[26] The iron oxide core diameter of synthesized SPIOs was about 6 nm as determined by transmission electron microscopy (TEM). After silica coating, the overall size was about 20 nm (Figure 1A). To label silica-coated SPIOs with 125iodine, silica-coated SPIOs were modified with 3-aminopropyltriethoxysilane and further functionalized with N-succinimidyl-3-(trinbutyl stannyl) benzoate (ATE, Sigma, San Louis, MO), an 125iodine labeling precursor.[27] The zeta potentials before and after ATE modification were 26.8 and –1.2 mV, respectively (Figure S1A, Supporting Information). 125Iodine or nonradioactive iodine labeling was achieved by Idogen oxidization method. The T2 relaxivity of I-fSiO4@SPIOs was 165 s−1 mm−1 at 1.41 T and 37 °C (Figure S1B, Supporting Information). The radiolabeling efficiency was 93%. The detachment of 125iodine was negligible and more than 96% of 125Iodine was still retained when particles were incubated with serum at 37 °C for 15 days (Figure S1C, Supporting Information).
Figure 1.
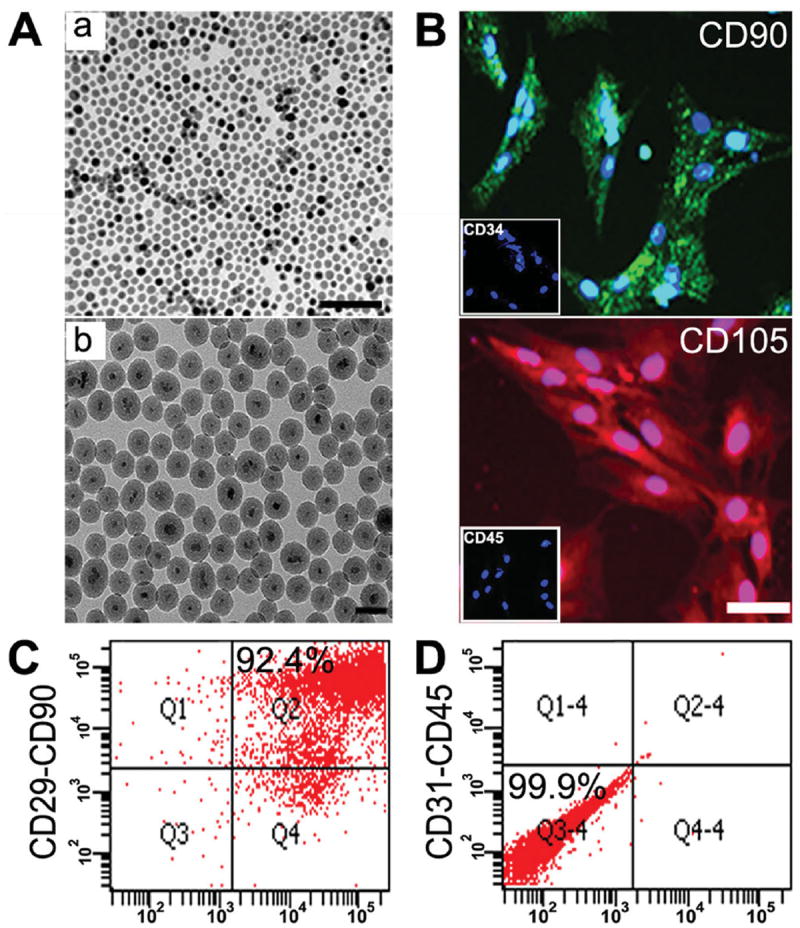
Characterization of I-fSiO4@SPIOs and MSCs. A) TEM images of SPIOs (a) and I-fSiO4@SPIOs (b). Bar = 100 nm (a) and 50 nm (b). B) Immunohistochemical staining of cultured MSCs with anti-CD90 (green), anti-CD105 (red), anti-CD34 (boxed area), and anti-CD45 (boxed area). Cell nuclei were counter-stained with 4’,6-diamidino-2-phenylindole (DAPI, blue). Scale bar = 100 μm. C,D) Flow cytometry of cultured MSCs using anti-CD29/CD90 and anti-CD31/CD45 double staining.
Rat MSCs were isolated from the femur and tibia of adult rats, and identified by immunocytochemistry and flow cytometry. Immunocytochemistry indicated that most cells were CD105+ and CD90+, and CD34− and CD45− (Figure 1B). Fluorescent cell sorting showed that 92.4% of the cells were CD29+ / CD90+ (Figure 1C), but 99.9% of the cells were CD31−/CD45− (Figure 1D).
2.2. MSC Labeling
To optimize labeling efficiency, nonradioactive iodine labeled fSiO4@SPIOs (I-fSiO4@SPIOs) was used. MSCs were incubated with I-fSiO4@SPIOs at various concentrations (0.01, 0.05, 0.1, and 0.5 × 10⁻³ m Fe) for 1 h or at a concentration of 0.1 × 10⁻³ m for different periods of time (10, 30, 60, and 120 min). Cell labeling efficiency was first analyzed by flow cytometry (FACSArial II, BD Falcon, San Jose, CA). As indicated in Figure 2A, more than 70% of MSCs could be labeled when the cells were incubated with I-fSiO4@SPIOs at the concentration of 0.1 × 10⁻³ m for 30 min or at the concentration of 0.05 × 10⁻³ m for 1 h.
Figure 2.

MSC labeling with I-fSiO4@SPIOs. A) Flow cytometry analysis of MSC labeling efficiency. MSCs were incubated with I-fSiO4@SPIOs at a concentration of 0.1 × 10⁻³ m Fe for different periods of time (a–d) or at different concentrations for 60 min (e–g). Positive control was plain I-fSiO4@SPIOs h). B) Confocal microscopy showed I-fSiO4@SPIOs (red) accumulated within the cytoplasm. Cell nuclei were stained with DAPI (blue). Scale bar = 25 μm.
To quantify cell labeling efficiency, the intracellular iron content was measured with an inductively coupled plasma optical emission spectrometer (ICP-OES, ICAP-6300, Thermo Fisher, Portsmouth, New Hampshire). The relaxation rates of labeled cells (10 000 cells mL−1) were determined using a 1.41 T minispec mq 60 NMR Analyzer (Bruker, Germany). These data are summarized in Figure S2 (Supporting Information).
To check if I-fSiO4@SPIOs were internalized, confocal laser scanning microscopy was performed using sequential imaging along the z-axis at 0.5 μm interslice distances. MSCs were labeled with I-fSiO4@SPIOs at a concentration of 0.1 × 10⁻³ m for 1 h. Figure 2B shows a representative cell image from the middle slice of the cell, which indicates that I-fSiO4@SPIOs were internalized into the cytoplasm. Orthogonal projections of z-stack reconstructions also demonstrated that I-fSiO4@SPIOs was internalized by MSCs rather than being associated with the cell surface.
2.3. Effects of (125)I-fSiO4@SPIO Labeling on Cell Viability, Differentiation, and Proliferation
To evaluate a possible adverse effect of I-fSiO4@SPIO labeling, the cell viability after labeling was examined. As indicated in Figure 3A, cell viability gradually decreased with an increase of incubation time or probe concentration. Cell viability was reduced to about 80% after incubation with 0.1 × 10⁻³ m for 2 h or 0.5 × 10⁻³ m for 1 h (p < 0.05). However, no adverse effect was observed when the cells were labeled at a probe concentration of 0.1 × 10⁻³ m for 1 h. Therefore, this condition was used for MSC labeling in further experiments.
Figure 3.

MSC viability, differentiation, and proliferation after labeling with I-fSiO4@SPIOs or (125)I-fSiO4@SPIOs. A) CCK-8 analysis of cell viability after labeling with 0.1 m m Fe I-fSiO4@SPIOs for different periods of time (a) or with different concentrations of I-fSiO4@SPIOs for 60 min (b). c) Cell viability after labeling with different doses of (125)I-fSiO4@SPIOs (0, 2, 10, 20, and 100 μCi/million cells). Data are presented as mean ± SD, n = 3 per group. B) Oil red and Alizarian Red S staining showed that I-fSiO4@SPIO- and (125)I-fSiO4@SPIO-labeled MSCs differentiated into adipocytes (a–c, arrows) and osteoblasts (d–f, arrows). Bar = 50 μm. C) Anti-BrdU staining of I-fSiO4@SPIO- and (125)I-fSiO4@ SPIO-labeled MSCs (b,c). d–f) 3D confocal images of the proliferation of MSCs. Scale bar = 20 μm.
To evaluate the effect of radiation dose on cell viability, MSCs were labeled with (125)I-fSiO4@SPIOs (mixture of I-fSiO4@SPIOs and 125I-fSiO4@SPIOs) at a concentration of 0.1 × 10⁻³ m for 1 h with increasing radiation dose. A cell counting kit-8 (CCK-8) assay indicated that cell viability was also decreased with an increased radiation dose. When cells were labeled with (125)I-fSiO4@SPIOs at 100 μCi/million cells, cell viability significantly decreased immediately after labeling (Figure 3A). When the labeling dose was 20 μCi/million cells, cell death was not significant up to 14 days.
Next, we examined whether I-fSiO4@SPIO or (125)I-fSiO4@ SPIO labeling affected the differentiation potential of MSCs. MSCs were incubated with 0.1 × 10⁻³ m I-fSiO4@SPIOs or (125)I-fSiO4@SPIOs for 1 h with a dose of 20 μCi/million cells. Labeled cells were induced to differentiate into adipocytes or osteoblasts. Compared with unlabeled MSCs, neither I-fSiO4@ SPIOs nor (125)I-fSiO4@SPIOs was found to affect adipogenic and osteogenic differentiation of MSCs (Figure 3B). We also examined if I-fSiO4@SPIO or (125)I-fSiO4@SPIO labeling at the above condition affected cell proliferation. For this purpose, 5-Bromo-2′-deoxyuridine (BrdU) labeling of labeled MSCs was performed. Compared with control unlabeled cells (37.07% ± 5.14% BrdU positive cells), no reduction in cell proliferation could be observed after I-fSiO4@SPIO or (125)I-fSiO4@SPIO labeling (38.73% ± 7.47% and 36.57% ± 6.13% BrdU positive cells, respectively, Figure 3C). Thus, I-fSiO4@SPIO or (125)I-fSiO4@SPIO labeling does not have adverse effects on cell proliferation or differentiation for labeling conditions used in the following in vivo experiments. Moreover, confocal images showed that (125)I-fSiO4@SPIO particles were still present in MSCs that proliferated (Figure 3C).
2.4. In Vivo MR and SPECT/CT Imaging of MSCs using Different Transplantation Routes
To track MSCs injected IV or IC, MR imaging was first performed before SPECT/CT. T2-weighed MR images outlined the ischemic area as bright areas. One day after IC injection, contralateral to the ischemic hemisphere, (125)I-fSiO4@SPIOlabeled MSCs and (125)I-fSiO4@SPIO particle only (no cells) showed a strong contrast at the injection site, while no contrast enhancement could be observed for the unlabeled MSC injection group (Figure 4A). Three days post injection, (125)I-fSiO4@ SPIO-labeled MSCs were observed migrating from the injection site to the lesion area along the corpus callosum, while (125)I-fSiO4@SPIOs still retained at the injection site. 7 and 14 days post injection, accumulation of (125)I-fSiO4@SPIO-labeled MSCs in ischemic sites became apparent as hypointense areas (Figure 4A n-o), which was not seen for the unlabeled cell injection group and the (125)I-fSiO4@SPIO particle only (no cells) injection group. The T2 relaxation time change (ΔT2) of the ischemic area before and after labeled cell infusion was 44.23 ± 5.31, 130.58 ± 6.15, 160.82 ± 10.14, and 183.33 ± 8.42 ms, respectively, for 1, 3, 7, and 14 days post injection. The ΔT2 for the unlabeled cell injection group and the (125)I-fSiO4@ SPIO particle only injection group were nearly unchanged (5.22 ± 7.28 and 7.61 ± 4.91 ms, respectively). For IV injection, neither (125)I-fSiO4@SPIO-labeled MSCs nor (125)I-fSiO4@ SPIO particles only could be visualized in the lesion area (Figure 4B). The ΔT2 values in the ischemic area at 1, 3, 7, and 14 days post injection for both groups were marginal.
Figure 4.

MR tracking of (125)I-fSiO4@SPIO-labeled MSCs in stroked rats after IC and IV injection. T2-weighted MR images of ischemic rat brain before (a,f,k) and after IC (A) and IV (B) transplantation of unlabeled MSCs, (125)I-fSiO4@SPIO particles, or (125)I-fSiO4@SPIO-labeled MSCs at day 1 (b,g,l), day 3 (c,h,m), day 7 (d,I,n), and day 14 (e,j,o). Arrows indicated hypointense signals from (125)I-fSiO4@SPIO particles and (125)IfSiO4@ SPIO-labeled MSCs after IC injection. For IV injection, no signal from (125)I- fSiO4@SPIOs or (125)I-fSiO4@SPIO-labeled MSCs could be detected in the brain.
To confirm the MRI observations and to quantify the amount of migratory cells, SPECT/CT imaging of ischemic rats was performed. One day after IC injection, (125)I-fSiO4@ SPIO-labeled MSCs or (125)I-fSiO4@SPIO particles only were mainly confined at the injection sites, similar as that observed by MRI. Three days after injection, (125)I-fSiO4@SPIO-labeled MSCs were migrating to the lesion hemisphere (Figure 5A). After seven-day injection, 21.04% ± 7.2% of (125)I-fSiO4@SPIO-labeled MSCs (as calculated from radioactivity) were detected at the contralateral hemisphere, which increased to 35.19% ± 5.9% at 14 days after cell transplantation (Figure 5C, 5D). However, (125)I-fSiO4@SPIO particles only were still retained at the injection sites. For IV injection, labeled MSCs were mainly trapped in the lung and could not be detected in brain and other organs (Figure 5B).
Figure 5.
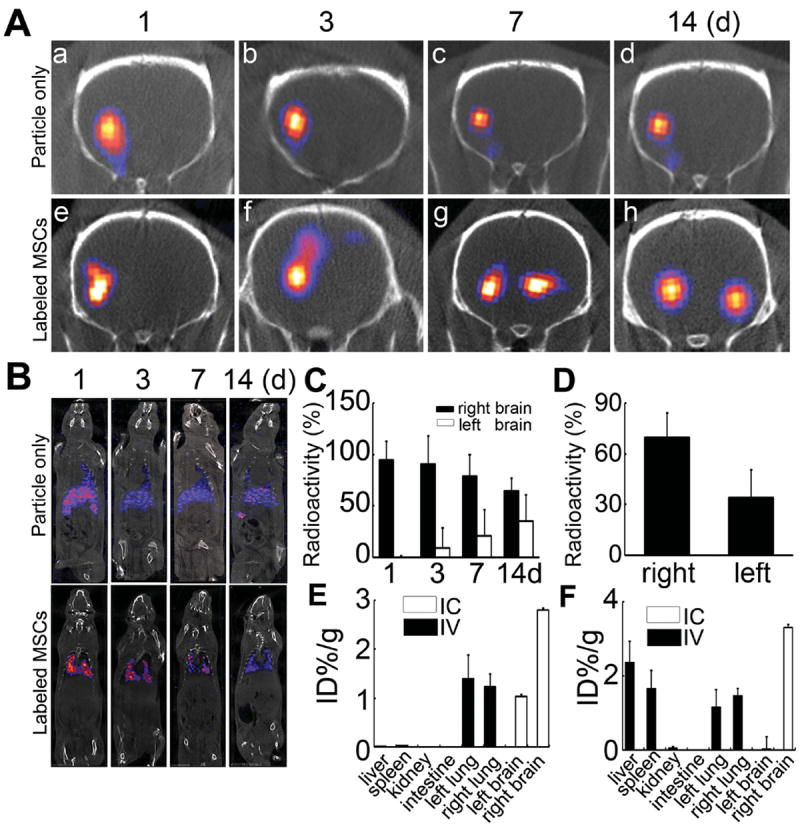
SPECT/CT tracking of (125)I-fSiO4@SPIO-labeled MSCs in ischemic rats after IC and IV injection. A,B) SPECT/CT imaging of labeled MSCs and particles alone in ischemic rats after IC (A) and IV injection (B). C) The radioactivity detected in the right and left hemispheres accounting for the total transplanted dose at different time points after IC injection. D) Ex vivo analysis of radioactivity in right and left hemispheres accounting for the total transplanted dose 14 days after IC injection. E,F) Biodistribution of (125)I-fSiO4@SPIO-labeled MSCs (E) or (125)I-fSiO4@SPIO particles alone (F) at 14 days after IV or IC transplantation. Data are mean ± SD, n = 3 per group.
After SPECT/CT imaging, the animals were sacrificed, and the distribution of (125)I-fSiO4@SPIO particles and (125)I-fSiO4@SPIO-labeled MSCs were quantified. For IC injection, (125)I-fSiO4@SPIO-labeled cells were detected in both right (2.80 ± 0.04 ID% g−1) and left brain (1.03 ± 0.04 ID% g−1), while (125)I-fSiO4@SPIO particles were mainly found in left brain (3.30 ± 0.09 ID% g−1) (Figure 5E, 5F). Neither (125)I-fSiO4@SPIO-labeled MSCs nor (125)I-fSiO4@SPIO particles were detected in other organs. For IV injection, (125)I-fSiO4@SPIO-labeled MSCs were trapped in the lung (right lung: 1.22 ± 0.28ID% g−1 ; left lung: 1.39 ± 0.49 ID% g –1, Figure 5E), while (125)I-fSiO4@SPIO particles were detected in liver (2.36 ± 0.58 ID% g−1), right lung (1.46 ± 0.19 ID% g−1), left lung (1.15 ± 0.48 ID% g−1), and spleen (1.65 ± 0.49 ID% g−1), with little in kidney (0.05 ± 0.042 ID% g–1, Figure 5F).
2.5. Histological Analysis
To verify MRI/SPECT observations histologically, three rats in each group were sacrificed after 1- to 14-day (125)I-fSiO4@SPIO particle or (125)I-fSiO4@SPIO-labeled MSC injection. Prussian blue staining and fluorescent microscopy of brain tissues indicated that one day after IC injection, labeled MSCs mainly stayed at the injection site. After three-day injection, consistent with MRI/SPECT imaging, both Prussian blue staining and fluorescent microscopy revealed that the labeled cells initiated migration from the injection site to the contralateral hemisphere along the corpus callosum. After 7- or 14-day injection, labeled MSCs were indeed found in the lesion area (Figure 6A), while (125)I-fSiO4@SPIO particles remained confined to the injection site (Figure S2, Supporting Information). However, when injected via IV, (125)I-fSiO4@SPIO-labeled MSCs mainly deposited in the lung capillaries (Figure 6B).
Figure 6.
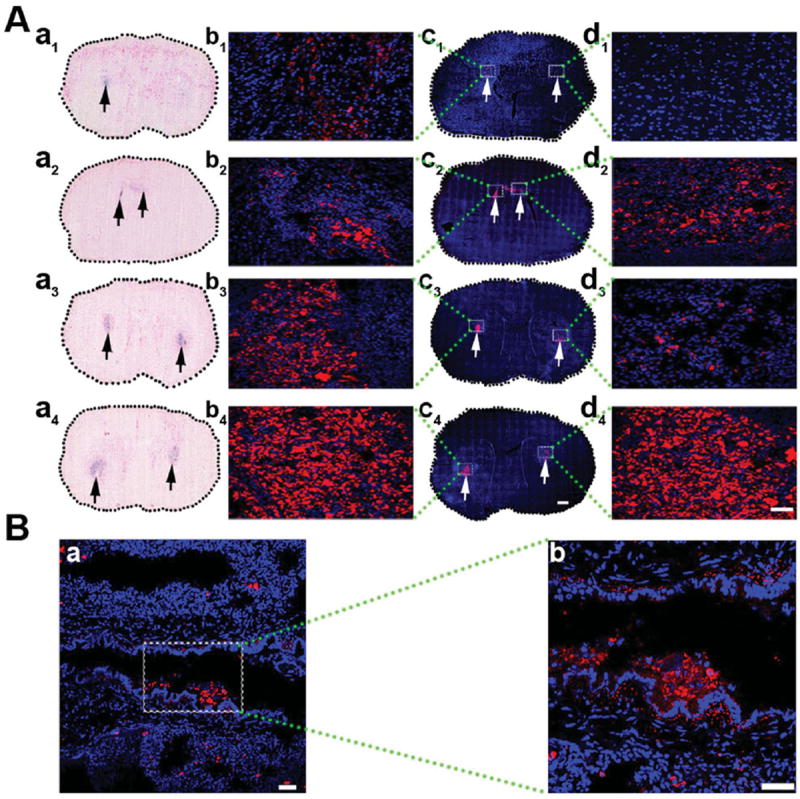
Histological analysis of (125)I-fSiO4@SPIO-labeled MSCs in brain and lung. A) Prussian blue staining and confocal images of brain sections at day 1 (a1, c1), day 3 (a2, c2), day 7 (a3, c3), and day 14 (a4, c4) post IC transplantation of (125)I-fSiO4@SPIO-labeled MSCs. a1–a4) Prussian blue staining; c1–c4) confocal images. Scale bar = 500 μm. The left is the injection side and the right is the ischemic side. Arrows indicate the localization of labeled MSCs. (b1–b4) and (d1–d4) are magnified views of coronal sections corresponding to the white boxes in c1–c4. Scale bar = 50 μm. B) Confocal images of lung after 14 days of IV injection of (125)I-fSiO4@SPIO-labeled MSCs (a, red) in ischemic rats. Cell nuclei were counterstained with DAPI (blue). Scale bar = 50 μm. b) Magnified views of boxed area in a. Scale bar = 100 μm.
2.6. Effect of Injection Routes on Therapeutic Efficacy
To evaluate the effect of the transplantation routes on the therapeutic efficacy, 1 × 10⁶ MSCs were injected IC or IV. After 14-day cell transplantation, compared with the control groups, the brain infarct volumes of both groups were not attenuated (Figures 7A,B). Behavioral tests showed that there was no significant difference between MSC-treated groups and control groups after 1- or 3-day cell transplantation. However, after 7- or 14-day cell transplantation, rotarod test, neurological scores, and elevated body swing test (EBST) were significantly improved in the IV or IC transplanted groups compared with the control group, (Figures 7C–E, p < 0.05).
Figure 7.
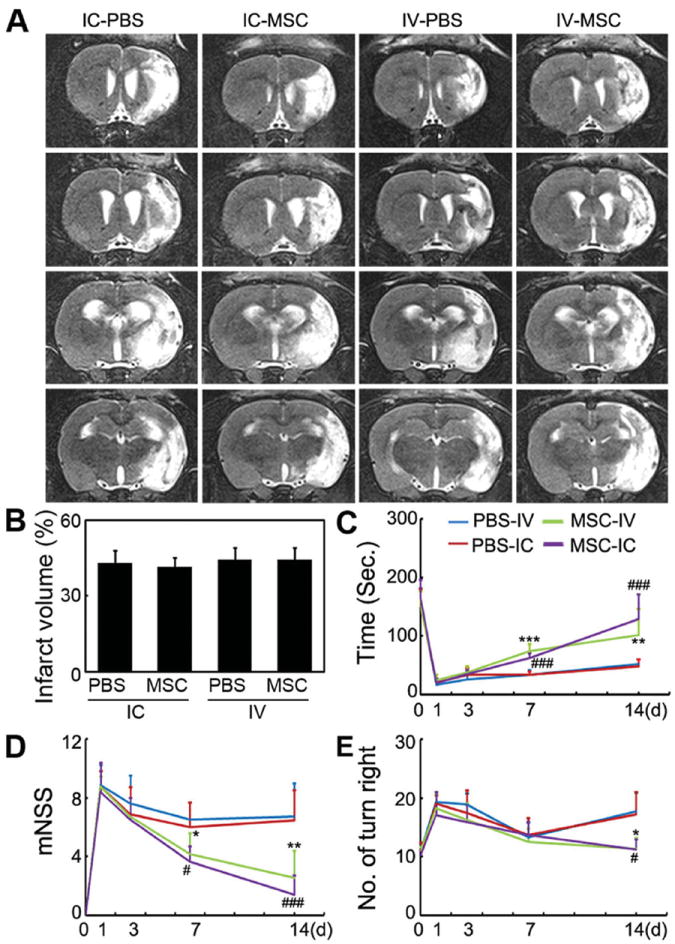
IC and IV injections of MSCs improved functional recovery of brain, but did not attenuate infarct volume. A) A representative set of T2-weighted coronal brain MR images in ischemic rats after IC and IV MSC injection. White area indicates infarct area. B) Infarct volume after treatment in the four groups from (A). Functional recovery was evaluated using a Rotarod test (C), neurological scores (D), and elevated body swing test (E). Behavioral tests were performed at one day before MCAO and after 1- to 14-day cell transplantation. Data are mean ± SD, n = 8 per group. *, p < 0.05, **, p < 0.01, and ***, p < 0.001, IC-MSC versus IC-PBS; #, p < 0.05, and ###, p < 0.001, IV-MSC versus IV-PBS.
2.7. Real-Time PCR
To explore the underlying therapeutic mechanisms of MSCs for treatment of cerebral ischemia, real-time PCR was performed to examine the mRNA levels of vascular endothelial growth factor (VEGF), basic fibroblast growth factor (bFGF), insuline growth factor (IGF), and tissue inhibitor of matrix metalloproteinase-3 (TIMP-3) in the blood, brain, and lung. After IC injection, the levels of TIMP-3 in the blood and the brain, as well as VEGF in the brain were elevated (Figures 8A,B). While after IV injection the levels of VEGF, bFGF, and TIMP-3 in the blood were increased, VEGF in the brain and TIMP-3 in the lung were also upregulated (Figure 8C).
Figure 8.
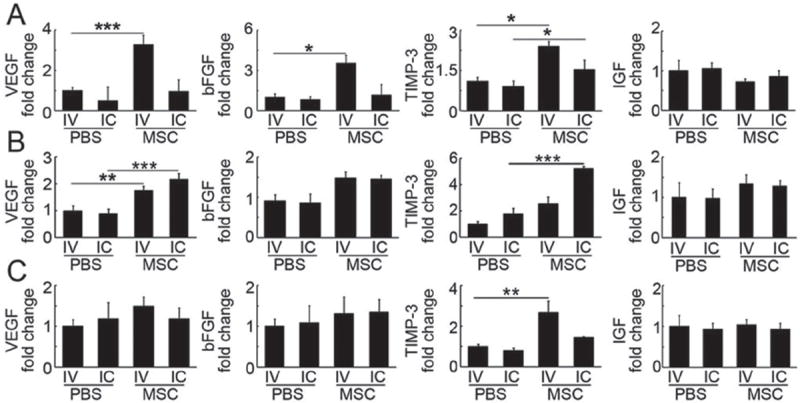
mRNA levels of growth factors in blood, brain, and lung after MSC injection. Bar graphs represent mRNA levels of VEGF, bFGF, TIMP-3, and IGF in blood (A), brain (B), and lung (C) after IC or IV injection of MSCs and PBS. Data are normalized to the IV-PBS group and expressed as mean ± SD. n = 6 per group. *, p < 0.05, **, p < 0.01, and ***, p < 0.001.
3. Discussion
Therapeutic strategies based on transplantation of stem cells hold great promise for treatment of stroke.[28,29] One of the main goals is to obtain long-term and noninvasive imaging of transplanted stem cells in the host organ, to monitor their migration, differentiation and to understand the mechanism of the therapy. In this context, we first prepared an (125)I-fSiO4@ SPIO tri-modal probe, we then examined migration and distribution of the labeled MSCs injected via IC and IV in ischemic rats by SPECT and MRI. Finally, the therapeutic efficacy and the possible mechanism of MSCs transplanted via IC and IV were explored. IC-infused MSCs migrated to the lesion site along the corpus callosum and IV-injected MSCs were mainly entrapped in the lung. However, for both delivery routes, the neurobehavioral outcomes were significantly improved after 14-day cell transplantation, but the ischemic volumes were not reduced. The neurobehavioral recovery may arise from upregulation of VEGF, bFGF, and TIMP-3 in blood, brain, or lung after MSC transplantation.
Currently, a wide variety of imaging techniques have been explored for cell imaging.[30,31] However, each imaging modality has its own strengths and limitations, and multimodal imaging is expected to achieve more accurate information of the transplanted cells.[32,33] In this context, we synthesized an MRI/SPECT/fluorescent tri-modal probe by labeling fluorescent silica coated SPIOs with 125iodine, which allowed us to track the labeled MSCs in vivo with high spatial resolution and anatomical localization by MRI and high sensitivity by SPECT. SPIOs were used for MR cell imaging because it is more sensitive and biocompatible than gadolinium-based agents.[32] Clinically approved dextran-coated SPIOs have been extensively explored for MR cell imaging.[34,35] However, the limitation of the SPIOs for cell imaging are the low cell labeling efficiency and prone to degradation in cytoplasm.[36,37] We coated SPIO particles with silica since it is biocompatible and resistant to biodegradation in cellular environments,[38-41] preventing the SPIO core from rapid biodegradation. To achieve SPECT imaging, 125iodine was selected because of its relatively longer half-life (t1/2 = 59 days) compared with other radioisotopes commonly used for stem cell SPECT imaging, such as 111In (t1/2 = 2.8 days),[42-44]99mTc (t1/2 = 6 h),[42,45] and 18F (t1/2 = 109 min),[23] enabling long-term tracking of labeled cells.[46] Another feature of our probe is that it allows SPIOs and radioisotope labeling simultaneously. This one-step labeling method is more convenient for cell labeling than previous sequential two-step methods.[25]
I-fSiO4@SPIOs has marginal effect on the viability of MSCs when labeled at a concentration of 0.1 × 10⁻³ m for 1 h. However, a high radiation dose has a cytotoxic effect. When MSCs were labeled with a radiation dose of 100 μCi/million cells, cell death was significant immediately after labeling. This phenomenon has also been observed by others for 111In labeled hematopoietic progenitor cells and MSCs.[25,42] However, a lower radiation dose (20 μCi/million cells) had a negligible effect on cell viability, differentiation potential, and proliferation. More importantly, the migratory capability of MSCs was not impaired. The migration of (125)I-fSiO4@SPIO-labeled MSCs from the injection to the lesion site could be dynamically observed by MRI and SPECT imaging.
For stroke therapy, MSCs have been delivered by IC,[47] IA, and IV injections,[48] and some therapeutic benefits have been achieved. However, there are very limited reports on long-term engraftment patterns of the transplanted cells. In the current study, we transplanted 1 × 10⁶ (125) I-fSiO4@SPIO-labeled MSCs into ischemic rats via IC and IV injection, and monitored their homing and migration over time with quantification of the final cell numbers. Our data showed that for IC injection, (125)I-fSiO4@SPIO-labeled MSCs migrated to the contralateral hemisphere via the corpus callosum after three-day injection. After 7- or 14-day cell injection, 21.04% ± 7.2% and 35.19% ± 5.9% transplanted MSCs accumulated in the lesion area. If cell death and possible exocytosis of the probe are not considered,[49] the amount of MSCs homing to the lesion are 2.1 × 10⁵ and 3.5 × 10⁵ cells, respectively. No radioactivity was visible in other organs after IC injection. This finding was further confirmed by biodistribution studies with γ-ray counting analysis of isolated organ samples after SPECT imaging. For IV injection, neither MRI nor SPECT imaging could detect labeled cells in ischemic brain, with cells mainly entrapped in the lung. This lung entrapment of MSCs following IV injection has also reported by other authors,[20,50,51] which is different from that of neural progenitor cells, which have been reported to home to ischemic sites after IV injection.[52,53] This differential lung entrapment of MSCs may be explained by their relatively large size (≈25 μm) and natural expression of adhesion molecules.[51,54] Gamma counting of isolated organs also revealed the high uptake of labeled cells in the lung, with negligible amounts in liver, spleen, and kidney, and no radioactivity could be detected in the brain after 14-day injection.
Biodistribution of IC and IV transplanted MSCs differed markedly, however, the cells transplanted by both routes improved brain functional recovery. Previous studies suggested that functional recovery may result from the production of an array of neurotrophins and bioactive factors, such as VEGF, insulin growth factor-1 (IGF), and nerve growth factor, which were found to be secreted from grafted MSCs.[55] We found that the migratory MSCs did not differentiate into neurons (NeuN+), astrocytes (GFAP+), or endothelial cells (CD31+, Figure S4, Supporting Information). VEGF, bFGF, and TIMP-3 were upregulated in blood, brain, and lung following IC and IV injections. IC injection increased the VEGF level in brain, and also significantly upregulated TIMP-3 in both brain and blood. IV injection of MSCs increased bFGF levels in blood, VEGF in the brain and blood, and TIMP-3 in both blood and lung. IGF was not significantly upregulated in blood, brain, or lung following either IV or IC injection. VEGF and bFGF are key regulators for angiogenesis and neurogenesis, which are beneficial for behavioral recovery after ischemic stroke. IV transplantation of MSCs upregulated VEGF and bFGF expression, induced angiogenesis and neurogenesis, and improved functional recovery.[56] TIMP-3, a tissue inhibitor of matrix metalloproteinase, has been shown to be activated after stroke.[57] IV-injected MSCs in mice with traumatic brain injury protected blood-brain barrier integrity through TIMP-3 release in circulating blood and the lung, whereas attenuation of TIMP-3 expression blocked the beneficial effects of MSCs.[58] The functional recovery of brain observed in our current study may arise from the synergic effects of neurotrophins (VEGF and bFGF) and TIMP-3, which are upregulated after MSC transplantation. Furthermore, studies on the underlying mechanisms of MSC-based therapy are warranted.
4. Conclusion
A MRI/SPECT/fluorescent tri-modal probe was synthesized and used to label MSCs. IC-injected MSCs migrated to the lesion site along the corpus callosum, while MSCs injected IV were mainly trapped in lung. However, for both delivery routes, the neurobehavioral outcomes were significantly improved 14 days post MSC injection, yet no reduction in the ischemic lesion volume was observed. Partial functional recovery of ischemic rats after MSC transplantation may result from upregulation of the TIMP-3 and the neurotrophins VEGF and bFGF.
5. Experimental Section
Synthesis and Characterization of MRI/SPECT/Fluorescent Tri-Modal Probe
The MRI/SPECT/fluorescent tri-modal probe was prepared by three steps: 1) synthesis of SPIOs; 2) surface coating SPIOs with fluorescent dye-doped silica; and 3) 125iodine labeling. Fluorescent silica coated SPIO particles were prepared according to our previous procedure with little modifications.[59] For 125iodine labeling, N-succinimidyl-3-(tri-n-butyl stannyl) benzoate (ATE, Sigma, San Louis, MO) was conjugated onto fSiO4@SPIOs by mixing ATE (5 mg) and fSiO4@SPIOs (10 mg) into ethanol (10 mL) and stirring for 10 h. 125Iodine labeling was achieved by the Iodogen oxidization method.[60] Finally, carrier free Na 125I (1 mCi) and ATE-modified fSiO4@SPIOs (1 mg, 300 μL) were added into Iodogen-coated glass vials and vortexed for 5 min. 125Iodine labeled fSiO4@SPIOs were retrieved by a magnet and washed with PBS three times. The labeling efficiency and stability of 125iodine were evaluated with thin layer chromatography. Nonradioactive iodine labeled fSiO4@SPIOs (I-fSiO4@SPIOs) was also prepared as a cold probe. The morphology, size, and size distribution of hydrophobic SPIOs and I-fSiO4@SPIOs were characterized by transmission electron microscope (TEM, JEOL 2100F, Japan) at an acceleration voltage of 200 kV. The particle size and size distribution were calculated using an image analysis program by measuring the diameter of >300 individual particles. The zeta potentials of fSiO4@SPIOs and ATE-modified fSiO4@SPIOs were measured in water at pH 7.4 using a Zeta2000 Potential Analyzer (Malvern, UK). MR relaxometry of I-fSiO4@SPIOs was performed using a 1.41 T minispec mq60 NMR Analyzer (Bruker, Germany) and CPMG sequence. The T2 relaxivity was calculated from the inverse T2 as a function of iron concentration.
MSC Isolation, Characterization, and Labeling
Animal protocols were approved by the Institutional Animal Care and Use Committee, Shanghai Jiao Tong University. MSCs were isolated from adult Sprague Dawley rats as previously described.[61] Briefly, femurs and tibias were removed and the ends were snipped off. The bone marrow cavity was flushed with sterilized PBS. The effluent was suspended in high glucose DMEM cell culture medium (Gibco, Carlsbad, CA) and cultured for 48 h. MSCs were isolated by their adherence to culture plastic. The nonadherent cells were removed and adherent cells were further cultured. The culture medium was changed every 3 days. MSCs were characterized by immunocytochemistry and flow cytometry (FACSArial II, BD Falcon, San Jose, CA) using CD90 (1:100, ebioscience, San Diego, CA), CD105 (1:300, R&D systems, Tustin, CA), CD29 (1:100, ebioscience), CD34 (1:300, BD Falcon), CD45 (1:100, ebioscience), and CD31(1:50, BD Falcon). MSCs between passages 3 and 6 were used for all experiments. To optimize cell labeling conditions, MSCs were incubated with I-fSiO4@SPIO at different concentrations (0.01, 0.05, 0.1, and 0.5 × 10⁻³ m Fe) for 1 h or at a concentration of 0.1 × 10⁻³ m for different periods of time (10, 30, 60, and 120 min). After labeling, cells were washed with 10 × 10−3 m PBS (pH = 7.4) three times, trypsinized, and suspended in PBS. The labeling efficiency was analyzed by flow cytometry, with emission wavelength ranging from 650 to 670 nm. To further determine the cell labeling efficiency, one million cells were processed to measure the intracellular iron content with an inductively coupled plasma optical emission spectrometer (ICP-OES, ICAP-6300, Thermo Fisher, Portsmouth, New Hampshire). Thirty thousand cells were suspended in 0.3 mL of 2 wt% gelatin to determine the T2 relaxation rate of labeled cells with a 1.41 T minispec mq60 NMR Analyzer (Bruker, Germany), using a CPMG sequence.
Cellular Internalization of I-fSiO4@SPIOs
To investigate whether I-fSiO4@SPIOs were internalized by the cells, confocal microscopy studies were performed. MSCs were grown on cover slips and incubated with I-fSiO4@SPIOs at a concentration of 0.1 × 10⁻³ m Fe for 1 h. Labeled cells were imaged using a Leica TCS SP5 confocal system (Leica, Mannheim, Germany). Horizontal z-stacks were obtained by capturing images with a 0.5 μm interslice distance along the z-axis.
Effects of (125)I-fSiO4@SPIO Labeling on MSC Viability, Differentiation, and Proliferation
To investigate the effect of I-fSiO4@SPIO labeling, 1 × 10⁴ MSCs were seeded in a 96-well plate and incubated with 200 μl I-fSiO4@SPIOs at different concentrations (0, 0.05, 0.1, and 0.5 × 10⁻³ m Fe) for 1 h or at a concentration of 0.1 × 10⁻³ m Fe for different periods of time (10, 30, 60, and 120 min). To investigate the effect of radiation dose, MSCs were seeded in twelve-well plates. (125)I-fSiO4@SPIOs (a mixture of I-fSiO4@SPIOs and 125I-fSiO4@SPIOs with different ratio) were then added into each well with the same concentration (0.1 × 10⁻³ m Fe), but different radiation doses (0, 2, 10, 20, and 100 μCi/million cells). After 1 h incubation, the culture media was removed and cells were washed with PBS three times. A CCK-8 assay (CCK-8, Dojindo, Kumamoto, Japan) was performed immediately and after 1- to 14-day labeling according to the manufacturer’s instructions. To evaluate whether (125)I-fSiO4@SPIO labeling affects the differentiation of MSCs, adipogenic and osteogenic differentiation of labeled MSCs was performed as previously described.[62,63] Then cells were fixed with 4% paraformaldehyde and stained with oil red or Alizarin Red S according to the manufacturer’s instructions (STEMPRO, Gibco). To investigate whether (125)I-fSiO4@SPIO labeling affects the proliferation of MSCs, a BrdU incorporation assay was performed. After MSCs were labeled with (125)I-fSiO4@SPIOs, the culture medium was removed. After three times washing, fresh culture medium containing 10 μM BrdU was added and cells were cultured for 24 h. BrdU staining was performed as described previously.[64] Images were acquired using LAS AF Software (Leica, Mannheim, Germany). Labeled cells were also stained with DAPI for total cell counting. Three coverslips were evaluated and six fields were randomly chosen for each coverslip. The proliferation rate was calculated by dividing the number of BrdU+ cells to the total amount.
Transient Middle Cerebral Artery Occlusion Model
48 adult male Sprague Dawley rats weighing from 250 to 300 g were used. Rats were anesthetized with ketamine/xylazine (100 mg/10 mg kg−1, Sigma) intraperitoneally. Body temperature was maintained at 37 ± 0.5 °C using a heating pad (RWD Life Science, Shenzhen, China). Animal surgery was performed following as previously described.[65] The success of occlusion was determined by monitoring the decrease of surface cerebral blood flow to 20% of baseline value using Laser Doppler flowmetry (Moor LAB, Moor Instruments, Devon, UK). Reperfusion was performed by withdrawing the suture after 2 h MCAO.
In Vivo MR and SPECT/CT Imaging of Transplanted MSCs
After 24 h MCAO, rats were divided into six groups with eight rats in each group. (125)I-fSiO4@SPIO-labeled MSCs (1 × 10⁶, ≈15 μCi) or nonlabeled MSCs, and (125)I-fSiO4@SPIO (15 μCi) were injected into rats IV or IC. For IC injection, the following coordinates were used: AP 0.5 mm; L 3.0 mm contralateral to the infarct hemisphere; V 4.0 mm. MR imaging was performed before and after 1- to 14-day cell transplantation using a 3 T MRI scanner (TrioTim, Siemens) equipped with a customized radio frequency coil for excitation and signal reception. The radio frequency coil was designed as a cylindrical volume resonator with an inner diameter of 50 mm and a usable length of 80 mm. A T2-weighted fast spin echo sequence was used with the following parameters: TR = 5840 ms, TE = 106 ms, FOV = 60 mm × 60 mm, matrix = 256 × 256, slice thickness = 1.5 mm, and NEX = 4. The T2 relaxation times of the ischemic area before and after injection of labeled cells, nonlabeled cells or probe only were determined for the IC and IA injection groups using a T2 MAP multislice multiecho sequence (TR = 3500 ms, TE range = 20–160 ms, 8 echoes, FOV = 60 mm × 60 mm, matrix = 256 × 256, slice thickness = 1.5 mm). SPECT/CT images were obtained with a small-animal imaging system (Bioscan, Washington DC). CT images were used to provide an anatomical reference to the location of the brain. SPECT images were obtained at 32 projections over 360° (radius of rotation, ROR = 7.6 cm, 30 s/projection). Reconstructed data from SPECT and CT were visualized and coregistered using in vivo Scope software (Bioscan, Washington, DC). For calculation of the radioactivity of injected cells in vivo, serial SPECT imaging of brain and whole-body images were acquired on anesthetized rats. SPECT parameters for brain and whole body imaging were a 256 × 256 pixel matrix (1 mm pixel −1), 32 projections acquired over 360°, and 26 and 30 keV 125iodine energy windows (20%). View of interest analysis was conducted on reconstructed SPECT images to generate radioactivity by inviCRO 3D ROIs software, which was corrected for physical decay.
Biodistribution of (125)I-fSiO4@SPIO-Labeled MSCs
After SPECT/CT imaging, the rats were sacrificed and dissected. The distribution of (125)I-fSiO4@ SPIO-labeled MSCs in vivo was evaluated. For this purpose, the whole right brain, left brain, spleen, kidney, lung, and samples of liver and intestines were saline-rinsed, paper-blotted, and placed into preweighed plastic test tubes. The activity was determined in a welltype scintillation detector along with 3 × 0.5 mL aliquots of the diluted standard representing 100% of the injected dose. Mean activities were used to obtain the percentage of injected dose per gram of tissue (% ID g−1).
Effect of Injection Routes on The Therapeutic Efficacy
To investigate the therapeutic effect of MSCs transplanted by different routes, MCAO rats were transplanted with nonlabeled plain MSCs (1 × 10⁶) injected IC or IV and behavioral tests were conducted. Animals were trained three times per day for three consecutive days prior to surgery. The tests were performed before MCAO and after 1- to 14-day cell transplantation blindly. Modified neurologic severity scores, rotarod test, and elevated body swing test (EBST) were performed as previously described.[52,61,66] After behavioral testing, MR imaging of rat brains was performed to evaluate the size of infarct volumes with a T2-weighted fast spin echo sequence (TR = 5840 ms, TE = 106 ms, FOV = 60 mm × 60 mm, matrix = 256 × 256, slice thickness = 1.5 mm, NEX = 4). The infarct volume (%) was calculated by the following formula: 100% × (the area of contralateral hemisphere—intact area of the lesion hemisphere)/the area of contralateral hemisphere.
(Immuno)histochemical Studies
Three rats in each group were sacrificed at 14 days after injection of (125)I-fSiO4@SPIOs or (125)I-fSiO4@ SPIO-labeled MSCs. The whole brain, and samples of lung, spleen, liver, and kidney were removed, frozen and then sectioned into 20 μm thick slices. The (125)I-fSiO4@SPIO-labeled MSCs present in different tissues could be directly observed by microscopy owing to the fluorescent properties of the label. Prussian blue staining of brain tissues was also performed as previously described.[53] For immunohistochemistry, brain sections were blocked with 10% bovine serum albumin (BSA) (Sigma), and then incubated with mouse anti-NeuN (1:100, Millipore, Billerica, MA), rabbit anti glial fibrillary acidic protein (GFAP) (1:100, Millipore), goat-anti CD31 (1:100, R&D systems, Tustin, CA), and mouse anti- SM-actin (1:100, Abcam, Cambridge, UK) at 4 °C overnight. Secondary antibodies were appropriate Alexa Fluor 488 labeled IgG antibodies (Invitrogen, Carlsbad, CA).
Real-Time PCR
RNA from rat brain, lung, and circulating blood was isolated using TRIzol reagent (Invitrogen). The concentration was determined by a spectrophotometer (NanoDrop 1000, Thermo, Wilmington, DE). cDNA was synthesized using a PrimeScript RT reagent kit (TaKaRa, Dalian, China). Real-time PCR was performed by a fast real-time PCR system (7900HT, ABI, Foster, CA) using SYBR Green Ex Taq Kit (TaKaRa). mRNA levels of TIMP-3, bFGF, IGF, and VEGF were normalized to the endogenous control glyceraldehyde phosphate dehydrogenase (GAPDH) expression in triplicate and was calculated by the 2 −Δ Ct method.[67]
Statistical Analysis
All values are presented as mean ± standard deviation. For behavioral data, a two-way repeated analysis of variance was performed to analyze the overall difference between groups over time, and then Bonferroni-corrected post hoc comparisons were used to analyze the difference for each time point. Other data were analyzed by one-way ANOVA, followed by Turkey post hoc comparisons. Two-tailed p < 0.05 values were considered statistically significant. All statistical analyses were performed using SPSS software (v18.0) (SPSS Inc., Chicago, IL).
Supplementary Material
Acknowledgments
This work was supported by the National Key Basic Research Program of China (973 Program), 2010CB834303 and 2010CB933901 (C.Z.), 2011CB504405 (G.Y.Y., Y.W.), the National Natural Science Foundation of China, 81230030 and 30870682 (C.Z.), U1232205 (G.Y.Y.), and 81371305 (Y.W.), Shanghai Jiao Tong University Foundation for technological innovation of major projects 12×190030021 (G.Y.Y.), the Science and Technology Commission of Shanghai Municipality, 13140903500 (G.Y.Y.), and 13ZR1422600 (Z.J.Z.).
Footnotes
Supporting Information
Supporting Information is available from the Wiley Online Library or from the author.
Contributor Information
Yaohui Tang, State Key Laboratory of Oncogenes and Related Genes, School of Biomedical Engineering, Shanghai Jiao Tong University, Shanghai 200030, China.
Dr. Chunfu Zhang, Email: cfzhang@sjtu.edu.cn, State Key Laboratory of Oncogenes and Related Genes, School of Biomedical Engineering, Shanghai Jiao Tong University, Shanghai 200030, China; School of Biomedical Engineering and Med-X Research Institute, Shanghai Jiao Tong University, Shanghai 200030, China.
Jixian Wang, Department of Neurology, Shanghai Ruijin Hospital, School of Medicine, Shanghai Jiao Tong University, Shanghai 200030, China.
Xiaojie Lin, School of Biomedical Engineering and Med-X Research Institute, Shanghai Jiao Tong University, Shanghai 200030, China.
Lu Zhang, School of Biomedical Engineering and Med-X Research Institute, Shanghai Jiao Tong University, Shanghai 200030, China.
Yi Yang, School of Biomedical Engineering and Med-X Research Institute, Shanghai Jiao Tong University, Shanghai 200030, China.
Dr. Yongting Wang, School of Biomedical Engineering and Med-X Research Institute, Shanghai Jiao Tong University, Shanghai 200030, China
Dr. Zhijun Zhang, School of Biomedical Engineering and Med-X Research Institute, Shanghai Jiao Tong University, Shanghai 200030, China
Prof. Jeff W. M. Bulte, Russell H. Morgan Department of Radiology and Radiological Science, Division of MR Research, Cellular Imaging Section, Institute for Cell Engineering, The Johns Hopkins University School of Medicine, Baltimore, MD 21205, USA
Prof. Guo-Yuan Yang, Email: gyyang0626@163.com, School of Biomedical Engineering and Med-X Research Institute, Shanghai Jiao Tong University, Shanghai 200030, China; Department of Neurology, Shanghai Ruijin Hospital, School of Medicine, Shanghai Jiao Tong University, Shanghai 200030, China.
References
- 1.Lindvall O, Kokaia Z. Nature. 2006;441:1094. doi: 10.1038/nature04960. [DOI] [PubMed] [Google Scholar]
- 2.Hess DC, Borlongan CV. Expert Rev Neurother. 2008;8:1193. doi: 10.1586/14737175.8.8.1193. [DOI] [PMC free article] [PubMed] [Google Scholar]
- 3.Bhasin A, Srivastava MV, Mohanty S, Bhatia R, Kumaran SS, Bose S. Clin Neurol Neurosurg. 2013;115:1003. doi: 10.1016/j.clineuro.2012.10.015. [DOI] [PubMed] [Google Scholar]
- 4.Cromer Berman SM, Walczak P, Bulte JW. Wiley Interdiscip Rev Nanomed Nanobiotechnol. 2011;3:343. doi: 10.1002/wnan.140. [DOI] [PMC free article] [PubMed] [Google Scholar]
- 5.Cheng L, Wang C, Ma X, Wang Q, Cheng Y, Wang H, Li Y, Liu Z. Adv Funct Mater. 2013;23:272. [Google Scholar]
- 6.Xu C, Miranda-Nieves D David, Ankrum JA, Matthiesen ME, Phillips JA, Roes IG, Wojtkiewicz R, Juneja V, Kultima JR, Zhao W, Vemula PK, Lin CP, Nahrendorf M, Karp JM. Nano Lett. 2012;12:4131. doi: 10.1021/nl301658q. [DOI] [PMC free article] [PubMed] [Google Scholar]
- 7.Srinivas M, Boehm-Sturm P, Figdor CG, de Vries IJ, Hoehn M. Biomaterials. 2012;33:8830. doi: 10.1016/j.biomaterials.2012.08.048. [DOI] [PubMed] [Google Scholar]
- 8.Bengel FM. J Nucl Cardiol. 2011;18:966. doi: 10.1007/s12350-011-9436-2. [DOI] [PubMed] [Google Scholar]
- 9.Kircher MF, Gambhir SS, Grimm J. Nat Rev Clin Oncol. 2011;8:677. doi: 10.1038/nrclinonc.2011.141. [DOI] [PubMed] [Google Scholar]
- 10.Ito T, Itakura S, Todorov I, Rawson J, Asari S, Shintaku J, Nair I, Ferreri K, Kandeel F, Mullen Y. Transplantation. 2010;89:1438. doi: 10.1097/tp.0b013e3181db09c4. [DOI] [PubMed] [Google Scholar]
- 11.Wu T-J, Tzeng Y-K, Chang W-W, Cheng C-A, Kuo Y, Chien C-H, Chang H-C, Yu J. Nat Nanotechnol. 2013;8:682. doi: 10.1038/nnano.2013.147. [DOI] [PMC free article] [PubMed] [Google Scholar]
- 12.Liu Y, He ZJ, Xu B, Wu QZ, Liu G, Zhu H, Zhong Q, Deng DY, Ai H, Yue Q, Wei Y, Jun S, Zhou G, Gong QY. Brain Res. 2011;1931:24. doi: 10.1016/j.brainres.2011.03.032. [DOI] [PubMed] [Google Scholar]
- 13.Agudelo CA, Tachibana Y, Hurtado AF, Ose T, Iida H, Yamaoka T. Biomaterials. 2012;33:2439. doi: 10.1016/j.biomaterials.2011.11.075. [DOI] [PubMed] [Google Scholar]
- 14.Wang Y, Xu F, Zhang C, Lei D, Tang Y, Xu H, Zhang Z, Lu H, Du X, Yang G-Y. Nanomedicine. 2011;7:1009. doi: 10.1016/j.nano.2011.03.006. [DOI] [PubMed] [Google Scholar]
- 15.Zhang L, Wang Y, Tang Y, Jiao Z, Xie C, Zhang H, Gu P, Wei X, Yang G-Y, Gu H, Zhang C. Nanoscale. 2013;5:4506. doi: 10.1039/c3nr00119a. [DOI] [PubMed] [Google Scholar]
- 16.Hoehn M, Kustermann E, Blunk J, Wiedermann D, Trapp T, Wecker S, Focking M, Arnold H, Hescheler J, Fleischmann BK, Schwindt W, Buhrle C. Proc Natl Acad Sci U S A. 2002;99:16267. doi: 10.1073/pnas.242435499. [DOI] [PMC free article] [PubMed] [Google Scholar]
- 17.Freund B, Tromsdorf UI, Bruns OT, Heine M, Giemsa A, Bartelt A, Salmen SC, Raabe N, Heeren J, Ittrich H, Reimer R, Hohenberg H, Schumacher U, Weller H, Nielsen P. ACS Nano. 2012;6:7318. doi: 10.1021/nn3024267. [DOI] [PubMed] [Google Scholar]
- 18.Culver J, Akers W, Achilefu S. J Nucl Med. 2008;49:169. doi: 10.2967/jnumed.107.043331. [DOI] [PubMed] [Google Scholar]
- 19.Massoud TF, Gambhir SS. Genes Dev. 2003;17:545. doi: 10.1101/gad.1047403. [DOI] [PubMed] [Google Scholar]
- 20.Barbash IM, Chouraqui P, Baron J, Feinberg MS, Etzion S, Tessone A, Miller L, Guetta E, Zipori D, Kedes LH, Kloner RA, Leor J. Circulation. 2003;108:863. doi: 10.1161/01.CIR.0000084828.50310.6A. [DOI] [PubMed] [Google Scholar]
- 21.Aicher A, Brenner W, Zuhayra M, Badorff C, Massoudi S, Assmus B, Eckey T, Henze E, Zeiher AM, Dimmeler S. Circulation. 2003;107:2134. doi: 10.1161/01.CIR.0000062649.63838.C9. [DOI] [PubMed] [Google Scholar]
- 22.Adonai N, Nguyen KN, Walsh J, Iyer M, Toyokuni T, Phelps ME, McCarthy T, McCarthy DW, Gambhir SS. Proc Natl Acad Sci U S A. 2002;99:3030. doi: 10.1073/pnas.052709599. [DOI] [PMC free article] [PubMed] [Google Scholar]
- 23.Wolfs E, Struys T, Notelaers T, Roberts SJ, Sohni A, Bormans G, Laere KV, Luyten FP, Gheysens O, Lambrichts I, Verfaillie CM, Deroose CM. J Nucl Med. 2013;54:447. doi: 10.2967/jnumed.112.108316. [DOI] [PubMed] [Google Scholar]
- 24.Chao F, Shen Y, Zhang H, Tian M. Biomed Res Int. 2013;2013:849819. doi: 10.1155/2013/849819. [DOI] [PMC free article] [PubMed] [Google Scholar]
- 25.Kraitchman DL, Tatsumi M, Gilson WD, Ishimori T, Kedziorek D, Walczak P, Segars WP, Chen HH, Fritzges D, Izbudak I, Young RG, Marcelino M, Pittenger MF, Solaiyappan M, Boston RC, Tsui BMW, Wahl RL, Bulte JWM. Circulation. 2005;112:1454. doi: 10.1161/CIRCULATIONAHA.105.537480. [DOI] [PMC free article] [PubMed] [Google Scholar]
- 26.Sun S, Zeng H, Robinson DB, Raoux S, Rice PM, Wang SX, Li G. J Am Chem Soc. 2004;126:273. doi: 10.1021/ja0380852. [DOI] [PubMed] [Google Scholar]
- 27.Zalutsky MR, Narula AS. Int J Radiat Appl Instrum Part A Appl Radiat Isotopes. 1987;38:12. doi: 10.1016/0883-2889(87)90069-4. [DOI] [PubMed] [Google Scholar]
- 28.Liu X, Ye R, Yan T, Yu SP, Wei L, Xu G, Fan X, Jiang Y, Stetler RA, Liu G, Chen J. Prog Neurobiol. 2014;115:92. doi: 10.1016/j.pneurobio.2013.11.007. [DOI] [PMC free article] [PubMed] [Google Scholar]
- 29.Lindvall O, Kokaia Z. Nature. 2006;441:1094. doi: 10.1038/nature04960. [DOI] [PubMed] [Google Scholar]
- 30.Wang C, Ma X, Ye S, Cheng L, Yang K, Guo L, Li C, Li Y, Liu Z. Adv Funct Mater. 2012;22:2363. [Google Scholar]
- 31.Srivastava AK, Bulte JWM. Stem Cell Rev and Rep. 2014;10:127. doi: 10.1007/s12015-013-9468-x. [DOI] [PMC free article] [PubMed] [Google Scholar]
- 32.Ahrens ET, Bulte JW. Nat Rev Immunol. 2013;13:755. doi: 10.1038/nri3531. [DOI] [PMC free article] [PubMed] [Google Scholar]
- 33.Xu C, Mu L, Roes I, Miranda-Nieves D, Nahrendorf M, Ankrum JA, Zhao W, Karp JM. Nanotechnology. 2011;22:494001. doi: 10.1088/0957-4484/22/49/494001. [DOI] [PMC free article] [PubMed] [Google Scholar]
- 34.Bulte JW. Am J Roentgenol. 2009;193:314. doi: 10.2214/AJR.09.3107. [DOI] [PMC free article] [PubMed] [Google Scholar]
- 35.de Vries IJ, Lesterhuis WJ, Barentsz JO, Verdijk P, van Krieken JH, Boerman OC, Oyen WJ, Bonenkamp JJ, Boezeman JB, Adema GJ, Bulte JW, Scheenen TW, Punt CJ, Heerschap A, Figdor CG. Nat Biotechnol. 2005;23:1407. doi: 10.1038/nbt1154. [DOI] [PubMed] [Google Scholar]
- 36.Berman SMC, Walczak P, Bulte JWM. WIREs Nanomed Nanobiotechnol. 2011;3:343. doi: 10.1002/wnan.140. [DOI] [PMC free article] [PubMed] [Google Scholar]
- 37.Taylor A, Wilson KM, Murray P, Fernig DG, Lévy R. Chem Soc Rev. 2012;41:2707. doi: 10.1039/c2cs35031a. [DOI] [PubMed] [Google Scholar]
- 38.Piao Y, Burns A, Kim J, Wiesner U, Hyeon T. Adv Funct Mater. 2008;18:3745. [Google Scholar]
- 39.Aparicio-Ixta L, Ramos-Ortiz G, Pichardo-Molina JL, Maldonado JL, Rodríguez M, Tellez-Lopez VM, Martinez-Fong D, Zolotukhin MG, Fomine S, Meneses-Nava MA, Barbosa-García O. Nanoscale. 2012;4:7751. doi: 10.1039/c2nr31925j. [DOI] [PubMed] [Google Scholar]
- 40.Vivero-Escoto JL, Huxford-Phillips RC, Lin W. Chem Soc Rev. 2012;41:2673. doi: 10.1039/c2cs15229k. [DOI] [PMC free article] [PubMed] [Google Scholar]
- 41.Blechinger J, Bauer AT, Torrano AA, Gorzelanny C, Bräuchle C, Schneider SW. Small. 2013;9:3970. doi: 10.1002/smll.201301004. [DOI] [PubMed] [Google Scholar]
- 42.Brenner W, Aicher A, Eckey T, Massoudi S, Zuhayra M, Koehl U, Heeschen C, Kampen WU, Zeiher AM, Dimmeler S, Henze E. J Nucl Med. 2004;45:512. [PubMed] [Google Scholar]
- 43.Lappalainen RS, Narkilahti S, Huhtala T, Liimatainen T, Suuronen T, Narvanen A, Suuronen R, Hovatta O, Jolkkonen J. Neurosci Lett. 2008;440:246. doi: 10.1016/j.neulet.2008.05.090. [DOI] [PubMed] [Google Scholar]
- 44.Kraitchman DL, Tatsumi M, Gilson WD, Ishimori T, Kedziorek D, Walczak P, Segars WP, Chen HH, Fritzges D, Izbudak I, Young RG, Marcelino M, Pittenger MF, Solaiyappan M, Boston RC, Tsui BM, Wahl RL, Bulte JW. Circulation. 2005;112:1451. doi: 10.1161/CIRCULATIONAHA.105.537480. [DOI] [PMC free article] [PubMed] [Google Scholar]
- 45.Armitage NC, Perkins AC, Pimm MV, Wastie ML, Baldwin RW, Hardcastle JD. Nucl Med Commun. 1985;6:623. doi: 10.1097/00006231-198510000-00003. [DOI] [PubMed] [Google Scholar]
- 46.Pomper MG, Hammond H, Yu X, Ye Z, Foss CA, Lin DD, Fox JJ, Cheng L. Cell Res. 2009;19:370. doi: 10.1038/cr.2008.329. [DOI] [PMC free article] [PubMed] [Google Scholar]
- 47.Kurozumi K, Nakamura K, Tamiya T, Kawano Y, Kobune M, Hirai S, Uchida H, Sasaki K, Ito Y, Kato K, Honmou O, Houkin K, Date I, Hamada H. Mol Ther. 2004;9:189. doi: 10.1016/j.ymthe.2003.10.012. [DOI] [PubMed] [Google Scholar]
- 48.Chen J, Li Y, Wang L, Zhang Z, Lu D, Lu M, Chopp M. Stroke. 2001;32:1005. doi: 10.1161/01.str.32.4.1005. [DOI] [PubMed] [Google Scholar]
- 49.Cromer Berman SM, Kshitiz, Wang CJ, Orukari I, Levchenko A, Bulte JW, Walczak P. Magn Reson Med. 2013;69:255. doi: 10.1002/mrm.24216. [DOI] [PMC free article] [PubMed] [Google Scholar]
- 50.Noort WA, Kruisselbrink AB, in’t Anker PS, Kruger M, van Bezooijen RL, de Paus RA, Heemskerk MH, Lowik CW, Falkenburg JH, Willemze R, Fibbe WE. Exp Hematol. 2002;30:870. doi: 10.1016/s0301-472x(02)00820-2. [DOI] [PubMed] [Google Scholar]
- 51.Gao J, Dennis JE, Muzic RF, Lundberg M, Caplan AI. Cell Tissues Organs. 2001;169:12. doi: 10.1159/000047856. [DOI] [PubMed] [Google Scholar]
- 52.Li L, Jiang Q, Ding G, Zhang L, Zhang ZG, Li Q, Panda S, Lu M, Ewing JR, Chopp M. J Cereb Blood Flow Metab. 2010;30:653. doi: 10.1038/jcbfm.2009.238. [DOI] [PMC free article] [PubMed] [Google Scholar]
- 53.Zhang L, Wang Y, Tang Y, Jiao Z, Xie C, Zhang H, Gu P, Wei X, Yang GY, Gu H, Zhang C. Nanoscale. 2013;5:4506. doi: 10.1039/c3nr00119a. [DOI] [PubMed] [Google Scholar]
- 54.Chin BB, Nakamoto Y, Bulte JW, Pittenger MF, Wahl R, Kraitchman DL. Nucl Med Commun. 2003;24:1149. doi: 10.1097/00006231-200311000-00005. [DOI] [PubMed] [Google Scholar]
- 55.Li Y, Chen J, Chen XG, Wang L, Gautam SC, Xu YX, Katakowski M, Zhang LJ, Lu M, Janakiraman N, Chopp M. Neurology. 2002;59:514. doi: 10.1212/wnl.59.4.514. [DOI] [PubMed] [Google Scholar]
- 56.Chen J, Li Y, Zhang R, Katakowski M, Gautam SC, Xu Y, Lu M, Zhang Z, Chopp M. Brain Res. 2004;1005:21. doi: 10.1016/j.brainres.2003.11.080. [DOI] [PubMed] [Google Scholar]
- 57.Wallace JA, Alexander S, Estrada EY, Hines C, Cunningham LA, Rosenberg GA. J Cereb Blood Flow Metab. 2002;22:1303. doi: 10.1097/01.WCB.0000040943.89393.c1. [DOI] [PubMed] [Google Scholar]
- 58.Menge T, Zhao Y, Zhao J, Wataha K, Gerber M, Zhang J, Letourneau P, Redell J, Shen L, Wang J, Peng Z, Xue H, Kozar R, Cox CS, Jr, Khakoo AY, Holcomb JB, Dash PK, Pati S. Sci Transl Med. 2012;4:161ra150. doi: 10.1126/scitranslmed.3004660. [DOI] [PMC free article] [PubMed] [Google Scholar]
- 59.Li Q, Tang G, Xue S, He X, Miao P, Li Y, Wang J, Xiong L, Wang Y, Zhang C, Yang GY. Biomaterials. 2013;34:4982. doi: 10.1016/j.biomaterials.2013.03.030. [DOI] [PubMed] [Google Scholar]
- 60.Belov VV, Bonab AA, Fischman AJ, Heartlein M, Calias P, Papisov MI. Mol Pharmaceutics. 2011;8:736. doi: 10.1021/mp100358f. [DOI] [PubMed] [Google Scholar]
- 61.Tang Y, Cai B, Yuan F, He X, Lin X, Wang J, Wang Y, Yang GY. Cell Transplant. 2013 doi: 10.3727/096368913x667510. [DOI] [PubMed] [Google Scholar]
- 62.Kostura L, Kraitchman DL, Mackay AM, Pittenger MF, Bulte JW. NMR Biomed. 2004;17:513. doi: 10.1002/nbm.925. [DOI] [PubMed] [Google Scholar]
- 63.Hsiao J-K, Tsai C-P, Chung T-H, Hung Y, Yao M, Liu H-M, Mou C-Y, Yang C-S, Chen Y-C, Huang D-M. Small. 2008;4:1445. doi: 10.1002/smll.200701316. [DOI] [PubMed] [Google Scholar]
- 64.Delcroix GJ, Jacquart M, Lemaire L, Sindji L, Franconi F, Le Jeune JJ, Montero-Menei CN. Brain Res. 2009;1255:18. doi: 10.1016/j.brainres.2008.12.013. [DOI] [PubMed] [Google Scholar]
- 65.Yang GY, Betz AL. Stroke. 1994;25:1658. doi: 10.1161/01.str.25.8.1658. [DOI] [PubMed] [Google Scholar]
- 66.Borlongan CV, Randall TS, Cahill DW, Sanberg PR. Brain Res. 1995;676:231. doi: 10.1016/0006-8993(95)00150-o. [DOI] [PubMed] [Google Scholar]
- 67.Huang J, Li Y, Tang Y, Tang G, Yang GY, Wang Y. Stroke. 2013;44:190. doi: 10.1161/STROKEAHA.112.670299. [DOI] [PubMed] [Google Scholar]
Associated Data
This section collects any data citations, data availability statements, or supplementary materials included in this article.