

Abstract
We tested a series of amidine and related compounds against Trypanosoma brucei. The most active compound was a biphenyldiamidine which had an EC50 of 7.7 nM against bloodstream form parasites. There was little toxicity against two human cell lines with CC50 > 100 μM. There was also good in vivo activity in a mouse model of infection with 100% survival at 3 mg/kg i.p. The most potent lead blocked replication of kinetoplast DNA (k-DNA), but not nuclear DNA, in the parasite. Some compounds also inhibited the enzyme farnesyl diphosphate synthase (FPPS) and some were uncouplers of oxidative phosphorylation. We developed a computational model for T. brucei cell growth inhibition (R2 = 0.76) using DNA ΔTm values for inhibitor binding, combined with T. brucei FPPS IC50 values. Overall, the results suggest that it may be possible to develop multi-target drug leads against T. brucei that act by inhibiting both k-DNA replication and isoprenoid biosynthesis.
Keywords: Sleeping sickness, Kinetoplast DNA, Farnesyl diphosphate synthase, Proton motive force, Computational modeling
Introduction
Diseases caused by trypanosomatid parasites afflict millions of individuals worldwide and are the causative agents of sleeping sickness in Africa, of Chagas disease in Latin America, and of the leishmaniases in India, the Middle East as well as in Latin America.1 Many of the drugs used to treat these diseases are quite toxic (arsenicals, antimonials and benznidazole), or they are very expensive or difficult to administer in the field. Plus, many of the drugs that are in use are becoming ineffective due to resistance. Moreover, since there are no vaccines available to prevent these diseases, there is a continuing need for new drugs and new drug leads.
In this work, we focus on sleeping sickness, also known as human African trypanosomiasis (HAT). The disease is transmitted by the bite of the tsetse fly and is fatal if not treated, and resistance to currently used therapeutics is occurring.2 There are two drugs used to treat the initial phase of the disease: suramin (1) and pentamidine (2), Figure 1, employed in the treatment of trypanosomiasis caused by T. brucei rhodesiense and T. brucei gambiense, respectively. Pentamidine therapy is rather toxic and the side effects can be fatal. For the treatment of the second or neurological phase, melarsoprol (3), an arsenical, is used for the treatment of both infections. However, this drug likewise causes severe side effects and is lethal in ~5-10% of patients. Both drugs are taken up into cells by the T. brucei adenosine and aquaglyceroporin-2 transporters and cross-resistance to both drugs is increasing.2 A newer drug, eflornithine (4), alone or in combination with nifurtimox (5), has recently been introduced but is effective only for the treatment of T. brucei gambiense infections. Other, less toxic, inexpensive drugs active against infections caused by both species are thus required. There are promising leads that are in clinical trials, such as fexinidazole3 and oxaboroles,4 but it is unfortunately true that most clinical trials fail, so there is almost always a need for new concepts, and new leads.
Figure 1.

Structures of some T. brucei cell growth inhibitors.
Another class of leads are the diamidines. These compounds (such as DB75 (6) and its prodrug DB289 (7)) have been developed from the diamidine pentamidine and are thought to bind to AT-rich DNA (primarily kinetoplast DNA, k-DNA), but may also have effects as uncouplers,5,6 compounds that collapse the proton motive force and thus ATP synthesis. In our group, we recently found that other diamidines, such as BPH-1358 (NSC50460, 8), had activity against two enzymes involved in isoprenoid biosynthesis, undecaprenyl diphosphate synthase (UPPS)7 and farnesyl diphosphate synthase (FPPS).8,9 There was potent (~100 nM) activity against Staphylococcus aureus UPPS7 as well as against S. aureus, both in vitro and in vivo in a mouse model of infection with 20/20 mice surviving when treated with 8,7 while none survived without treatment.7 In later work,10 we found that 8 also bound to an AT-rich DNA dodecamer duplex, increasing the unfolding transition (ΔTm) in a DSC (differential scanning calorimetry) experiment by ~11 °C. We found that we could quite accurately (R2 ~ 0.89) model S. aureus cell growth inhibition by using ΔTm and UPPS IC50 results together with one mathematical descriptor,10 implying multi-target inhibition. Here, we investigated the activity of each of the compounds reported earlier as S. aureus cell growth inhibitors for potential activity against T. brucei in vitro, the most promising compound being tested in vivo. We also tested all compounds for activity against T. brucei farnesyl diphosphate synthase (TbFPPS), since 8 has been reported to inhibit human FPPS,8 as well as for activity as uncouplers, since we have found that other lipophilic bases can act as potent uncouplers.11
Results and Discussion
T. brucei and human cell growth inhibition results
We first investigated the activity of the sixteen compounds whose structures are shown in Figure 2 for activity against T. brucei bloodstream form (BSF) parasites, as well as against two human cell lines: human embryonic kidney (HEK293T) and a human hepatocellular carcinoma (HepG2), as counter-screens for toxicity. The compounds were all from the batches whose synthesis and characterization were reported previously.10 Representative dose-response results are shown in Figure 3. All EC50 (T. brucei) and cytotoxicity (CC50; HEK293T, HepG2) values obtained are shown in Table 1. As can be seen in Table 1, there are 6 compounds (2, 8-11, 13) that have promising activity with EC50 values of < 100 nM against T. brucei cell growth. The most potent compound was 8 which had an EC50 of 7.7 nM, essentially the same as found with pentamidine (2; EC50 = 5 nM). Perhaps more interesting is the observation that the activity of 8 against both human cell lines is > 100 μM, while that of pentamidine was < 0.4 μM. This leads to a “selectivity index” (SI), defined as:
of > 13000 for 8, versus < 80 for pentamidine 2, suggesting that 8 might be active in vivo, and could have less toxicity than does pentamidine (2).
Figure 2.

Structures of 16 compounds investigated here as T. brucei cell growth inhibitors.
Figure 3.
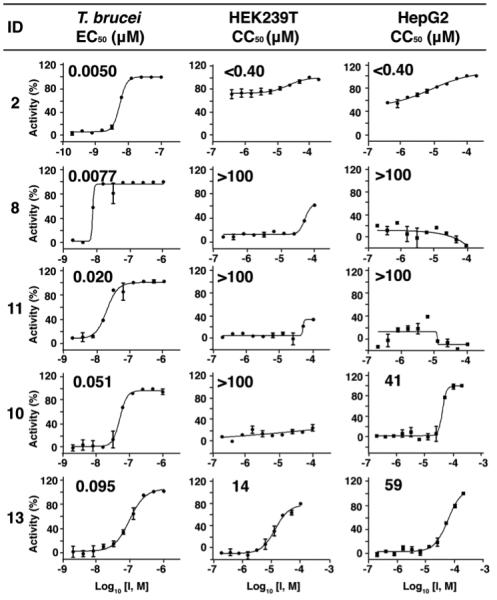
Representative dose-response results for some compounds of interest in T. brucei, HEK293T and HepG2 (human cell) growth inhibition, together with computed selectivity index (SI) values (SI = CC50 (human cell line)/EC50 T. brucei). Experiments were performed in duplicate.
Table 1.
Enzyme inhibition, cell growth inhibition, DSC and fluorescence results.
| ID |
aT. brucei
EC50 (μM) |
bHEK293T CC50 (μM) |
cHepG2 CC50 (μM) |
dSI HEK/Tb |
e
Hep/TbSI |
fΔTm
(°C) |
gFluor. A.U. |
hTbFPPS IC50 (μM) |
|---|---|---|---|---|---|---|---|---|
| 9 | 0.084 (0.069-0.1) |
> 200 | > 200 | > 2400 | > 2400 | 24 | 65 ± 5.0 | 3.5 ± 0.072 |
| 10 | 0.051 (0.041-0.063) |
> 100 | 41 (34-50) |
> 2000 | 810 | 20 | 12 ± 2.6 | 1.3 ± 0.017 |
| 11 | 0.020 (0.015-0.026) |
> 100 | > 100 | > 5000 | > 5000 | 16 | 25 ± 3.1 | 9.9 ± 0.50 |
| 12 | 2.1 (1.8-2.4) |
> 200 | > 200 | > 96 | > 96 | 16 | 13 ± 5.8 | 950 ± 230 |
| 8 | 0.0077 (0.0063-0.012) |
> 100 | > 100 | > 13000 | > 13000 | 11 | 81 ± 2.9 | 27 ± 0.25 |
| 13 | 0.095 (0.076-0.12) |
14 (10-18) |
59 (45-77) |
140 | 620 | 10 | 140 ± 16 | 310 ± 93 |
| 14 | 0.85 (0.77-0.93) |
27 (21-35) |
>100 | 32 | 118 | 7.1 | 110 ± 16 | 0.49 ± 0.0088 |
| 15 | > 50 | > 100 | > 100 | ~ 2 | ~ 2 | 5.8 | 19 ± 4.5 | 21 ± 0.61 |
| 16 | 1.9 (1.4-2.6) |
4.7 (4-5.5) |
6.4 (5.8-7.2) |
2.5 | 3.4 | 5.2 | 55 ± 2.5 | 18 ± 7.0 |
| 17 | 0.85 (0.62-1.2) |
> 20 | > 20 | > 24 | > 24 | 3.9 | 37 ± 4.4 | 240 ± 36 |
| 2 | 0.0055 (0.0052- 0.0057) |
< 0.4 | < 0.4 | < 80 | < 80 | 2.7 | 64 ± 11 | 370 ± 7.2 |
| 18 | 0.42 (0.16-1.0) |
14 (13-16) |
33 (15-73) |
35 | 80 | 0.7 | 18 ± 7.7 | 1800 ± 230 |
| 19 | 0.67 (0.55-0.81) |
2 (1.6-2.5) |
12 (9.5-15) |
3 | 18 | 0.6 | 30 ± 3.3 | 45 ± 11 |
| 20 | 0.7 (0.66-0.74) |
13 (12-15) |
6.1 (5-8.7) |
19 | 8.7 | 0.1 | 19 ± 8.3 | 4.4 ± 0.49 |
| 21 | > 50 | > 100 | > 100 | ~ 2 | ~ 2 | −1.0 | 7.1 ± 2.4 | 6.6 ± 2.8 |
| 22 | 23 (5.3-97) |
> 100 | > 100 | > 4.4 | > 4.4 | −1.2 | 12 ± 2.6 | 1.9 ± 0.47 |
T. brucei EC50 were determined from duplicate measurements by nonlinear regression analysis using GraphPad Prism 6. Values in parentheses are 95% confidence intervals.
HEK293T CC50 were determined from duplicate measurements. Values in parentheses are 95% confidence intervals.
HepG2 CC50 were determined from duplicate measurements. Values in parentheses are 95% confidence intervals.
Selective index: CC50 (HEK293T)/EC50 (T. brucei).
Selective index: CC50 (HepG3)/EC50 (T. brucei).
Data from ref. 10.
Fluorescence intensity, arbitrary units. Larger values mean stronger uncoupling effects. Results shown are the average of triplicate experiments ± standard deviation.
T. brucei FPPS IC50. Data points are the average of duplicate experiment, ± standard deviation.
Mechanism of action of diamidines and related compounds
How 8 and the other compounds inhibit T. brucei cell growth is of interest since it might eventually lead to more potent and/or selective inhibitors, something that is needed in light of the setbacks found with 712 in clinical trials. All of the compounds described here that have significant activity against S. aureus bind to AT-rich DNA,10 and we previously found that there was a correlation between the number of inhibitor-DNA hydrogen bonds and DNA-binding activity (as determined by ΔTm, the shift in the maximum of the Cp-versus-T DSC thermogram upon inhibitor binding). Plus, in this earlier work10 we found that there was a correlation between ΔTm and S. aureus cell growth inhibition. Since binding of diamidines to AT-rich DNA has been implicated in the mechanism of action of other diamidine anti-bacterials13, as well as in the inhibition of T. brucei cell growth, we sought to see whether the same mechanism was involved with the compounds described here. As can be seen in Table 1, the four compounds (8-11) with the largest AT-rich DNA ΔTm values on ligand binding (ΔTm ≥ 10°C) are all potent T. brucei cell growth inhibitors with EC50 values ≤ 100 nM, suggesting a role of DNA binding in T. brucei cell growth inhibition. We thus next sought to see if 8 (the compound with the best T. brucei cell growth inhibition, and selectivity index) had any effects on nuclear DNA replication, kinetoplast DNA (k-DNA) replication, or both. k-DNA, located in the T. brucei mitochondrion, is an unique form of DNA found only in trypanosomatid parasites and is, therefore, a good drug target.
We found, using an EdU click chemistry reaction,14-16 that there was a complete block of T. brucei k-DNA replication with 8, as shown in Figure 4A. EdU is the thymidine-analog, 5-ethynyl-2′-deoxyuridine, which when detected using click chemistry with azide labeled Alexa•Fluor 488 leads to green fluorescence in replicating DNA/k-DNA. The bisamidine DAPI (4′,6-diamidino-2-phenylindole) when bound to DNA is a highly (blue) fluorescent compound, and is used to stain both nuclear and k-DNA. As can be seen in Figure 4A, in the presence of 8, k-DNA replication in T. brucei is completely blocked, just as seen with the control, ethidium bromide (bottom panel in Figure 4A). These results show that the bisamidine 8 inhibits k-DNA replication, presumably by binding to AT-rich motifs in k-DNA. The kinetoplast in T. brucei is, however, relatively small when compared to that found in another trypanosomatid parasite, Leishmania donovani, and as expected, the results of the DAPI (nuclear and k-DNA) staining and the EdU click-chemistry (replicating DNA) reactions are much more readily seen with L. donovani, as shown in Figure 4B where clearly, as expected, 8 blocks k-DNA replication. Nevertheless, in both T. brucei as well as in L. donovani, it appears that 8 inhibits k-DNA replication but has no obvious effect on nuclear DNA replication. These results are consistent with k-DNA replication being one target for 8 in T. brucei cell growth inhibition. The actual number of kinetoplasts in the visual field also decreases as a function of drug concentration and incubation time, as shown in Figure 4C for T. brucei, indicating kinetoplast disruption.
Figure 4.

Effects of 8 on nuclear and k-DNA replication for T. brucei (A, C) and L. donovani (B). Shown at the top in A, B are control (DMSO vehicle) results with DAPI and EdU. DAPI stains all DNA and the bound compound exhibits a blue fluorescence. EdU is used to detect replicating DNA and fluoresces green. In the DMSO controls, both nuclear (n) and k-DNA (k) replicate in both organisms (green). In the middle row panels in A, B, cells are treated with 8, which blocks k-DNA replication, so the (replicating) kinetoplast k-DNA signal is not observed (blue). The same k-DNA replication-inhibition result is found with the DNA intercalator ethidium bromide, shown in the bottom panels of the Figure. Scale bar, 2 μm. (C) Shows the number of kinetoplasts in the visual field as a function of 8 concentration (from 39 nM to 626 nM), and incubation time (48h or 72h). Values are means ± SD of duplicate experiments.
When we compared the ΔTm and T. brucei cell growth inhibition results (using pEC50 = −log10 EC50 values) there was only a poor correlation (R2 = 0.22, Figure 5A). One possibility for this is that there are only relatively few compounds (n = 16) that are being investigated. Another possibility is that since there is considerable chemical diversity amongst the 16 structures, good correlations would not be expected because transport would be very variable. To test this possibility, we added a mathematical descriptor (one of 308 we calculated using the MOE program17), finding that the correlation between predicted and experimental T. brucei cell growth inhibition values increased to R2 = 0.66 (p = 0.001), Figure 5B. The best mathematical descriptor, computed by using the MOE program17, was vsurf_EWmin1. This descriptor is the lowest hydrophilic energy (and depends on both structure connectivity and conformation), and gave R2 = 0.60, p = 0.0004. A third possibility is that multiple-targets are involved. This possibility is the one we reported10 for S. aureus cell growth inhibition in which both DNA-binding (major) and UPPS inhibition (minor) were implicated, but there is no UPPS in T. brucei. There is, however, another prenyl synthase that is a drug target in T. brucei,18 farnesyl diphosphate synthase, and in earlier work we found that FPPS could be inhibited by diamidines.8,9
Figure 5.

Plots between experimental T. brucei cell growth inhibition (pIC50 values) and experimental properties, and computed growth inhibition models. (A) ΔTm, R2=0.22, p=0.07. (B) ΔTm+vsurf_EWmin1, R2=0.66, p=0.001. (C) FPPS pIC50, R2=0.03, p=0.53. (D) FPPS pIC50+PEOE_VSA_FPPOS, R2=0.71, p=0.0003. (E) FPPS pIC50+ΔTm, R2=0.28, p=0.12. (F) FPPS pIC50+ΔTm+ PEOE_VSA_FPPOS, R2=0.76, p=0.0005.
We thus next screened all sixteen compounds against an expressed T. brucei FPPS. All enzyme inhibition IC50 values are shown in Table 1. The IC50 values vary considerably, from ~490 nM to ~2 mM. When the T. brucei cell growth inhibition (pEC50) results are compared with the T. brucei FPPS inhibition results there is essentially no correlation (Figure 5C), but the correlation improves to R2 = 0.71 with the addition of 1 computed descriptor (PEOE_VSA_FPPOS, the fractional positive polar van der Waals surface area, computed by using the MOE program17), Figure 5D. When we use both ΔTm and FPPS data to predict activity:
the correlation is again poor (R2 = 0.28; Figure 5E), but this improves to R2=0.76 (p = 0.0005) with the addition of 1 computed descriptor, as shown in Figure 5F. These results support the idea that both k-DNA binding as well as FPPS inhibition may contribute to T. brucei cell growth inhibition. To put these R2 values in perspective, in earlier work19 we compared 10 sets of enzyme inhibition/cell assay results for diverse systems (anti-bacterial, anti-protozoal, anti-cancer, anti-viral) finding that on average, the enzyme/cell pIC50/pEC50 correlations were remarkably poor, R2 ~0.30,19 even though in most cases highly homologous series of compounds were being investigated. The correlation greatly improved by adding mathematical descriptors (such as clogP) and, on average, the R2 values increased to R2 = 0.70 (with 2 added descriptors, and large data sets). The same general approach can be used with multiple experimental descriptors, and with S. aureus we found an R2 = 0.75 using ΔTm and UPPS inhibition data, which improved to R2 = 0.89 with 1 computed descriptor.10 It is possible that there are alternate targets whose inhibition is being reflected in the computational descriptors, although the use of the experimental ΔTm and TbFPPS pIC50 values together with just 1 computed descriptor does give a very good prediction of activity (R2 = 0.76, p = 0.0005). Interestingly, we also found that the IC50 of DB75 (6) against both human and T. brucei FPPS was ~50 μM. This seems a rather large value, but FPPS could be a target for this compound in T. brucei since it is likely to be taken up by transporters and could accumulate within the cells, contributing to the toxicity seen with the pro-drug DB289.20
In addition to k-DNA and FPPS as potential targets, there are of course other possibilities, suggested by the literature. Specifically, it has been found that pentamidine (2) is an uncoupler of oxidative phosphorylation in isolated rat liver mitochondria,21 and that the mitochondrion in T. brucei is the target of the trypanocidal action of the diamidine DB75.22 We thus next tested the most promising lead 8 for its ability to collapse the proton motive force (here, primarily the mitochondrial membrane potential, Δψm) in digitonin-permeabilized bloodstream form T. brucei (BSF) trypanosomes (Figure 6A) and procyclic form (PCF) trypanosomes (Figures 6 B-D) using the safranine method.23,24 We chose compound 8 since is had no effect on the growth of either of the two human cell lines (CC50 > 100 μM), in addition to being the most potent T. brucei cell growth inhibitor and as we show below, it is active in vivo.
Figure 6.

Effects of 8 on the mitochondrial membrane potential Δψm in digitonin-permeabilized T. brucei. (A) BSF trypanosomes (2×10⁸ cells) were added to buffer (2 mL) containing 20 μM EGTA, 1 mM ATP, 500 μM sodium orthovanadate and 5 μM safranine, and the reaction initiated with 40 μM digitonin. 8 and FCCP were added where indicated. Grey line is baseline. (B) PCF trypanosomes (5×10⁷ cells) were added to buffer (2.4 mL) containing 2 mM succinate and 5 μM safranine, and the reaction initiated with or without (grey trace) 50 μM digitonin. 8 (5 μM) and FCCP (8 μM) were added where indicated. (C) As (B) but ADP (10 μM), oligomycin (Oligo, 2 μg/ml), CaCl2 (12 μM), EGTA (200 μM), 8 (10 μM), and FCCP (8 μM) were added where indicated. (D) As (B) but CaCl2 (12 μM), EGTA (200 μM), various concentrations (0-30 μM) of 8 and FCCP (8 μM) were added where indicated.
Figure 6A shows that addition of 10 μM 8 decreased Δψm, which was further reduced by addition of 8 μM FCCP (carbonyl cyanide 4-(trifluoromethoxy)phenylhydrazone, 2 μg/mL), a potent protonophore uncoupler. Similar results were obtained with PCF, Figure 6B. T. brucei PCF mitochondria were able to phosphorylate ADP, as demonstrated by the small decrease in Δψm after its addition, Figure 6C. This activity was inhibited by the ATP synthase inhibitor oligomycin. In addition, the mitochondria were able to transport Ca2+, as shown by the decrease in the Δψm after addition of CaCl2, and the Δψm returned to basal levels after addition of the Ca2+-chelator EGTA, Figure 6C. Further addition of 8 followed by FCCP again collapsed Δψm, Figure 6C. 8 collapsed Δψm in a dose-dependent manner (Figure 6D) and 8 alone had no effect (Figure 6B). Figure S1A and S1B show the results of 3 independent experiments. These results show that mitochondria in permeabilized T. brucei are able to develop a Δψm, phosphorylate ATP and transport Ca2+ and that 8 collapses Δψm. These effects on the proton motive force are rapid and are very similar to those observed for SQ109 in bacterial systems11 and are likely to make a contribution to 8 inhibiting cell growth.
These observations then raise the question: do some of the other compounds affect the PMF? We thus next measured the collapse in Δψm for all compounds, but this time at just a single (5 μM) inhibitor concentration. Results are shown in Figure 7. As a control, we used FCCP. The three most potent uncouplers (from Figure 2) were all biphenyls: 13, 14 and 8, Figure 7, with the 6-membered amidine 13 being the most effective species, albeit less so than was FCCP, 140 versus 230 (arbitrary) fluorescence units. The 6-membered ring species 13 was more effective than was 8, which has 5-membered amidine rings. The next most active species were pentamidine and 9. However, we did not obtain an improved growth inhibition models using the uncoupling results, although they may be important for individual compounds.
Figure 7.

Effects of compounds on the mitochondrial membrane potential (Δψm) in digitonin permeabilized T. brucei PCF trypanosomes. PCF trypanosomes (5×10⁷ cells) were added to reaction buffer (1.95 mL) with additions as described in Figure 6 (B). The chart shows changes in safranine fluorescence (AU = arbitrary units) after addition of each compound (5 μM) or FCCP (5 μM). The results are means ± SD of three independent experiments.
In addition to the effects on Δψm, we find that there are deranged mitochondrial morphologies exhibited by T. brucei BSF on treatment with 8. Figure 8 shows DMSO control cells and cells treated with 500 nM 8 for 24 hrs. DAPI (blue fluorescence) stains the nuclear and k-DNA while MitoTracker® Red (red fluorescence) is used to visualize the mitochondria, and its uptake depends on Δψm. As can be seen in Figure 8, k-DNA is localized to the mitochondrion, however, the mitochondrial morphology is disrupted by 8, changing from a normal tubular shaped organelle to a more condensed form, particularly towards the location near the k-DNA.
Figure 8.

Effects of 8 (156 and 625 nM, 24 hrs and 48hrs) on T. brucei cells. DAPI fluoresces blue and stains DNA; Mitotracker Red fluoresces red and is used to locate the mitochondrion (Scale bar, 5 μm).
These uncoupling effects are clearly interesting, but they could lead to toxicity-as might human FPPS inhibition. However, in other work11 we reported that the tuberculosis drug lead SQ109 acted at least in part as an uncoupler, and this work has now been extended 25 to numerous other TB drug leads including adamantyl ureas, indolecarboxamides, tetrahydropyrazolopyrimidines, and the 1,5-diarylpyrrole BM212,25 all of which are now thought to function primarily as uncouplers. Moreover, drugs such as niclosamide function in the same way26 and are of interest as diabetes drug leads.27,28 We thus next sought to see if 8 had any efficacy in vivo, and/or if it was highly toxic.
In vivo activity in a mouse model of infection
Compound 8 has the best computed SI in both cell lines and also has essentially the same activity as pentamidine (2), so was chosen for further investigation. We used the T. brucei brucei Lister 427 mouse model of infection in which all mice die ~6 days after infection, in the absence of any treatment. In an initial set of experiments, mice were treated with 8 at 10 or 3 mg/kg i.p. for 4 days. Figure 9A shows survival as a function of time, again with PBS, pentamidine and compound 8 treated mice. All 8 treated mice survive in this infection model at both 3 and 10 mg/kg after the 4-day treatment (and over the 25 day observational period), and there was no parasitemia observed in the 2 (pentamidine) or 8 treated mice, Figure 9B. We then carried out a second series of experiments, this time at 1 and 0.3 mg/kg i.p. for 4 days. Survival and parasitemia results are shown in Figures 9C, D and indicate (when compared with the results in Figures 9A, B) that the lowest effective dose is ~3 mg/kg. There is no weight loss during mice treatment.
Figure 9.

In vivo results for T. brucei brucei Lister 427 mouse model of infection. (A), Mouse survival after treatment at 3 and 10 mg/kg i.p. for 4 days. (B), Parasitemia as a function of time after treatment. (C-D) Same as (A-B) but at 0.3 and 1 mg/kg i.p. for 4 days.
Conclusions
The results presented here suggest that it may be possible to develop new multi-target inhibitors of T. brucei cell growth that target both parasite-specific kinetoplast DNA (k-DNA) as well as isoprenoid biosynthesis (FPPS) with such “multi-target” inhibition being of general interest since it could lead to more effective and more “resistance-resistant” drugs.29 Of particular interest is the observation that the lead 8 inhibits k-DNA replication, but not nuclear DNA replication. Some of the diamidine analogs also inhibited the isoprenoid biosynthesis enzyme, farnesyl diphosphate synthase. This is of interest since FPPS is an essential protein for T. brucei cell growth.18 Plus, other compounds acted as uncouplers, of interest since other new drug leads against bacteria have been reported to act in this way. In a mouse model of infection, all mice survived upon treatment with 8 and a similar result (with 8) has been reported with S. aureus infection in which both DNA and another isoprenoid biosynthesis enzyme, UPPS, were targeted.7,10 8 also acts as an uncoupler in both bloodstream and procyclic form parasites, rapidly collapsing the mitochondrial membrane potential, Δψm. However, while 8 was a potent inhibitor of T. brucei cell growth, it was a poor inhibitor of the growth of two human cell lines and did not appear toxic in mice. The basic observation that k-DNA, FPPS as well as the proton motive force can be targeted is thus of general interest in the context of developing new anti-parasitic drug leads for treating infections caused by trypanosomatid parasites.
Experimental section
Ethics Statement
All animal care and therapy studies were carried out in strict accordance with the guidelines and principles established by the Korean Animal Protection Law (http://animalrightskorea.org). Animal use protocol # IPK-13009-1 was reviewed and approved by the Institutional Animal Care and Use Committee (IACUC) of the Institut Pasteur Korea.
Inhibitors
Inhibitors were from the batches whose synthesis (or availability) as well as characterization were described previously.10 All compounds were ≥ 95% pure as determined by elemental analysis or analytical HPLC/MS analysis and were also characterized by 1H NMR and HRMS.
Parasites and Cell Culture
Trypanosoma brucei brucei Lister 427 (bloodstream form) was cultivated at 37 °C with a 5% CO2 atmosphere in HMI-9 medium supplemented with 10% fetal bovine serum (FBS). T. brucei was subcultured every 3 or 4 d and maintained until the twentieth passage. The HEK239T and HepG2 cell lines used in the cytotoxicity testing were cultivated at 37 °C in a 5% CO2 atmosphere in Dulbecco's modified Eagle's medium supplemented with 10% FBS.
T. brucei Growth Inhibition
T. brucei cell growth inhibition was assayed by measuring the conversion of resazurin to resorufin. Assays were performed in duplicate in 384 well plates which were seeded with T. brucei (2.5 × 10³ cells per well). After seeding the parasites, they were exposed to the compounds for 3 d. Resazurin sodium salt (120 μM; R7017; Sigma-Aldrich, St. Louis, MO, USA) was then added and plates incubated for 5h. After incubation, the parasites were fixed with 4% paraformaldehyde and the plates analyzed in a Victor 3™ plate reader (PerkinElmer, Inc., Waltham, MA, USA) at 590 nm (emission) and 530 nm (excitation). Pentamidine was used as a reference drug in the T. brucei inhibition assay. The EC100 of pentamidine was taken as the concentration that produced 100% growth inhibition.
Cytotoxicity Assay
A resazurin cytotoxicity assay was performed in duplicate with HEK239T and HepG2 cell lines. Cells (4.0 × 10³ cells per well) were seeded in 384 well plates and incubated for 72 h with selected compounds. Cells were then exposed to 40 μM resazurin for 5 h to allow for conversion to resorufin by aerobic respiration. After incubation, cells were fixed with 4% paraformaldehyde and the plates read with a Victor 3™ plate reader (PerkinElmer, Inc., Waltham, MA, USA) at 530 nm (excitation) and 590 nm (emission). Chlorpromazine was used as a reference drug in the cytotoxicity assay. The EC100 of chlorpromazine was taken as the concentration that produced 100% growth inhibition.
Protein Expression and Purification
TbFPPS was cloned and expressed as reported previously.30 Briefly, DNA coding for TbFPPS was cloned into the pET-28a vector (Novagen, Madison, WI, USA). The recombinant plasmid was transformed into an Escherichia coli BL21 (DE3) host to be expressed. Bacterial clones were grown in LB medium to an O.D. 600 of 0.8, and were induced with 1 mM isopropyl β-d-1-thiogalactopyranoside (IPTG) at 37 °C. After induction for 5 h, cells were re-suspended in binding buffer (500 mM NaCl, 20 mM Na2HPO4, pH 7.4) and incubated with 10 mg/mL lysozyme, 10 μg/mL protease inhibitor, and 1 μL/mL benzonase nuclease (Novagen) for 15 min, on ice. The supernatant was obtained by centrifugation at 15000 g for 1 h, at 4 °C. Lysates were applied to a nickel-chelated agarose affinity column and washed with binding buffer. Protein was eluted from the column using binding buffer containing 500 mM imidazole. The eluted fraction was desalted with a PD-10 desalting column (GE Life Sciences, Pittsburgh, PA, USA) and stored in 10 mM HEPES buffer (pH 7.4) containing 10 mM 2-mercaptoethanol.
In vitro Enzyme Assay
TbFPPS inhibition assays were carried out as described previously.30 Briefly, the condensation of geranyl diphosphate (GPP) with isopentenyl diphosphate (IPP) catalyzed by FPPS was monitored by using a coupled colorimetric assay31 in 96-well plates with 200-μL reaction mixtures containing 400 μM methylthioadenosine (MESG), 100 μM IPP and 100 μM GPP in 25 mM Tris-HCl (pH 7.4), 1 mM MgCl2 and 0.01% Triton X-100. The highest concentration of the inhibitors in the assay was 316 μM.
Visualization of DNA Replication
After the treatment with inhibitors for 72 h, T. brucei BSF trypanosomes were incubated for 16 h with the thymidine analogue EdU (5-ethynyl-2'-deoxyuridine). EdU-labeled parasites were then washed with 1× PBS and fixed in 100% cold ethanol, and completely dried. Fixed parasites were washed with 1× PBS and incubated with Alexa Fluor® 488 Azide (Invitrogen, Grand Island, NY, USA) under Cu(I)-catalyzed click reaction conditions (100 μM of ascorbic acid and 1 μM of CuSO4). EdU-labeled parasites were counterstained with 10 μg/ml DAPI before mounting in VECTASHIELD® mounting medium (Vector Laboratories, Burlingame, CA, USA). The images were analyzed using a Nikon Eclipse 90i fluorescence microscope (Nikon, Tokyo, Japan) and captured with a digital camera (DS-1QM, Nikon).
Visualization of Mitochondrial Membrane Potential
After the compound treatment for 24 h and 48 h, then parasites were incubated with 200 nM of Mitotracker® Red CMXRos (Invitrogen) for additional 30 min. BSF trypanosomes were washed in cold PBS and fixed with 3% PFA in PBS at 4 °C for 1 h. Fixed parasites were washed with PBS, and stained with 10 μg/ml of DAPI before mounting in VECTASHIELD® mounting medium (Vector Laboratories, Burlingame, CA, USA). Images were analyzed with a Nikon Eclipse 90i fluorescence microscope (Nikon, Tokyo, Japan) and captured with a digital camera (DS-1QM, Nikon).
In vivo Experiments
BALB/C mice were infected with T. brucei brucei Lister 427 (3 × 10⁴ cells) by i.p. injection. Mice were divided into groups (n = 5), and drug treatment carried out for 4 consecutive days by administering 10, 3, 1 or 0.3 mg/kg of compound 8 i.p. Parasitemia and survival were evaluated daily for 25 days. Mice showing impaired health status and/or with a parasite load > 108 cells per ml of blood were euthanized.
Analysis of Mitochondrial Membrane Potential
The mitochondrial membrane potential in situ was analyzed spectrofluorometrically by using safranine as the probe.23,24 T. brucei PCF and BSF trypanosomes were incubated at 28 °C in reaction buffer (125 mM sucrose, 65 mM KCl, 10 mM HEPES–KOH buffer, pH 7.2, 1 mM MgCl2, 2.5 mM potassium phosphate) with additions as described in the Figure legends. Fluorescence changes were monitored on a Hitachi 4500 spectrofluorometer (excitation wavelength = 496 nm; emission wavelength = 586 nm).
Computational Aspects
All mathematical modeling was performed in R (http://www.R-project.org). Descriptors were calculated by using MOE.17
Statistical Analyses
All IC50/EC50 values were measured in duplicate. Dose-response curves were fitted by using a sigmoidal dose-response equation with a variable slope using GraphPad Prism 6 Software (GraphPad Software, San Diego, CA, USA).
Supplementary Material
ACKNOWLEDGMENT
This work was supported by the United States Public Health Service (National Institutes of Health grants GM065307, CA158191 and AI104120); a Harriet A. Harlin Professorship; the University of Illinois/Oldfield Research Fund; the National Research Foundation of Korea (NRF-2014K1A4A7A01074645), a grant funded by the Korean government (MSIP), Gyeonggi-do and KISTI.
ABBREVIATIONS
- FPPS
farnesyl diphosphate synthase
- UPPS
undecaprenyl diphosphate synthase
- BSF
bloodstream form
- PCF
procyclic form
- HEK
human embryonic kidney
- human Hep
hepatocellular carcinoma
- Tb
Trypanosoma brucei
- SI
selectivity index
- IC50
half maximal inhibitory concentration
- EC50
half maximal effective concentration
- CC50
half maximal cytotoxicity concentration
- FCCP
carbonyl cyanide 4-(trifluoromethoxy)phenylhydrazone
- MESG
7-methyl-6-thioguanosine
- GPP
geranyl diphosphate
- IPP
isopentenyl diphosphate
- FPP
farnesyl diphosphate
Footnotes
Author Contributions
G.Y., W.Z., R.D., E.O. and J.H.N. designed research; Y.W and K.L. synthesized compounds; G.Y., S.B., and G.C. performed cell growth inhibition assays and in vivo experiments; W.Z. and Z.H. performed enzyme inhibition assays; W.Z. performed DSC experiments and computational modeling; G.H. and S.B. performed membrane potential measurements; G.Y., W.Z., R.D., E.O. and J.H.N. analyzed data. E.O. and W.Z. wrote the paper.
Notes
The authors declare no competing financial interest.
Supporting Information
Supporting Information Available: additional Figure illustrating uncoupling effect of 8. This material is available free of charge via the Internet at http://pubs.acs.org.
REFERENCES
- (1).About Parasites. Centers for Disease Control and Prevention; Atlanta, GA: 2014. http://www.cdc.gov/parasites/about.html. [Google Scholar]
- (2).Baker N, de Koning HP, Maser P, Horn D. Drug resistance in African trypanosomiasis: the melarsoprol and pentamidine story. Trends Parasitol. 2013;29:110–118. doi: 10.1016/j.pt.2012.12.005. [DOI] [PMC free article] [PubMed] [Google Scholar]
- (3).Torreele E, Bourdin Trunz B, Tweats D, Kaiser M, Brun R, Mazue G, Bray MA, Pecoul B. Fexinidazole--a new oral nitroimidazole drug candidate entering clinical development for the treatment of sleeping sickness. PLoS Negl Trop Dis. 2010;4:e923. doi: 10.1371/journal.pntd.0000923. [DOI] [PMC free article] [PubMed] [Google Scholar]
- (4).Nare B, Wring S, Bacchi C, Beaudet B, Bowling T, Brun R, Chen D, Ding C, Freund Y, Gaukel E, Hussain A, Jarnagin K, Jenks M, Kaiser M, Mercer L, Mejia E, Noe A, Orr M, Parham R, Plattner J, Randolph R, Rattendi D, Rewerts C, Sligar J, Yarlett N, Don R, Jacobs R. Discovery of novel orally bioavailable oxaborole 6-carboxamides that demonstrate cure in a murine model of late-stage central nervous system African trypanosomiasis. Antimicrob Agents Chemother. 2010;54:4379–4388. doi: 10.1128/AAC.00498-10. [DOI] [PMC free article] [PubMed] [Google Scholar]
- (5).Mathis AM, Holman JL, Sturk LM, Ismail MA, Boykin DW, Tidwell RR, Hall JE. Accumulation and intracellular distribution of antitrypanosomal diamidine compounds DB75 and DB820 in African trypanosomes. Antimicrob Agents Chemother. 2006;50:2185–2191. doi: 10.1128/AAC.00192-06. [DOI] [PMC free article] [PubMed] [Google Scholar]
- (6).Lanteri CA, Trumpower BL, Tidwell RR, Meshnick SR. DB75, a novel trypanocidal agent, disrupts mitochondrial function in Saccharomyces cerevisiae. Antimicrob Agents Chemother. 2004;48:3968–3974. doi: 10.1128/AAC.48.10.3968-3974.2004. [DOI] [PMC free article] [PubMed] [Google Scholar]
- (7).Zhu W, Zhang Y, Sinko W, Hensler ME, Olson J, Molohon KJ, Lindert S, Cao R, Li K, Wang K, Wang Y, Liu YL, Sankovsky A, de Oliveira CA, Mitchell DA, Nizet V, McCammon JA, Oldfield E. Antibacterial drug leads targeting isoprenoid biosynthesis. Proc Natl Acad Sci U S A. 2013;110:123–128. doi: 10.1073/pnas.1219899110. [DOI] [PMC free article] [PubMed] [Google Scholar]
- (8).Lindert S, Zhu W, Liu YL, Pang R, Oldfield E, McCammon JA. Farnesyl diphosphate synthase inhibitors from in silico screening. Chem Bio & Drug Des. 2013;81:742–748. doi: 10.1111/cbdd.12121. [DOI] [PMC free article] [PubMed] [Google Scholar]
- (9).Liu YL, Cao R, Wang Y, Oldfield E. Farnesyl diphosphate synthase inhibitors with unique ligand-binding geometries. ACS Med Chem Lett. 2015 doi: 10.1021/ml500528x. DOI: 10.1021/ml500528x. [DOI] [PMC free article] [PubMed] [Google Scholar]
- (10).Zhu W, Wang Y, Li K, Gao J, Huang CH, Chen CC, Ko TP, Zhang Y, Guo RT, Oldfield E. Antibacterial drug leads: DNA and enzyme multitargeting. J Med Chem. 2015 doi: 10.1021/jm501449u. DOI: 10.1021/jm501449u. [DOI] [PMC free article] [PubMed] [Google Scholar]
- (11).Li K, Schurig-Briccio LA, Feng XX, Upadhyay A, Pujari V, Lechartier B, Fontes FL, Yang HL, Rao GD, Zhu W, Gulati A, No JH, Cintra G, Bogue S, Liu YL, Molohon K, Orlean P, Mitchell DA, Freitas-Junior L, Ren FF, Sun H, Jiang T, Li YJ, Guo RT, Cole ST, Gennis RB, Crick DC, Oldfield E. Multitarget drug discovery for tuberculosis and other infectious diseases. J Med Chem. 2014;57:3126–3139. doi: 10.1021/jm500131s. [DOI] [PMC free article] [PubMed] [Google Scholar]
- (12).Jacobs RT, Nare B, Phillips MA. State of the art in African trypanosome drug discovery. Curr Top Med Chem. 2011;11:1255–1274. doi: 10.2174/156802611795429167. [DOI] [PMC free article] [PubMed] [Google Scholar]
- (13).Opperman TJ, Aiello D, Williams JD, Peet NP, Moir DT, Bowlin TL. The mechanism of antibacterial action of novel bis-indole antibiotics; 50th Interscience Conference on Antimicrobial Agents and Chemotherapy; Boston. 2010. C. H. [DOI] [PMC free article] [PubMed] [Google Scholar]
- (14).Salic A, Mitchison TJ. A chemical method for fast and sensitive detection of DNA synthesis in vivo. Proc Natl Acad Sci U S A. 2008;105:2415–2420. doi: 10.1073/pnas.0712168105. [DOI] [PMC free article] [PubMed] [Google Scholar]
- (15).Zeng C, Pan F, Jones LA, Lim MM, Griffin EA, Sheline YI, Mintun MA, Holtzman DM, Mach RH. Evaluation of 5-ethynyl-2'-deoxyuridine staining as a sensitive and reliable method for studying cell proliferation in the adult nervous system. Brain Res. 2010;1319:21–32. doi: 10.1016/j.brainres.2009.12.092. [DOI] [PMC free article] [PubMed] [Google Scholar]
- (16).da Silva MS, Monteiro JP, Nunes VS, Vasconcelos EJ, Perez AM, Freitas-Junior Lde H, Elias MC, Cano MI. Leishmania amazonensis promastigotes present two distinct modes of nucleus and kinetoplast segregation during cell cycle. PloS One. 2013;8:e81397. doi: 10.1371/journal.pone.0081397. [DOI] [PMC free article] [PubMed] [Google Scholar]
- (17).Molecular Operating Environment (MOE), 2013.08. Chemical Computing Group Inc.; Montreal, QC, Canada: 2014. 1010 Sherbooke St. West, Suite #910. H3A 2R7. [Google Scholar]
- (18).Montalvetti A, Fernandez A, Sanders JM, Ghosh S, Van Brussel E, Oldfield E, Docampo R. Farnesyl pyrophosphate synthase is an essential enzyme in Trypanosoma brucei - In vitro RNA interference and in vivo inhibition studies. J Biol Chem. 2003;278:17075–17083. doi: 10.1074/jbc.M210467200. [DOI] [PubMed] [Google Scholar]
- (19).Mukkamala D, No JH, Cass LM, Chang TK, Oldfield E. Bisphosphonate inhibition of a Plasmodium farnesyl diphosphate synthase and a general method for predicting cell-based activity from enzyme data. J Med Chem. 2008;51:7827–7833. doi: 10.1021/jm8009074. [DOI] [PMC free article] [PubMed] [Google Scholar]
- (20).Harrill AH, DeSmet KD, Wolf KK, Bridges AS, Eaddy JS, Kurtz CL, Hall JE, Paine MF, Tidwell RR, Watkins PB. A mouse diversity panel approach reveals the potential for clinical kidney injury due to DB289 not predicted by classical rodent models. Toxicol Sci. 2012;130:416–426. doi: 10.1093/toxsci/kfs238. [DOI] [PMC free article] [PubMed] [Google Scholar]
- (21).Moreno SNJ. Pentamidine is an uncoupler of oxidative phosphorylation in rat liver mitochondria. Arch Biochem Biophys. 1996;326:15–20. doi: 10.1006/abbi.1996.0041. [DOI] [PubMed] [Google Scholar]
- (22).Lanteri CA, Tidwell RR, Meshnick SR. The mitochondrion is a site of trypanocidal action of the aromatic diamidine DB75 in bloodstream forms of Trypanosoma brucei. Antimicrob Agents Ch. 2008;52:875–882. doi: 10.1128/AAC.00642-07. [DOI] [PMC free article] [PubMed] [Google Scholar]
- (23).Vercesi AE, Bernardes CF, Hoffmann ME, Gadelha FR, Docampo R. Digitonin permeabilization does not affect mitochondrial-function and allows the determination of the mitochondrial-membrane potential of Trypanosoma cruzi in situ. J Biol Chem. 1991;266:14431–14434. [PubMed] [Google Scholar]
- (24).Huang G, Vercesi AE, Docampo R. Essential regulation of cell bioenergetics in Trypanosoma brucei by the mitochondrial calcium uniporter. Nat Comm. 2013;4:2865. doi: 10.1038/ncomms3865. [DOI] [PMC free article] [PubMed] [Google Scholar]
- (25).Li K, Wang Y, Yang G, Byun SY, Rao G, Shoen C, Yang H, Gulati A, Crick DC, Cynamon M, Huang G, Docampo R, No JH, Oldfield E. Oxa-, thia-, heterocycle and carborane analogs of SQ109: bacterial and protozoal cell growth inhibitors. ACS Infect Dis. 2015 doi: 10.1021/acsinfecdis.5b00026. DOI: 10.1021/acsinfecdis.5b00026. [DOI] [PMC free article] [PubMed] [Google Scholar]
- (26).Weinbach EC, Garbus J. Mechanism of action of reagents that uncouple oxidative phosphorylation. Nature. 1969;221:1016–1018. doi: 10.1038/2211016a0. [DOI] [PubMed] [Google Scholar]
- (27).Tao H, Zhang Y, Zeng X, Shulman GI, Jin S. Niclosamide ethanolamine-induced mild mitochondrial uncoupling improves diabetic symptoms in mice. Nat Med. 2014;20:1263–1269. doi: 10.1038/nm.3699. [DOI] [PMC free article] [PubMed] [Google Scholar]
- (28).Crunkhorn S. Metabolic disease: Mitochondrial uncoupler reverses diabetes. Nat Rev Drug Discov. 2014;13:885. doi: 10.1038/nrd4491. [DOI] [PubMed] [Google Scholar]
- (29).Oldfield E, Feng X. Resistance-resistant antibiotics. Trends Pharmacol Sci. 2014;35:664–674. doi: 10.1016/j.tips.2014.10.007. [DOI] [PMC free article] [PubMed] [Google Scholar]
- (30).Liu YL, Lindert S, Zhu W, Wang K, McCammon JA, Oldfield E. Taxodione and arenarone inhibit farnesyl diphosphate synthase by binding to the isopentenyl diphosphate site. Proc Natl Acad Sci U S A. 2014;111:E2530–E2539. doi: 10.1073/pnas.1409061111. [DOI] [PMC free article] [PubMed] [Google Scholar]
- (31).Webb MR. A continuous spectrophotometric assay for inorganic phosphate and for measuring phosphate release kinetics in biological systems. Proc Natl Acad Sci U S A. 1992;89:4884–4887. doi: 10.1073/pnas.89.11.4884. [DOI] [PMC free article] [PubMed] [Google Scholar]
Associated Data
This section collects any data citations, data availability statements, or supplementary materials included in this article.