

To start, it is appropriate to reflect on the wonderful venue and the hospitality of our hosts for the SIMS XVIII conference here in Riva del Garda. The scenery has been spectacular, the food and wine of culinary delight, and the science inspirational indeed. All the attendees owe a warm thanks to the terrific job of the local organizing committees in providing a great treat for everyone. There can be no better occasion than to celebrate the 101st anniversary (1) of the discovery of secondary ion mass spectrometry with this group.
The subject of this paper is molecular depth profiling. It is a fascinating topic for our lab since it is a subject that is quite new in the scheme of the 100 year history of SIMS. As is well known, atomic bombardment of molecular solids rapidly leads to chemical damage with the concomitant loss of chemical information as the fluence exceeds the static limit. With cluster bombardment, however, this damage is mitigated in some cases, and even eliminated completely in others, allowing erosion of the material without loss of chemical information. In this lecture, some of the critical issues will be reviewed, along with a discussion of various protocols that are becoming available to characterize the effectiveness of a depth profile. The goal will be to decide what makes it, what breaks it, and what fixes it.
There are many valuable resources available to supplement this discussion, in addition to these proceedings. Of particular note is the SIMS society website, www.simssociety.org, which is being developed by the community for use by the community. The site has links to other SIMS activities, job opportunities and PowerPoint presentations from a number of review-type lectures, including this one. The SIMS International Committee encourages contributions to this site, which can be arranged through any committee member.
It is fortunate that many of the issues associated with molecular depth profiling have already been addressed quite rigorously by the dynamic SIMS community over the last 30 years or so. These experiments have been focused on determining elemental dopant distributions very near the surface of semiconductors such as Si, and on characterizing structures ranging from epitaxial layers to quantum wells. Extending these approaches to molecular depth profiling opens more opportunities for applications of SIMS since the study of buried interfaces in molecular solids with nanometer depth resolution is virtually impossible with other techniques. Key applications so far appear most promising in organic electronics through the study of organic light emitting diodes (OLED's), optoelectronic materials (2), photovoltaics and multilayer polymer structures with a number of examples found in these proceedings. There are also opportunities in the pharmaceutical industry, where formulation of drugs into complex layered structures is now standard practice.
Beyond these applications, there are also important implications for chemical imaging. In a 1 μm2 pixel, there are ~106 molecules per pixel, depending upon molecule size, of course. For static SIMS, the damage threshold is ~1%, the instrument transmission is ~10%, and the ionization efficiency for typical organic molecules is ~0.01%. Hence, the maximum signal in imaging mode is on the order of 0.1 counts per pixel, not too impressive. If the static limit no longer applies, and the pixel can be integrated to a voxel, the count rate increases by a factor of 105, opening many new possibilities. In fact, the combination of molecular depth profiling with 2-dimensional imaging to create a 3-dimensional rendering of the chemistry is clearly a future growth area for our field. Incidentally, if somebody could figure out a way to improve ionization of the target molecules, the count rate could be increased by another 4 orders of magnitude, changing the game yet again.
These simple calculations have another important implication. As is clear from papers presented at this conference, and from the discussion to follow, virtually all molecular depth profiling experiments are performed using 2 different modes – one where the beam is on continuously to erode the material and one where the beam is pulsed to acquire a ToF SIMS spectrum. This latter approach is clearly inefficient since no mass spectral information is gained during the erosion cycles. It will be critical to design instrumentation going forward that removes this inefficiency if the advantages noted above are to be fully realized.
Molecular depth profiling and cluster projectiles
Effective molecular depth profiling requires the use of a cluster projectile of some sort. Evidence to this effect has been known for more than 20 years, but perhaps it was most dramatically demonstrated by the Gillen lab using a series of Cn− clusters to bombard a thin film of glutamate as shown in Figure 1. As the size of the cluster is increase from C2 to C8, the degree of chemical damage buildup as a function of time decreases dramatically. Their explanation of this effect is two-fold. First, as the cluster size increases, the kinetic energy per atom decreases. Because of this simple point, the kinetic energy is deposited much closer to the surface than for atomic bombardment, increasing the sputtering yield. The second point is that because of the high sputtering yield and the lower kinetic energy per particle, less chemical damage is created, and what damage remains is removed more effectively.

Molecular ion signal (M-H)–at m/z 146 representing a glutamate film on Si as a function of sputtering time using 3-keV Cn – projectile ions. Figure adapted from Gillen et al., used with permission from the American Vacuum Society.
Which projectile is the best? The answer to that question depends upon the application and is often complicated. Not only does it involve knowing about the physics of the cluster/solid interaction, but also knowing about such mundane factores as cost, durability, focusing properties, brightness, and availability. Too many cluster sources have been investigated to be reviewed here, but there are a set that are making their mark in several laboratories. Perhaps SF5+ has the longest history (4). The advent of the liquid metal sources such as Au3+ (5) and Bi3+ are particuarly attractive due to their imaging qualities, although chemical damage is an issue. Even larger liquid metal clusters have been reported where enormous secondary ion yields allow for coincidence measurements (6). Our laboratory has emphasized C60 as a projectile since it produces relatively little chemical damage and can be focused to a sub-micron spot for 3-dimensional imaging with a one-gun system. Newer cluster sources such as the argon gas cluster ion beam sources (GCIB) offer the best prospect for producing the lowest chemical damage and for yielding the best depth resolution (2), but the focusing properties are still problematic. Other projectiles such as H2O/alchohol snowballs and even liquid droplets offer interesting opportunities for enhanced ionization. At this point, no single projectile has all the properties we are looking for, but the genie is out of the bottle, so to speak. The field is changing rapidly, so what is written here is likely to be out of date by the time the next meeting comes around in Jeju, Korea in 2013.
Model systems
Our initial foray into molecular depth profiling was inspired by Gillen's original experiments, and by reports from the Vickerman laboratory in Manchester that the damage cross sections observed for many biomolecules was greatly reduced when employing the C60 projectile (7). A system was sought that could provide a reproducible platform for identifying the criteria that would minimize the damage cross section even further and hence maximize the quality of the resulting depth profile. We found that a mixture of small peptides with the sugar trehalose provided such a platform. By spin-casting an aqueous solution of this mixture onto a Si substrate, uniform films of about 300 nm in thickness could be created (8). Uniformity was confirmed by simply looking at the optical interference patterns in the film, or more robustly, by interrogating the structure with AFM. Results from the first attempt are shown in Figure 2 for a small tetrapeptide, GGYR.

Molecular depth profile of a thin film of Trehalose with 1% peptide GGYR. The inset shows AFM images recorded at the indicated position of the profile.
There are three points associated with this depth profile that are of special interest. First, there are variations of the signal intensity at the surface for all 3 components. These surface transients are reminscint of the surface transients observed for many years in inorganic depth profiling, and are often associated with removal of an oxide or impurity surface layer. For organic materials, however, the cause may be quite different. The second important point is that the molecular ion signals of trehalose (m/z 325) and GGYR (m/z 452) reach a steady state value after ~20 nm erosion. This steady state signature is essential for molecular depth profiling since any signal decay will ultimately lead to ultimate failure for the depth profile. The third point involves the valuable role that the AFM can play in characterizing these systems. For this case, the rms roughness of the prepared film was about 1.5 nm. After erosion to a depth of 200 nm, the roughness of the film was only 1.0 nm, indicating that C60 erosion actually induces a small amount of smoothing to the system. The AFM is also essential for verifying the integrity of the crater that is created, as illustrated in the figure, and for transforming the abscissa from units of C60 dose to an actual depth measured in nm units.
Erosion Dynamics
An erosion dynamics model has been constructed to help identify the important parameters that control the general shape of a molecular depth profile. This model is based on ideas originally presented by Gillen et al. (9) who noted that the signal dynamics are controlled by the relative rate of chemical damage accumulation versus the rate of chemical damage removal. Our approach balances the flux of sputtered material with the creation of a damaged layer of thickness d where all molecules are destroyed and the flux of supplied material from the bulk to the damaged layer (10). The dependence of the secondary ion signal S on fluence f for a specific molecular ion is then given by
where Sss is the steady state signal, S0 is the extrapolated value of the signal at zero fluence, Ytot is the total sputtering yield, n is the molecular density and σd is the damage cross section. The term in the exponential function, (Ytot/nd) + σd, describes the rate of decay of the signal during the beginning of the depth profile, and is referred to as the disappearance cross section. With simple curve fitting procedures, all of these parameters can be determined for a given depth profile. We define a dimensionless quantity ε as being the ratio of Ytot to the damage volume ndσd as the cleanup efficiency since it is a convenient overall measure of how successful the molecular depth profile has been.
An example of how this procedure can be utilized is shown in Figure 3 for depth profiles of a 300 nm cholesterol film on Si, obtained at different angles of incidence for a 40-keV C60 projectile (11). Note that the sputter yield shown in Figure 3a varies from 300 - 500 molecule equivalents of cholesterol, with the maximum yield occurring at ~45° incidence. The σd value shown in Figure 3b maximizes at a value of ~35 nm2 at the same angle of incidence. The altered layer thickness shown in Figure 3c, however, exhibits a maximum value of more than 60 nm at normal incidence, and steadily declines to just greater than 10 nm at 73° incidence. To get the best cleanup efficiency, it is desirable to maximize Ytot and minimize σd and d. Since these variables do not change in the same way, the dependence of cleanup efficiency with angle is different again as shown in Figure 3d, with the best situation occurring at glancing angles of incidence. Hence, this simple model provides some guidance to picking the best experimental conditions for analysis.

Summary of the erosion parameters (a) Ytot, (b) σd, (c), d, and (d) ε as a function of 40- keV C60 + incident angle. Figure adapted from Kozole et al., used with permission from the American Chemical Society.
Δ-layer models
The next parameter of considerable importance to molecular depth profiling experiments is the depth resolution. For the characterization of multilayer structures on the nanoscale, it is clearly important to be able to acquire information about interfaces on the molecular level. Values on the order of 1 nm are possible with inorganic depth profiling using low energy atomic projectiles, but such values have not yet been achieved using molecular solids. Presumably, the crater formation associated with cluster bombardment increases the likelihood of ion-beam mixing and interface broadening. The influence of topography and chemical reactions must also enter the picture.
To attack this problem, the group at the National Physical Laboratory in the U.K. devised a standard reference material consisting of two forms of Irganox, an anti-oxidant used to stabilize polymers (12). By physical vapor deposition, they were able to embed a series of Δ-layer structures of Irganox 3114 in a matrix of Irganox 1010. These molecules have similar, although not identical structures, and were found to be stable over a period of months or longer. The samples were analyzed, largely with C60 depth profiling, by more than 20 different laboratories with extraordinary reproducibility (13). After their efforts, our laboratory was able to produce Δ-layer structures of lipid bilayers of dimyristoyl phosphatidate embedded in another lipid, arachidic acid, using Langmuir-Blodgett techniques (14).
With these two systems, there has been an effort by many groups to elucidate the variables that influence depth resolution. Factors such as projectile kinetic energy, angle of incidence, reduction of topography by sample rotation, temperature, and the nature of the material itself have been extensively investigated. In our laboratory, the best depth resolution we have obtained is 8 nm for the Irganox samples when profiling at 90 K using 20 keV C60 incident at 71°. For the lipid structures, however, the interface width broadens to 12.1 nm under similar conditions. This observation is consistent with molecular dynamics computer simulations (15), which suggest that energy deposition is closer to the surface with more compact molecular solids like Irganox (3.6 nm), and leaks farther into the solid with more open structures like lipids (10.4 nm). This mechanism is likely the reason why depth resolution is higher for inorganic systems, where the material is the densest.
Wedge-beveling
We are developing a strategy that utilizes wedge-beveled craters to probe more deeply into the behavior of these factors. With this idea, a beveled structure is cut into the molecular solid by adjusting the incident cluster ion beam fluence to remove more material from one end of the crater than the other (16). Typically, the wedge is created from a 500 μm by 500 μm crater with a beveling angle measured with respect to the surface of 0.03°, as shown for the Irganox sample in Figure 4. This configuration offers a number of advantages. The small beveling angle leads to lateral amplification of the Δ-layer width by up to a factor of 10,000, so that it can be observed directly by imaging the bottom of the crater. For example, a 5 nm buried layer would be observed as a 50 μm strip in a SIMS image. Hence, the depth resolution of a series of layers can be determined from a single measurement. A second critical advantage arises from a careful analysis of the AFM data. As seen in Figure 4, the sputtering rate can be determined at every depth in the profile by measuring the slope of the wedge. In addition, the topography buildup with fluence is also easily determined as a function of depth, again with a single measurement.
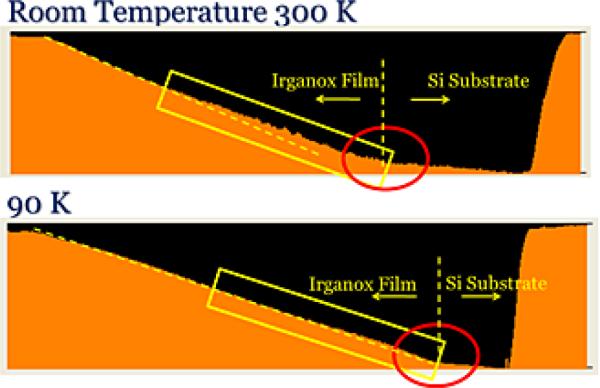
AFM image of an approximately 300-nm Irganox film on Si at 300 and 90 K. Note the change in slope and increase in roughness for the 300 K sample. The Irganox film/Si interface is visible at both temperatures.
The data shown in Figure 4 reveal several interesting features. Note that the slope of the bevel for the room temperature analysis decreases about 50% of the way through the film, at ~200 nm, indicating perhaps chemical damage is starting to appear. Moreover, at precisely this point, the topography of the structure begins to build, as indicated by the enhanced fluctuations of the AFM result. By reducing the temperature to 90 K, the slope change and topography formation are no longer observed, showing in detail, the beneficial effects of reducing the temperature during depth profiling. Upon reaching the Si interface, the expected, yet dramatic reduction of the sputtering rate is evident by a large change in the bevel slope at both temperatures. The reason why the damage and topography should begin abruptly at the 200 nm depth is a mystery at this point. Perhaps there is a critical point where a small amount of carbon formation acts as a template for agglomeration of larger particles. More research is clearly needed to sort this out, but the wedge-bevel protocol greatly speeds our ability to monitor these changes as a function of depth.
Computer simulations and analytic models
Molecular dynamics calculations of cluster/solid impacts have been important for providing a molecular level view of the energy dissipation process, and in some cases, have revealed information about molecular fragmentation. Extending these calculations to molecular depth profiling seems a daunting challenge, however, since many impacts are required before actual erosion of the material begins. Since each impact can require several days of computer time, such repetitive bombardment calculations appear impractical. Even so, using a clever scheme whereby non-overlapping trajectories can be computed simultaneously with parallel processors, considerable progress has been made with multi-hit computer simulations. Postawa and coworkers have been able to show that the material pushed out of an impact crater bottom leads to lateral motion on the nm scale (17). As this material interacts with neighboring impacts, topography begins to be observed. In fact, it is possible to calculate an rms roughness factor on a surface that has reached nearly a steady-state topography, after an effective fluence of ~1013 projectiles/cm2. Results for bombardment of Ag for bombardment by Au3, C60 and Ar872 are shown in Figure 5. Note that the rms roughness increases nearly linearly with the kinetic energy of the projectile, and decreases as the incident angle is increased to 70°. Moreover, the overall roughness is lower as the polyatomic projectile contains more particles. These calculations are in general agreement with what has been found experimentally. If topography is limiting depth resolution, these values should be multiplied by 4 to account for a ±2σ variation expected from these rms numbers.

Calculation of RMS roughness induced by various projectiles with different kinetic energies. The values inside the graph box, except for the “best so far” point, are obtained at 0° angle of incidence. The other values were calculated for 70° angle of incidence. For details, see Postawa et al.
These are still heroic calculations. One appealing approach is to find an analytical model that utilizes parameters that are obtained from the molecular dynamics calculations that allows extrapolation to much larger fluence. With this strategy, molecular level input parameters can be obtained directly without having to perform any curve fitting. Recently, Krantzman and Wucher have reported on a statistical model of sputtering (18). For this model, the solid is divided into layers. As material is removed, the layers are described by filling factors involving several parameters determined from the computer simulations. By calculating the contribution of particles originally located in a particular layer, a depth response function can be determined for a Δ-layer located at any position below the original surface. These types of hybrid models offer great promise to expand our molecular level understanding of such a complex process.
3-dimensional imaging
Molecular depth profiling and 3-dimensional imaging are intimately connected. To acquire 3-dimensional information, the most straightforward approach is to acquire the depth profile in imaging mode. During this process, several hundred images are obtained as a function of depth. Although this process rapidly accumulates a great deal of data, a 3D rendering of an object can be obtained by stacking these images on top of each other using color to identify characteristic masses in the SIMS spectra.
Image stacking only works when the depth scale is the same for each pixel in a given image plane. If there is a differential erosion rate due to heterogeneity in the material, the depth scale associated with each pixel will eventually deviate from the expected value, and the stacked images will not provide an accurate 3D representation. Our laboratory has illustrated this effect using the trehalose/peptide model film after writing an arbitrary pattern using a damaging Ga ion beam (19). The deposition of Ga generates significant heterogeneity, but the different erosion rates can be spotted by AFM and then corrected. Although several groups have reported 3D TOF-SIMS images of biological cells, no one has yet figured out a robust way of getting this depth scale at every pixel in the image. Hopefully, differential sputtering effects noted in our trehalose/peptide system will not be quite so severe in a more uniform-like biological matrix.
Conclusions and observations
The emergence of molecular depth profiling has certainly had an immediate and significant impact on the SIMS community. New opportunities are presenting themselves in rapid fashion. At this conference, we have heard about depth profiling studies in organic electronics, organic light emitting diodes, optoelectronic materials, polymer multilayers and photovoltaics, to name just a few. The SIMS field has been injected with a new sense of purpose, given the surprising success of the cluster SIMS experiments.
Here, we have attempted to provide protocols and theoretical insight that hopefully prove valuable for getting as much out of depth profiling experiments as possible. Most of the examples are drawn from our own laboratory using C60 as a projectile, so obviously the discussion is not meant to be a comprehensive review of the field. However, it is clear from many papers presented in this forum that new developments are bursting forth. The argon gas cluster ion gun, which will soon populate many research labs, promises to take molecular depth profiling to a new level. Hopefully, the protocols presented in this review will be beneficial in evaluating the optimal conditions for depth profiling with these projectiles. It will be interesting to see how we resolve the somewhat conflicting goals of trying to utilize all of the sputtered flux emanating from the depth profile (a one-gun solution), with the varying probe sizes and brightness of the different sources. It looks like exciting times going forward.
Acknowledgements
The work described here is largely the result of collaborations with a number of dear friends. The insight of Barbara Garrison in directing our research cannot be overstated. Andreas Wucher, during many visits to my laboratory consistently amazes me with his depth of knowledge and his ability to inspire my students. Zbigniew Postawa's talents in helping to visualize the sputtering process goad all of us to think in different directions. When it comes to creative thinking, and the generosity to share ideas, John Vickerman has been extraordinarily influential. We are also grateful to the NPL group for sharing the Δ-layer sample, which has played such an important part in the development of this field. And lastly, I am forever grateful to my great bunch of students, who did most of the work discussed here.
Financial support from the National Institute of Health under Grant 2R01 EB002016-18, the National Science Foundation under Grant CHE-0908226, and the Department of Energy Grant DE-FG02-06ER15803 is acknowledged.
References
- 1.Thompson JJ. Phil. Mag. 1910;20:252. [Google Scholar]
- 2.Ninomiya S, Ichiki K, Yamada H, Nakata Y, Seki T, Aoki T, Matuso J. Surface and Interface. Anal. 2011;43:95–98. DOI 10.1002/sia.3587. [Google Scholar]
- 3.Gillen G, King L, Freibaum B, Lareau R, Bennett J, Chmara F. J. Vac. Sci. Technol. A. 2001;19:568–75. [Google Scholar]
- 4.Appelhans A, Delmore J. Anal. Chem. 1989;61:1087–93. [Google Scholar]
- 5.Davies N, Weibel DE, Blenkinsopp P, Lockyer N, Hill R, Vickerman JC. App. Surf. Sci. 2003;203:223–227. [Google Scholar]
- 6.Della-Negra S, Depauw J, Guillermier C, Schweikert EA. Surf. and Interface Anal. 2011;43:62–65. doi: 10.1002/sia.3592. [DOI] [PMC free article] [PubMed] [Google Scholar]
- 7.Fletcher JS, Conlan XA, Lockyer NP, Vickerman JC. App. Surf. Sci. 2006;19:6513–6516. [Google Scholar]
- 8.Cheng J, Winograd N. Anal. Chem. 2005;77:3651–59. doi: 10.1021/ac048131w. [DOI] [PubMed] [Google Scholar]
- 9.Gillen G, Simons DS, Williams DS,P. Anal. Chem. 1990;62:2122. doi: 10.1021/ac00218a014. [DOI] [PubMed] [Google Scholar]
- 10.Cheng J, Wucher A, Winograd N. Anal. Chem. 2007;79:5529–5539. doi: 10.1021/ac070692a. [DOI] [PubMed] [Google Scholar]
- 11.Kozole J, Wucher A, Winograd N. Anal Chem. 2008;80:5293–301. doi: 10.1021/ac8002962. [DOI] [PMC free article] [PubMed] [Google Scholar]
- 12.Shard AG, Green FM, Brewer PJ, Seah MP, Gilmore IS. J. Phys. Chem. B. 2008;112:2596–2605. doi: 10.1021/jp077325n. [DOI] [PubMed] [Google Scholar]
- 13.Shard AG, Foster R, Gilmore IS, Lee J, Ray S, Yang L. Surf. and Interface Anal. 2011;43:510–513. [Google Scholar]
- 14.Lu C, Wucher A, Winograd N. Anal. Chem. 2011;83:351–358. doi: 10.1021/ac102525v. [DOI] [PMC free article] [PubMed] [Google Scholar]
- 15.Paruch R, Rzeznik L, Cserwinski B, Garrison BJ, Winograd N, Postawa Z. J. Phys. Chem. C. 2009;113:5641–5648. doi: 10.1021/jp809769q. [DOI] [PMC free article] [PubMed] [Google Scholar]
- 16.Mao D, Wucher A, Winograd N. Anal. Chem. 2010;82:57–60. doi: 10.1021/ac902313q. [DOI] [PMC free article] [PubMed] [Google Scholar]
- 17.Postawa Z, Rzeznik L, Paruch R, Russo MF, Winograd N, Garrison BJ. Surf. and Interface Anal. 2011;43:12–15. [Google Scholar]
- 18.Krantzman KD, Cook EL, Wucher A, Garrison BJ. Nuclear Instrum. & Methods in Physics Research B. 2010;269:1591–1594. [Google Scholar]
- 19.Wucher A, Cheng J, Winograd N. Anal. Chem. 2007;79:5529–5539. doi: 10.1021/ac070692a. [DOI] [PubMed] [Google Scholar]