Abstract
Objective
There is great interest in designing implantable neural electrode arrays that maximize function while minimizing tissue effects and damage. Although it has been shown that substrate geometry plays a key role in the tissue response to intracortically implanted, penetrating neural interfaces, there has been minimal investigation into the effect of substrate footprint on the tissue response to surface electrode arrays. This study investigates the effect of micro-electrocorticography device geometry on the longitudinal tissue response.
Approach
The meningeal tissue response to two micro-electrocorticography devices with differing geometries was evaluated. The first device had each electrode site and trace individually insulated, with open regions in between, while the second device had a solid substrate, in which all sixteen electrode sites were embedded in a continuous insulating sheet. These devices were implanted bilaterally in rats, beneath cranial windows, through which the meningeal tissue response was monitored for one month after implantation. Electrode site impedance spectra were also monitored during the implantation period.
Main Results
It was observed that collagenous scar tissue formed around both types of devices. However, the distribution of the tissue growth was different between the two array designs. The mesh devices experienced thick tissue growth between the device and the cranial window, and minimal tissue growth between the device and the brain, while the solid device showed the opposite effect, with thick tissue forming between the brain and the electrode sites.
Significance
This data suggests that an open architecture device would be more ideal for neural recording applications, in which a low impedance path from the brain to the electrode sites is critical for maximum recording quality.
Keywords: Micro-ECoG, Tissue Response, In vivo imaging, Collagen, Neural Interface
1. Introduction
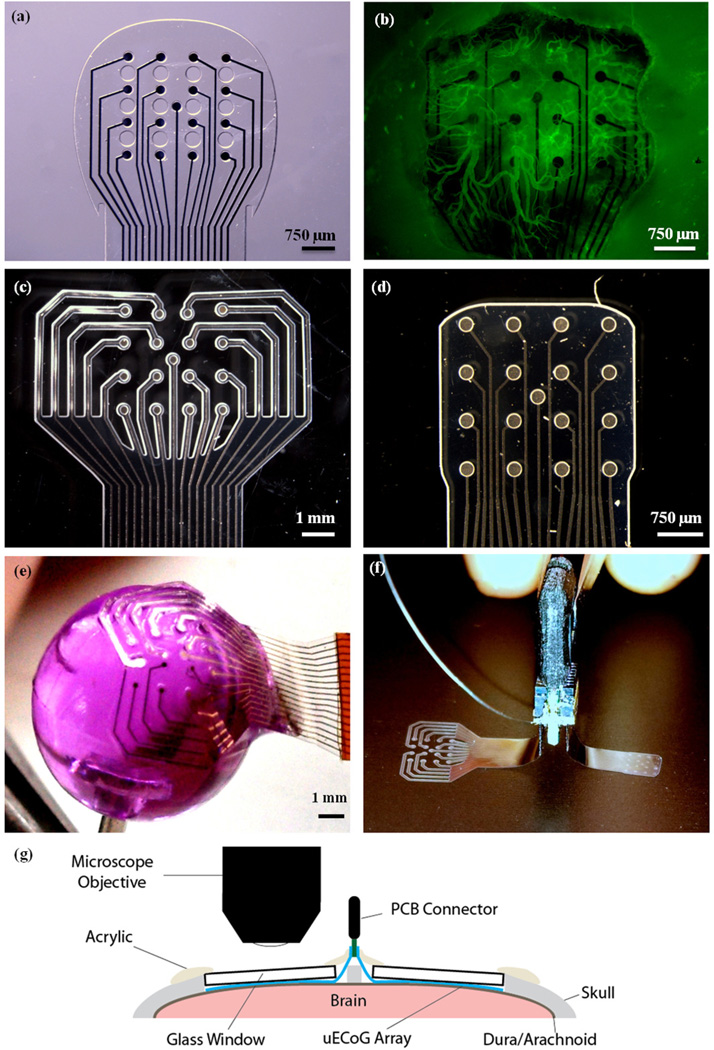
Micro-electrode arrays (MEAs) for brain-computer interfacing (BCI) applications must be designed for long-term in vivo reliability, due to the extended time periods over which are implanted. One approach to creating more reliable MEAs has been to alter the substrate geometry. Previous studies have shown that devices with a more open architecture elicit a smaller inflammatory response than devices with solid substrates, presumably due to the open architecture devices having less foreign material present and allowing for diffusion of soluble factors from one side of the device to the other (1,2). These studies, however, have been performed on MEAs which penetrate the cerebral cortex. Recently, the finding that these types of penetrating arrays can cause significant glial scarring, which often results in a degradation of signal quality (3), has led to a push towards less invasive surface electrode arrays, such as the micro-electrocorticography (micro-ECoG) device (Figure 1(a)) (4–7). Micro-ECoG devices have shown great promise due to their flexibility, substrate transparency, recording longevity, and improved signal information (4,7–9), but further studies need to be done to test which type of micro-ECoG design gives maximum function with minimal inflammation. In particular, the impact of the footprint of these devices on the tissue response has not been previously examined.
Figure 1.
Electrode array designs and implantation layout. (a) Fenestrated micro-ECoG device from previous imaging study. Note the holes through the Parylene substrate of the device, between the electrode sites. (b) In vivo image of vascular growth around fenestrated micro-ECoG device, 30 days after device implantation. Image was taken using a Leica MZ 16F fluorescent stereoscope with a GFP2 filter and broad spectrum light. Animal was injected with 6 mg of FITC-Dextran in 0.5 ml saline, to promote vascular fluorescence. (c) Mesh micro-ECoG device. (d) Solid micro-ECoG device. (e) Demonstration of the flexibility of the mesh micro-ECoG array. The device is adhered to the head of a thumbtack. The tack head was dipped in water and the hydrophilic nature of the substrate allowed it to conform to the rounded surface. (f) Bilateral device with mesh and solid micro-ECoG arrays attached to a single PCB connector, as was implanted in each animal. (g) Cross-sectional schematic diagram of the implantation layout.
Although it has been generally assumed that cortical surface arrays do not elicit a significant biological response, our former study has revealed substantial vascular changes occurring around the implanted devices (10). In this study, micro-ECoG devices were implanted beneath cranial windows, enabling long-term in vivo imaging of the cortical tissue response and observation of delicate interfacial tissues that are often destroyed during traditional histological analyses. It was discovered that new blood vessels grew up through holes in the micro-ECoG device and spread laterally over the entire top surface of the array, as seen in Figure 1(b). This finding, and the previous findings that devices with less substrate may cause a more minimal tissue response, led to further questions about how the tissue response to the micro-ECoG device would compare to the tissue response to clinical ECoG devices, which do not have holes through the polymer substrate. In addition, these results prompted questions regarding how the surrounding tissue would respond to a surface electrode array with less substrate, in comparison to a device with more substrate material.
In this study, animals received bilateral micro-ECoG implants beneath cranial windows. On one hemisphere of the brain, a "mesh" micro-ECoG device was implanted, which had each electrode site and trace individually insulated, with open space in between the traces. The term "mesh" has been coined by Kim et al to describe a similar open architecture neural surface electrode (11), and so will be used throughout this paper to describe our minimal substrate array. On the other hemisphere, a solid micro-ECoG device was implanted, which had no holes through the Parylene substrate, similar to the layout of a clinical ECoG grid. The vascular response to each device was monitored over the entire implantation period by imaging through the cranial windows with a fluorescent microscope. Traditional histological techniques as well as optical coherence tomography (12) and second harmonic generation imaging (13) were used in conjunction with in vivo stereo fluorescence microscopy to further analyze the tissue growth around the implanted devices. In addition to the tissue response, the electrode site impedances were also compared between the two types of devices (solid vs. mesh), to evaluate the effect of the device geometry on its recording capabilities. The results of this experiment will aid in determining the ideal geometry for cortical surface microelectrode arrays, in terms of biocompatibility and signal stability.
2. Materials & Methods
2.1 Device and Fabrication
Micro-ECoG devices were fabricated following the protocol described previously (4,10). In this case, since two electrode arrays were to be implanted in a single animal to allow for direct comparison, both the mesh and the solid micro-ECoG devices were affixed to a single printed circuit board (PCB) connector, with the mesh device on one side of the connector and the solid device on the other side (Figure 1(f)). Since the brain hemispheres are relatively symmetrical in terms of anatomy and function, implanting these arrays on the left and right hemispheres, respectively, should not have a confounding effect on the electrode site impedance spectra or on the tissue response to the devices.
The layout of the solid micro-ECoG device was identical to that of the standard, fenestrated micro-ECoG array reported previously (10), except that there were no holes through the Parylene substrate. In the mesh device, since each individual trace was insulated separately and enough insulation was required to create a tight seal around the traces and electrode sites, the total size of the array, in terms of the surface area of cortex it would cover, was larger than that of the fenestrated and solid micro-ECoG devices. However, the areal density, or the ratio of the amount of material touching the brain to the total surface area the device covers, was much smaller (Table 1). Additionally, in order to make room for the extra insulation material, the spacing between sites on the mesh device was 1 mm, as compared to 750 µm in the other two devices. Since this experiment was not concerned with comparing the spatial behavior of the signals recorded by the two types of devices, the difference in electrode site spacing does not impact the results.
Table 1.
Summary of surface area data for mesh, solid, and fenestrated Micro-ECoG devices.
| Device Type | Total Area In Contact with Brain (mm2) |
Total Implantation Area (mm2) |
Areal Density |
|---|---|---|---|
| Mesh | 11.09 | 29.42 | 38% |
| Fenestrated | 7.84 | 8.53 | 92% |
| Solid | 8.53 | 8.53 | 100% |
2.2 Ethics Statement
All animal procedures were approved by the Institutional Animal Care and Use Committee (IACUC) at the University of Wisconsin - Madison. All efforts were made to minimize animal discomfort.
2.3 Surgical Implantation
Male Sprague Dawley rats (n = 4) received bilateral implants, with the mesh micro-ECoG device on one hemisphere of the brain and the solid micro-ECoG array on the other hemisphere. A schematic of the implantation layout is shown in Figure 1(g). The surgical implantation procedure followed that described in the previous cranial window imaging paper (10). Briefly, the rats were anesthetized with isoflurane gas, and received subcutaneous injections of buprenorphine hydrochloride (0.05 mg/kg, Reckitt Benckiser Healthcare Ltd) for pain management and dexamathasone (2 mg/kg, AgriLabs) to prevent brain swelling. Craniotomies were made on both hemispheres of the skull with a #107 engraving tool. Using a hand drill and a #56 drill bit, holes were drilled through the skull for the placement of screws, to which wires were connected from the PCB connector of the device, to act as ground and reference. The micro-ECoG device was affixed to a micro-manipulator and stereotactically lowered onto the surface of the brain, with the mesh device in one craniotomy, the solid device in the other, and the connector in the middle, along the sagittal suture. After the devices were in place, cranial windows were positioned over the top of each device. Due to the larger surface area of the mesh micro-ECoG, an 8 mm diameter glass coverslip was used to form the cranial window, so that the full array was within the viewing area, while a 5 mm diameter glass coverslip was used in the case of the solid micro-ECoG array. Both coverslips had a thickness of 0.15 mm. Once the cranial windows had been placed on the devices, small pieces of Gelfoam (Pfizer Injectables) were arranged in any gaps between the edges of the craniotomies and the glass coverslips, and then UV curable dental acrylic (Fusio, Pentron Clinical) was applied to seal the coverslips to the skull. Next, the ground and reference screws and wires, as well as the electrode neck and base of the connector were covered in dental acrylic to form a smooth cephalic implant. The skin was then sutured around the cephalic implant, and the animal was revived and allowed to recover. After surgery, animals received additional doses of buprenorphine and dexamethasone, for pain management, as well as ampicillin (50 mg/kg, Sage Pharmaceutical) injections, twice daily, for one week, to prevent infection.
2.4 Vascular Imaging
Animals were imaged biweekly for at least one month after device implantation, or for as long as the cranial windows remained clear. For each imaging session, animals were anesthetized with a combination of dexmedetomidine (0.05–0.5 mg/kg, Orion Pharma) and 1% isoflurane gas. To minimize breathing artifacts, the rats were held in a stereotactic frame using ear bars, after application of 2% topical lidocaine ointment to the inner ear. An upright fluorescent stereoscope (Leica MZ 16F, Leica Microsystems) was used to image the tissue response to the implanted electrode arrays. Fluorescein isothiocyanate labeled dextran (30 mg/kg, average molecular weight 2,000,000, Sigma Aldrich product #52471) was injected via the tail vein in order to enhance the ability to visualize the vasculature, by causing the vessels to be fluorescent under blue light. Both bright field and fluorescent images of the cortical tissue response were captured. In addition, blood flow was visible with the aid of the FITC-Dextran injections, and thus some blood flow videos were also recorded. After the imaging session was complete, the animals were taken off the isoflurane and received subcutaneous injections of atipamezole hydrochloride (0.3 mg/kg, Orion Pharma) to reverse the dexmedetomidine anesthesia.
2.5 Impedance Spectra and Baseline Signal Recording
Impedance spectra were taken for each electrode site on the same days on which the vasculature was imaged (14). Impedance spectrum data was collected using a potentiostat (Autolab PGSTAT12). Real and imaginary impedance values were evaluated at 30 different frequencies, from 10 Hz to 30,937 Hz, using a two-electrode method with the bone screws implanted in the skull acting as the ground. Animals were awake and behaving for the collection of the electrode site impedance spectra.
2.6 Histological Analysis and OCT Tissue Thickness Quantification
After data collection was complete, animals were euthanized by cardiac perfusion, following the protocol outlined by Li et al, in which a lipophilic1,1′-dioctadecyl-3,3,3′,3′-tetramethylindocarbocyanine perchlorate (DiI) solution was injected transcardially during the perfusion, in order to fluorescently label the tissue vasculature (15). Once perfused, the brains were dissected and sliced into 200 µm thick cortical sections using a vibratome (Leica VT1200). Microscope slides of the tissue samples were then prepared following the procedure described in the Li protocol (15). The slides were imaged under green (541–551 nm) light, since this is the excitation wavelength of the DiI. The Leica fluorescent stereoscope described above was used for analysis of the cortical slices.
In addition to examination of the cortical vasculature, histological evaluation of the scar tissue surrounding the micro-ECoG devices was also necessary. After brain removal, bright field and fluorescent images were taken of the underside of the skull, where the electrodes were affixed. After this initial evaluation, the electrode and surrounding tissue were cut away from the skull and cranial window, for histological analysis. The samples were then imaged using second harmonic generation (SHG) with a Prairie Ultima Intravital Multiphoton microscope (Prairie Ultima IV, Prairie Technologies). All SHG images were collected at an excitation wavelength of 890 nm with a Zeiss 20× 1.0NA Plan-Apochromat Water objective (WD 1.7) and a narrow band SHG filter (445/40, Chroma) to isolate the SHG signal from background fluorescence. This method allowed for the determination of whether a collagen signal was present in the tissue surrounding the devices (16). Following SHG imaging, select tissue samples were sectioned and stained with hematoxylin and eosin (H&E), to determine the tissue morphology.
It was also desired to quantify the thickness of the tissue that had grown both above and below the implanted devices. Since traditional histological methods involve the use of alcohols, which dehydrate the tissue, causing non-uniform shrinkage, it was necessary to find a different, high-resolution method for thickness quantification. Ultimately, optical coherence tomography (OCT) was chosen, due to its ability to quickly and non-destructively image the device-tissue interfaces and produce a cross-sectional view through the entire sample (something that was not possible using SHG optical sectioning, due to the large sample thicknesses). A custom spectral domain OCT (SD-OCT) system (1300 nm wavelength, 200 nm source bandwidth) was used for this application. Two-dimensional cross-sectional images were taken of each electrode/tissue sample, and the thickness of the tissue above and below each device was measured in a minimum of three positions per animal, and averaged.
3. Results
3.1. Chronic in vivo Imaging Results
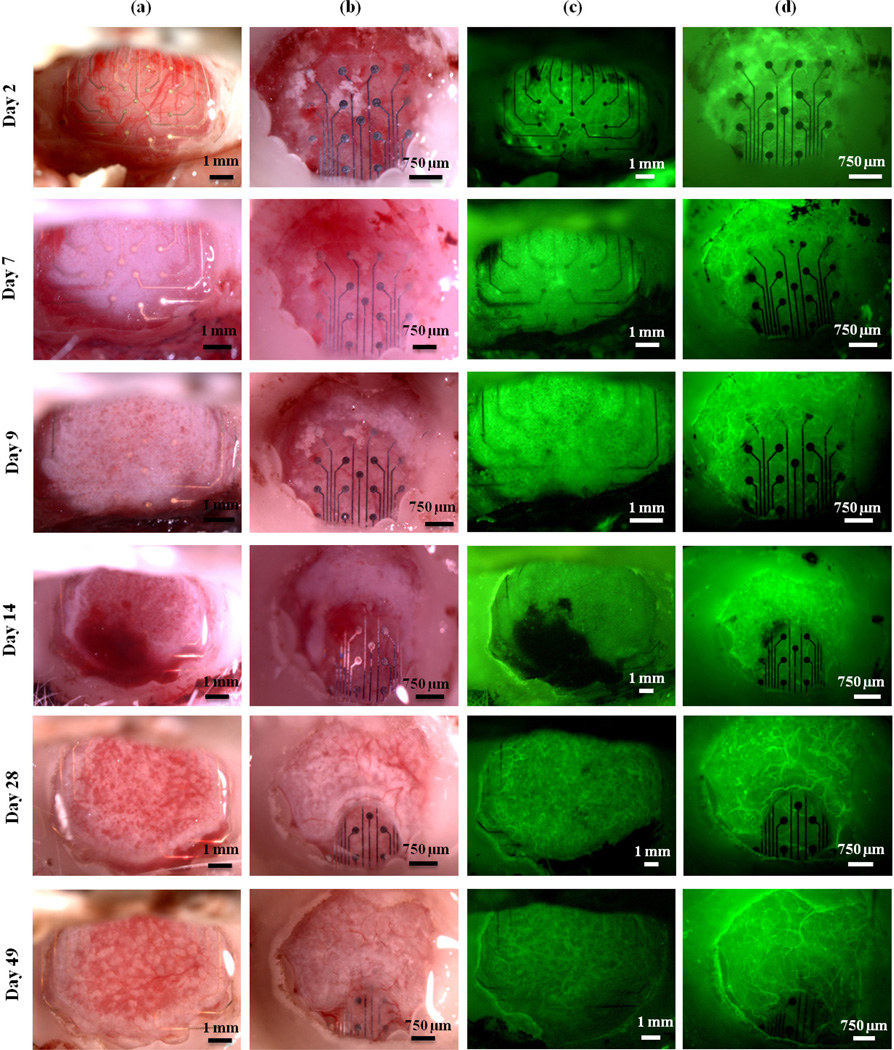
The progression of tissue growth around mesh and solid devices in one representative animal is shown in Figure 2. Column (a) shows images taken of the mesh micro-ECoG device, using bright field microscopy. Column (b) shows the solid micro-ECoG device in bright field. Columns (c) and (d) display fluorescent images of the mesh and solid devices, respectively. Note the formation of opaque, fibrous tissue around the mesh device only one week after implantation. This tissue appears to be initially avascular, but as it continues to thicken around the device, a vasculature forms, as can be seen in Figure 2, Day 28. In Figure 2(b), the white areas around and below the device on day 2 are not tissue growth, but remnants of bone from the drilling of the craniotomy, which became trapped beneath the micro-ECoG device during implantation. In the case of the solid device, the opaque, white tissue appears to thicken beneath the device for a few days before beginning to wrap around the edges of the device and spread onto the top surface.
Figure 2.
The progression of tissue growth over time. Columns (a) and (b) contain bright field images of the mesh and solid devices, respectively. Columns (c) and (d) contain fluorescence images of the mesh and solid devices, respectively. Images shown are for mesh and solid devices implanted in a single animal.
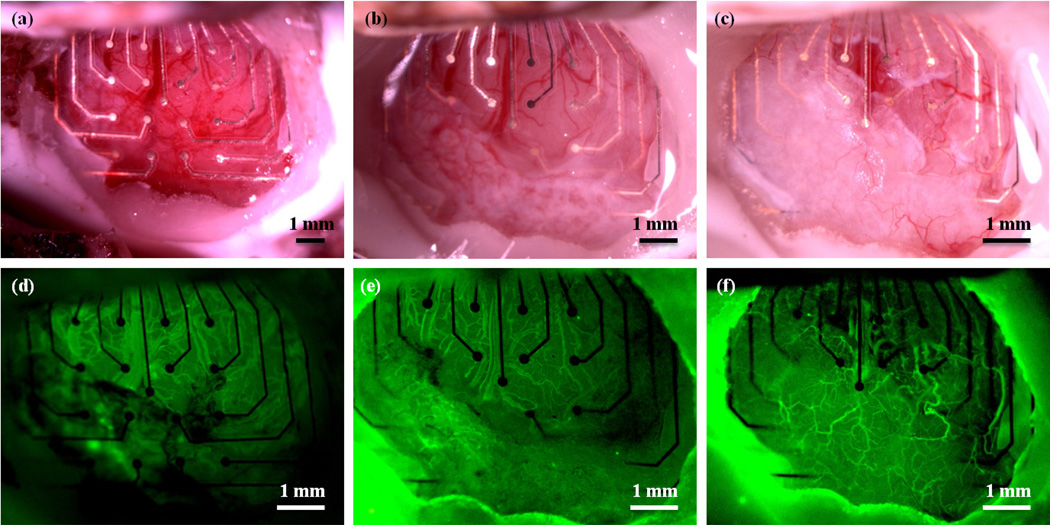
In one animal, an accidental tear in the dura occurred on the hemisphere on which the mesh electrode array was implanted, as a result of the implantation surgery. It was discovered that the opaque, fibrous tissue formed only in the regions of the window in which the dura mater was intact, as shown in Figure 3. Since portions of this animal's window remained clear due to the dural tear, the animal was imaged for over one year after implantation of the devices. Even 419 days after implantation, the scar tissue had not completely encapsulated the device, and regions of the cerebral cortex were still visible, as shown in Figure 3(c) and (f).
Figure 3.
Images of a mesh electrode implanted in an animal with a dural defect. (a) Bright field image 1 day after implantation. (b) Bright field image 45 days after implantation. Note the formation of opaque, white tissue in the dural regions, but not in the area where the dura was removed. (c) Bright field image 419 days post implantation. (d), (e), and (f) Fluorescence images 1, 45, and 419 days post implantation, respectively.
3.2. Scar Tissue Characterization
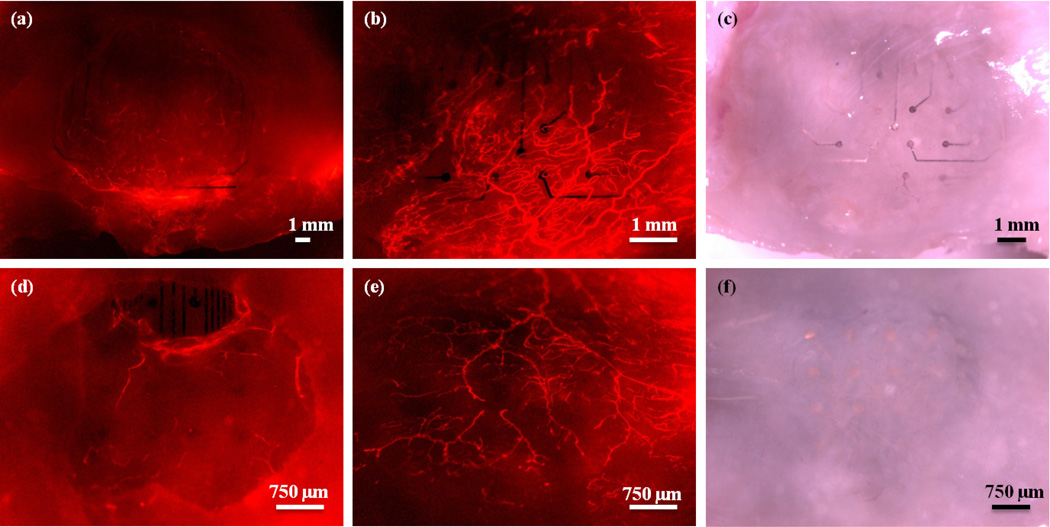
Transcardial perfusion with DiI solution was used to fluorescently label the cortical vasculature for ex vivo analysis. Figure 4 shows fluorescent and bright field images of the electrodes and surrounding tissue in the same animal represented in Figure 2. Figure 4(b) and (c) are images taken of the underside of the mesh device, after brain removal, while Figure 4(e) and (f) are images taken of the underside of the solid device after brain removal. From these images, it is apparent that the mesh electrode sites are much more clearly visible than the electrode sites on the solid array, suggesting that more tissue has formed beneath the solid array than beneath the mesh.
Figure 4.
Electrodes and surrounding tissue in one animal after perfusion with DiI to stain the tissue vasculature. (a) Fluorescence image of the mesh device through the cranial window. (b) Fluorescence image of the underside (the region in contact with the cortex) of the mesh device after brain removal. (c) Bright field image of the underside of the mesh device. (d) Fluorescence image of the solid micro-ECoG device through the cranial window. (e) Fluorescence image of the underside of the solid device after brain removal. (f) Bright field image of the underside of the solid micro-ECoG device. Note that the electrode sites are clearly visible in the images of the underside of the mesh micro-ECoG device, but are difficult to see in the case of the solid device. Animal was perfused 112 days after implantation.
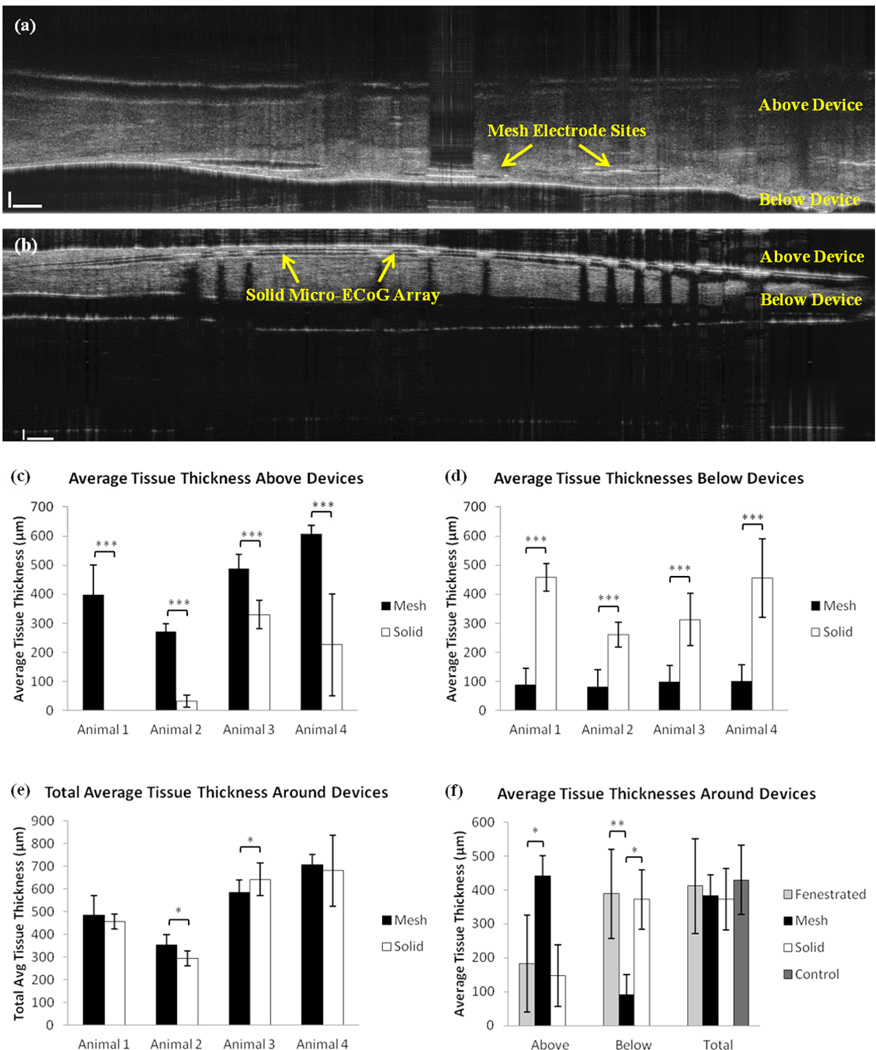
In order to definitively determine whether the tissue growth between the brain and the electrode array was thicker in the case of the solid device, it was necessary to quantify the amount of tissue growth above and below the devices. To do this, an SD-OCT system was used to obtain cross-sectional views of the electrode arrays and surrounding tissue after the animals had been perfused. Multiple measurements were taken at different positions within each sample, of the tissue thickness above and below the micro- ECoG devices. In order to determine the actual tissue thickness, it was necessary to divide the thickness measured from the OCT images by the refractive index of the tissue. The tissue refractive index was calculated following the method described in the supplement. After determination of the actual tissue thickness based on the refractive index, thickness averages were calculated for each animal, as well as across all animals. Figure 5 (a)–(e) shows a summary of the OCT thickness measurement results for the mesh and solid devices. Tissue samples from the previous study, in which fenestrated micro-ECoG devices were implanted beneath cranial windows (10), were also analyzed using the OCT system, to determine how the tissue distribution around the fenestrated arrays compared with the mesh and solid devices. The previous micro-ECoG window imaging study also discussed a subset of "control" animals, which were implanted only with cranial windows, but no devices. These animals also experienced tissue growth beneath the windows, and the thickness of this tissue was analyzed and compared to the total tissue growth thicknesses for the other three types of implants. The average results of these comparisons are shown in Figure 5(f). Both the fenestrated device animals and the control window animals underwent the same surgical procedure as the animals implanted with Mesh and Solid devices.
Figure 5.
OCT tissue thickness data. (a) Cross-sectional OCT image of a mesh device and surrounding tissue. (b) OCT image of the solid device and surrounding tissue. (c) Plot of average tissue thickness above (between the device and the window) mesh and solid devices in four different animals. (d) Plot of average tissue thickness below (between the electrode array and the brain) mesh and solid devices in four different animals. (e) Plot of total average tissue thickness surrounding the mesh and solid devices in four different animals. (f) Plot of average tissue thickness above and below devices, as well as the total average tissue thickness in the fenestrated (n=6), mesh (n=4), solid (n=4), and control cases (n=5). Error bars represent +/− one standard deviation from the mean. P-values in (c) – (e) were calculated using Welch's t-test. Sample sizes per animal varied due to variations in tissue distributions around devices and variations in dissected tissue size. P-values in (f) were calculated using a non-parametric Wilcoxon Mann- Whitney test (*P < 0.05, **P < 0.01, *** P < 0.001).
In addition to quantifying the thickness of the tissue around the micro-ECoG devices, it was also desired to determine the type of tissue that was present. It was initially postulated that this tissue could be composed of collagen, since collagen has been shown to be a major component of scar tissue in most parts of the body (17–20). Although collagen is not generally investigated with respect to the tissue response to indwelling neural implants, since the brain does not have much native collagenous tissue, it has been shown to be present in scar tissue surrounding penetrating electrode arrays tethered to the skull (21). Additionally, the meninges have large collagen components, in particular within the dura mater, which is mainly composed of collagen fibers (22,23). Furthermore, collagen deposition has been found to occur in the meninges following subarachnoid hematomas (24). Therefore, the assumption that collagen would be a key player in scar formation, especially in the case of an implant in contact with the dura mater, was not unfounded.
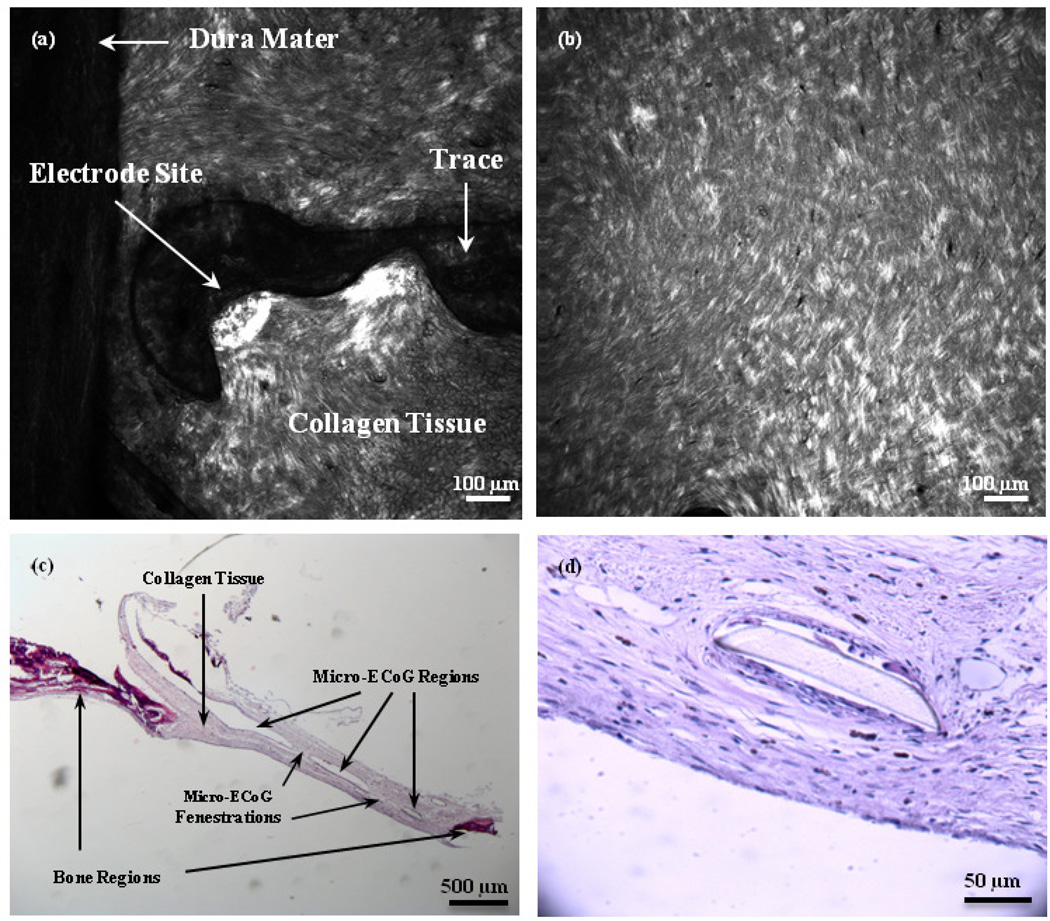
Second harmonic generation (SHG) imaging and traditional histological staining (H&E) were used in conjunction, to establish whether collagen was present in the scar. Figure 6(a) and (b) shows SHG images of the tissue surrounding the mesh and solid micro-ECoG devices, respectively. It is apparent from these images that an SHG collagen signal was present in the scar tissue. Collagen fibers appear to align slightly with the curve of the mesh electrode site in Figure 6(a), and have wrapped around the edge of the Parylene insulation, spreading both below and above the electrode site and trace. On the left side of the image, a portion of the dura mater, which adhered to the scar tissue upon removal of the brain from the skull, is visible. The collagen fibers of the dura mater appear to be longer and more aligned than those of the scar tissue. The tissue beneath the solid micro-ECoG device, shown in Figure 6(b), appears to be thicker and slightly less well-aligned than that around the mesh device.
Figure 6.
SHG and H&E images of scar tissue surrounding Micro-ECoG devices. (a) SHG image of scar tissue around one electrode site and trace of a mesh device, looking from the underside of the skull, with the brain removed. (b) SHG image of scar tissue beneath a solid micro-ECoG array. (c) Bright field image of an H&E-stained cross-section of tissue surrounding a fenestrated micro-ECoG device. Darker stained sections on the edges of the sample are representative of bone tissue, while the lighter regions in the middle are collagen fibers. The open regions in the center represent the place where the micro-ECoG was. The device pieces floated out during the staining procedure. (d) Higher magnification image of collagen tissue surrounding a portion of the micro-ECoG device that remained intact during staining.
Figure 6(c) and (d) shows images of H&E sections of the scar tissue surrounding a fenestrated micro-ECoG device. The open regions in the center of the tissue shown in Figure 6(c) are the areas where the micro-ECoG device had been, as it was dislodged from the microscope slide during the staining procedure. The darker stained tissue near the edges of the image is bone tissue, while the lighter tissue in the center is composed of collagen fibers. The fenestrations through the micro-ECoG device are also visible from this image, and it appears that the collagen has grown completely through these fenestrations and onto the topside of the device. Figure 6(d) shows a higher magnification view of the collagen tissue surrounding a small segment of the micro-ECoG device that remained intact during staining.
3.3 Longitudinal Impedance Analysis
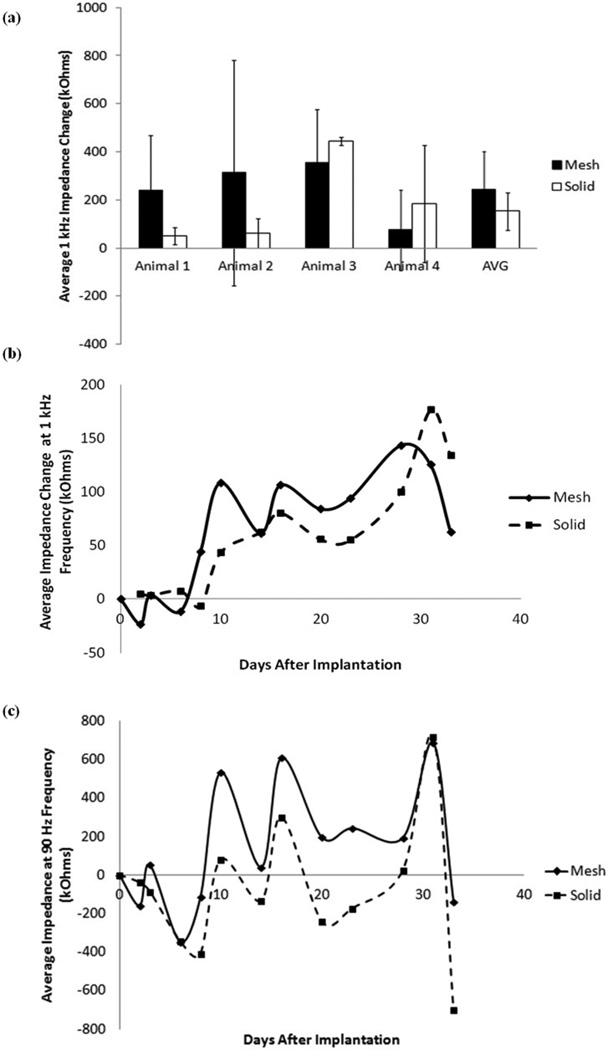
In order to determine the effect of tissue growth around the micro-ECoG devices on recorded signal quality, electrode site impedance spectra were measured in conjunction with the cranial window imaging of the tissue response. Figure 7(a) shows the average change in the 1 kHz impedance between the first and final days of implantation for the mesh and solid devices implanted in four different animals. The 1 kHz frequency was chosen for impedance analysis because it is a commonly used benchmark for neural impedance measures (14). It is apparent from this plot, and the plot of the average 1 kHz impedance for all four animals over time, shown in Figure 7(b), that there is not a significant difference between the impedance changes of the two types of devices. The dip in the average impedance change between 30 and 35 days after implantation was attributed to normal day-to-day fluctuations seen in all animals. It is postulated that if all animals had been tested out past this time point the impedance would rise again. The average change in impedance at 90 Hz frequency over all four animals is shown in Figure 7(c). Although the fluctuations in the impedance are higher in magnitude at this frequency, the same general trend is present. This relationship between the 1 kHz and 90 Hz impedance values was also demonstrated in the previous cranial window imaging study (10).
Figure 7.
Average impedance change data. (a) Average change in impedance for mesh and solid devices in four animals on the final day of implantation. Error bars represent +/− one standard deviation. (b) Total average change in impedance for mesh and solid devices for four animals. Change in 1 kHz impedance was calculated from the first impedance measurement after implantation and averaged over all 16 channels on each device. If channels had 1 kHz impedance values greater than 1000 kOhms they were considered to be dead channels, and thus not included in the average. (c) Total average change in 90 Hz impedance for mesh and solid devices in four animals, over time.
In one case, where the animal was tested for over a year, the average impedance of the mesh device was consistently lower than that of the solid device, after the first twenty days of implantation. A plot of this data is shown in Supplemental Figure 1. Based on the results from this one animal, it is postulated that the reason that no significant impedance difference was observed between the mesh and solid devices over time in most of the animals was that impedance measurements were only taken for a period of 30 to 40 days, in most cases, and it appears from the plot that most of the significant difference occurs after about 30 days of implantation. Therefore, in the future, it may be necessary to take impedance measurements over a longer period of time in order to see significant results.
4. Discussion
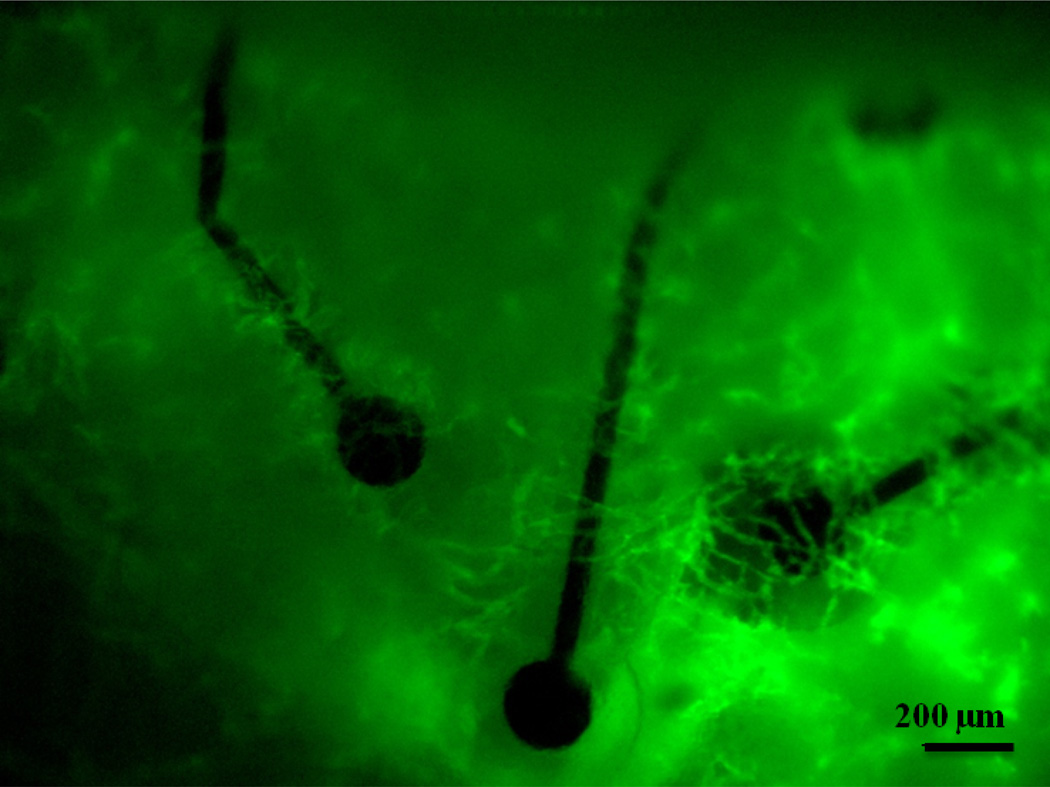
This study demonstrates that the tissue response to epidurally implanted micro-ECoG arrays differs depending on the substrate geometry. Chronic cranial window imaging of the two types of devices revealed that scar tissue began to grow up between the traces of the mesh devices as early as seven days after implantation. Due to the open architecture of the mesh device, the tissue vasculature was able to wrap around each individual electrode site and trace, as shown in Figure 8. In the case of the solid devices, since the tissue had no immediate pathway to the top surface of the array, it thickened beneath the devices for several days. In some cases it would eventually wrap around the edges of the device and spread over the top surface of the array, as shown in Figure 2, but in many cases the tissue growth remained beneath the device for the duration of the implantation period.
Figure 8.
Blood vessels wrap around the individually insulated electrode sites and traces of the mesh micro-ECoG device. Image taken 6 days after implantation.
OCT analysis of the tissue surrounding the implants demonstrated that the total thickness of the tissue growth was not significantly different between each of the four conditions (mesh, solid, fenestrated, and control window), but that the distribution of the tissue varied. The tissue thicknesses above and below the devices were significantly different between the mesh devices and the solid and fenestrated devices, however, there was no significant difference between the thickness distributions for the fenestrated and solid devices. These results can be at least partly explained by looking at the percentages of the cortical area covered by each type of device, as shown in Table 1. Although the mesh device covers much more total surface area than the fenestrated or solid devices, the percentage of the implantation area covered is much smaller than that of either the fenestrated or solid devices, since the mesh devices require a larger craniotomy. This suggests that it is not the total amount of area covered by the device that determines the tissue thickness distribution, but the amount of open area through which the tissue can grow to the other side of the device. Additionally, although the previously reported control window study (10) included a control in which the window was not in contact with the brain, to account for the response of the dura to the window itself, further analysis of tissue thicknesses around normally implanted devices, without cranial windows, would lend valuable insight into the role of the window in this response. It should be noted that collagenous tissue growth has been observed in animals without windows, but thickness characterization for these animals was beyond the scope of this study.
Second harmonic generation imaging revealed the presence of collagen in the intact scar tissue, and additional immunohistology confirmed that the bulk of the scar was composed of collagen fibers and was not bone. Further analysis will be necessary in order to determine the type of collagen present, as well as whether the fiber length or alignment differs between the different types of devices.
Astrocyte and microglia antibody staining was also performed on the brain of the animal which was implanted for one year, to determine whether there was a glial response to the presence of the array. Supplemental Figure 2 shows cortical sections of brain beneath the mesh and solid devices, stained with GFAP (for astrocytes) and Iba1 (for microglia) antibodies. From the images, it is apparent that there was an astrocytic response to the devices, but not a significant response from the microglia. Future studies involving chronic in vivo imaging on a cellular level using techniques such as multi-photon intravital imaging (25–27) would be beneficial to gain a complete understanding of the tissue response to these implanted arrays, as well as to lend a better understanding to the electrode site impedance data.
Although most of the impedance data revealed no significant differences between 1 kHz or 90 Hz impedances for the mesh and solid devices, differences were observed in the animal implanted for an extended period of time. This suggests that perhaps impedance stabilization occurs over a time course longer than one month after implantation. This could be due to consolidation of the collagen layers over time (28), or due to changes on a more cellular level (i.e. the astrocytic response mentioned above), which were not observable via the cranial window imaging method. In the animal with the dural tear, a tissue ranking system was developed, to correlate the amount of scar tissue around a particular electrode site with the electrode site's 1 kHz impedance. The correlation is shown in Supplemental Figure 4, and indicates that electrode sites with larger amounts of surrounding scar tissue have more variable, and perhaps higher, impedance values. The reasons for the lack of dural repair in this case are unknown, although there is a wealth of research into the development of products to aid with dural healing and reconstruction, suggesting that this is a common problem (29–31). Additional studies involving purposely creating dural tears during electrode implantation or subdurally implanting micro-ECoG arrays, would not only aid in understanding the nature of the collagen scar tissue formation and whether it is purely a dural response, but would also allow for more thorough tissue-impedance correlation studies, since the presence of the dural tear appeared to correlate with an increased variability in the tissue response.
Overall, the results of this imaging study corroborate previous studies, which have found that devices with open architecture are more ideal chronic neural platforms (1,2). However, it must be noted that in the current study, the mesh device did not elicit a smaller tissue response, but instead a more ideal distribution of the scar tissue for our application. The presence of significantly thicker tissue between the recording sites and the brain could have a detrimental impact on the ability of the device to record neural signals, since the tissue would create a greater distance between the electrode sites and the neurons they are recording from, as well as an insulating barrier that would hinder the transmission of the neural signals. Although these experiments did not demonstrate a stark impact of tissue thickness on recorded signal quality, it must be noted that this study was performed in rats, which have very small tissue thicknesses compared to humans. In a human model, the tissue distribution would likely have a much larger impact on the quality of the recorded signals, due to an increased tissue thickness for the neural signals to travel through (32). Development of substrate geometries which result in tissue thickening on top of the device and remaining thin below it, such as in the case of the mesh micro-ECoG array, allow for the device-anchoring benefits of having tissue integrated within the array, while minimizing the unfavorable signal quality degradation.
The results of this study inform future work, which will first be directed at determining the role of the dura mater in this scar tissue formation, through dural resection prior to device implantation. In addition, the longitudinal response of other cell types, such as astrocytes and microglia, to neural interfaces implanted on the surface of the brain will be investigated through the use of multi-photon intravital imaging techniques. Additional studies could incorporate the delivery of drugs and other factors to the implant site, to evaluate their impact on scar tissue formation and recorded signal quality. Some substances which may be of interest to explore include collagenase, to suppress collagen formation, VEGF, to stimulate angiogenesis, and Thalidomide, to inhibit angiogenesis. The delivery of these substances to the implant site may lead to a better understanding of the role of specific tissue types (i.e. collagen and vascular tissue) in scar formation.
5. Conclusion
In vivo imaging of the mesh and solid micro-ECoG devices via the cranial window implantation scheme revealed the growth of a collagen scar tissue around both electrode arrays over a period of one month after implantation. With the aid of optical coherence tomography, it was found that the distribution of this collagen scar tissue was significantly different between the two types of devices, with the results suggesting that a more open architecture device would be beneficial for minimizing the amount of scar tissue formation between the electrode sites and the brain. Future, longer-term studies will be necessary in order to definitively demonstrate the impact of device geometry on recorded signal quality, as well as the role of the dura mater. Development of cellular level in vivo imaging techniques will provide a more thorough understanding of all of the mechanisms involved in the tissue response to implanted electrode arrays.
Supplementary Material
Acknowledgements
This work was supported by grants from the National Institutes of Health (NIH NIBIB 1R01EB009103-01, NIH NIBIB 2R01EB000856-06, and NIH NIBIB 1T32EB011434-01A1) and the Defense Advanced Research Projects Agency (DARPA RCI #N66001-12-C-4025, DARPA HIST #N66001-11-1-4013).
References
- 1.Seymour JP, Kipke DR. Neural probe design for reduced tissue encapsulation in CNS. Biomaterials. 2007 Sep;28(25):3594–3607. doi: 10.1016/j.biomaterials.2007.03.024. [DOI] [PubMed] [Google Scholar]
- 2.Kim Y-T, Bridge MJ, Tresco PA. The influence of the foreign body response evoked by fibroblast transplantation on soluble factor diffusion in surrounding brain tissue. J Controlled Release. 2007 Apr 23;118(3):340–347. doi: 10.1016/j.jconrel.2007.01.002. [DOI] [PubMed] [Google Scholar]
- 3.Schwartz AB, Cui XT, Weber DJ, Moran DW. Brain-Controlled Interfaces: Movement Restoration with Neural Prosthetics. Neuron. 2006 Oct 5;52(1):205–220. doi: 10.1016/j.neuron.2006.09.019. [DOI] [PubMed] [Google Scholar]
- 4.Thongpang S, Richner TJ, Brodnick SK, Schendel A, Kim J, Wilson J, et al. A micro-electrocorticography platform and deployment strategies for chronic BCI applications. Clin EEG Neurosci Off J EEG Clin Neurosci Soc ENCS. 2011;42(4):259. doi: 10.1177/155005941104200412. [DOI] [PMC free article] [PubMed] [Google Scholar]
- 5.Ledochowitsch P, Félus RJ, Gibboni RR, Miyakawa A, Bao S, Maharbiz MM. Fabrication and testing of a large area, high density, parylene MEMS µECoG array; 2011 IEEE 24th International Conference on Micro Electro Mechanical Systems (MEMS); 2011. p. 1031.p. 1034. [Google Scholar]
- 6.Henle C, Raab M, Cordeiro J, Doostkam S, Schulze-Bonhage A, Stieglitz T, et al. First long term in vivo study on subdurally implanted Micro-ECoG electrodes, manufactured with a novel laser technology. Biomed Microdevices. 2011;13(1):59–68. doi: 10.1007/s10544-010-9471-9. [DOI] [PubMed] [Google Scholar]
- 7.Viventi J, Kim D-H, Vigeland L, Frechette ES, Blanco JA, Kim Y-S, et al. Flexible, foldable, actively multiplexed, high-density electrode array for mapping brain activity in vivo. Nat Neurosci. 2011;14(12):1599–1605. doi: 10.1038/nn.2973. [DOI] [PMC free article] [PubMed] [Google Scholar]
- 8.Williams JJ, Rouse AG, Thongpang S, Williams JC, Moran DW. Differentiating closed-loop cortical intention from rest: building an asynchronous electrocorticographic BCI. J Neural Eng. 2013 Aug 1;10(4):046001. doi: 10.1088/1741-2560/10/4/046001. [DOI] [PubMed] [Google Scholar]
- 9.Richner TJ, Thongpang S, Brodnick SK, Schendel AA, Falk RW, Krugner-Higby LA, et al. Optogenetic micro-electrocorticography for modulating and localizing cerebral cortex activity. J Neural Eng. 2014 Feb 1;11(1):016010. doi: 10.1088/1741-2560/11/1/016010. [DOI] [PMC free article] [PubMed] [Google Scholar]
- 10.Schendel AA, Thongpang S, Brodnick SK, Richner TJ, Lindevig BDB, Krugner-Higby L, et al. A cranial window imaging method for monitoring vascular growth around chronically implanted micro-ECoG devices. J Neurosci Methods. 2013 Aug 15;218(1):121–130. doi: 10.1016/j.jneumeth.2013.06.001. [DOI] [PMC free article] [PubMed] [Google Scholar]
- 11.Kim DH, Viventi J, Amsden JJ, Xiao J, Vigeland L, Kim YS, et al. Dissolvable films of silk fibroin for ultrathin conformal bio-integrated electronics. Nat Mater. 2010;9(6):511–517. doi: 10.1038/nmat2745. [DOI] [PMC free article] [PubMed] [Google Scholar]
- 12.Huang D, Swanson EA, Lin CP, Schuman JS, Stinson WG, Chang W, et al. Optical coherence tomography. Science. 1991 Nov 22;254(5035):1178–1181. doi: 10.1126/science.1957169. [DOI] [PMC free article] [PubMed] [Google Scholar]
- 13.Campagnola PJ, Millard AC, Terasaki M, Hoppe PE, Malone CJ, Mohler WA. Three-dimensional high-resolution second-harmonic generation imaging of endogenous structural proteins in biological tissues. Biophys J. 2002;82(1):493–508. doi: 10.1016/S0006-3495(02)75414-3. [DOI] [PMC free article] [PubMed] [Google Scholar]
- 14.Williams JC, Hippensteel JA, Dilgen J, Shain W, Kipke DR. Complex impedance spectroscopy for monitoring tissue responses to inserted neural implants. J Neural Eng. 2007;4:410. doi: 10.1088/1741-2560/4/4/007. [DOI] [PubMed] [Google Scholar]
- 15.Li Y, Song Y, Zhao L, Gaidosh G, Laties AM, Wen R. Direct labeling and visualization of blood vessels with lipophilic carbocyanine dye DiI. Nat Protoc. 2008;3(11):1703–1708. doi: 10.1038/nprot.2008.172. [DOI] [PMC free article] [PubMed] [Google Scholar]
- 16.Provenzano PP, Eliceiri KW, Keely PJ. Multiphoton microscopy and fluorescence lifetime imaging microscopy (FLIM) to monitor metastasis and the tumor microenvironment. Clin Exp Metastasis. 2009 Apr 1;26(4):357–370. doi: 10.1007/s10585-008-9204-0. [DOI] [PubMed] [Google Scholar]
- 17.Bailey AJ, Bazin S, Sims TJ, Le Lous M, Nicoletis C, Delaunay A. Characterization of the collagen of human hypertrophic and normal scars. Biochim Biophys Acta BBA - Protein Struct. 1975 Oct 20;405(2):412–421. doi: 10.1016/0005-2795(75)90106-3. [DOI] [PubMed] [Google Scholar]
- 18.Van Zuijlen PPM, Ruurda JJB, van Veen HA, van Marle J, van Trier AJM, Groenevelt F, et al. Collagen morphology in human skin and scar tissue: no adaptations in response to mechanical loading at joints. Burns. 2003 Aug;29(5):423–431. doi: 10.1016/s0305-4179(03)00052-4. [DOI] [PubMed] [Google Scholar]
- 19.Risling M, Fried K, Lindå H, Carlstedt T, Cullheim S. Regrowth of motor axons following spinal cord lesions: Distribution of laminin and collagen in the CNS scar tissue. Brain Res Bull. 1993;30(3–4):405–414. doi: 10.1016/0361-9230(93)90272-d. [DOI] [PubMed] [Google Scholar]
- 20.Sun Y, Weber KT. Infarct scar: a dynamic tissue. Cardiovasc Res. 2000 May 1;46(2):250–256. doi: 10.1016/s0008-6363(00)00032-8. [DOI] [PubMed] [Google Scholar]
- 21.Kim Y-T, Hitchcock RW, Bridge MJ, Tresco PA. Chronic response of adult rat brain tissue to implants anchored to the skull. Biomaterials. 2004 May;25(12):2229–2237. doi: 10.1016/j.biomaterials.2003.09.010. [DOI] [PubMed] [Google Scholar]
- 22.Jimenz Hamann MC, Sacks MS, Malinin TI. Quantification of the collagen fibre architecture of human cranial dura mater. J Anat. 1998 Jan;192(Pt 1):99–106. doi: 10.1046/j.1469-7580.1998.19210099.x. [DOI] [PMC free article] [PubMed] [Google Scholar]
- 23.Protasoni M, Sangiorgi S, Cividini A, Culuvaris GT, Tomei G, Dell’Orbo C, et al. The collagenic architecture of human dura mater. J Neurosurg. 2011 Jun;114(6):1723–1730. doi: 10.3171/2010.12.JNS101732. [DOI] [PubMed] [Google Scholar]
- 24.Sajanti J, Björkstrand A-S, Finnilä S, Heikkinen E, Peltonen J, Majamaa K. Increase of collagen synthesis and deposition in the arachnoid and the dura following subarachnoid hemorrhage in the rat. Biochim Biophys Acta BBA - Mol Basis Dis. 1999 Aug 30;1454(3):209–216. doi: 10.1016/s0925-4439(99)00016-2. [DOI] [PubMed] [Google Scholar]
- 25.Tremblay M-È, Majewska AK. A role for microglia in synaptic plasticity? Commun Integr Biol. 2011 Mar 1;4(2):220–222. doi: 10.4161/cib.4.2.14506. [DOI] [PMC free article] [PubMed] [Google Scholar]
- 26.Potter SM, Wang C-M, Garrity PA, Fraser SE. Intravital imaging of green fluorescent protein using two-photon laser-scanning microscopy. Gene. 1996;173(1):25–31. doi: 10.1016/0378-1119(95)00681-8. [DOI] [PubMed] [Google Scholar]
- 27.Tozer GM, Ameer-Beg SM, Baker J, Barber PR, Hill SA, Hodgkiss RJ, et al. Intravital imaging of tumour vascular networks using multi-photon fluorescence microscopy. Adv Drug Deliv Rev. 2005 Jan 2;57(1):135–152. doi: 10.1016/j.addr.2004.07.015. [DOI] [PubMed] [Google Scholar]
- 28.Daniels JT, Schultz GS, Blalock TD, Garrett Q, Grotendorst GR, Dean NM, et al. Mediation of Transforming Growth Factor-α1-Stimulated Matrix Contraction by Fibroblasts: A Role for Connective Tissue Growth Factor in Contractile Scarring. Am J Pathol. 2003 Nov;163(5):2043–2052. doi: 10.1016/s0002-9440(10)63562-6. [DOI] [PMC free article] [PubMed] [Google Scholar]
- 29.Hida K, Yamaguchi S, Seki T, Yano S, Akino M, Terasaka S, et al. Nonsuture dural repair using polyglycolic acid mesh and fibrin glue: clinical application to spinal surgery. Surg Neurol. 2006;65(2):136–142. doi: 10.1016/j.surneu.2005.07.059. [DOI] [PubMed] [Google Scholar]
- 30.Narotam PK, José S, Nathoo N, Taylon C, Vora Y. Collagen matrix (DuraGen) in dural repair: analysis of a new modified technique. Spine. 2004;29(24):2861–2867. doi: 10.1097/01.brs.0000148049.69541.ad. [DOI] [PubMed] [Google Scholar]
- 31.Warren WL, Medary MB, Dureza CD, Bellotte JB, Flannagan PP, Oh MY, et al. Dural repair using acellular human dermis: experience with 200 cases: technique assessment. Neurosurgery. 2000;46(6):1391–1396. doi: 10.1097/00006123-200006000-00020. [DOI] [PubMed] [Google Scholar]
- 32.Bundy DT, Zellmer E, Gaona CM, Sharma M, Szrama N, Hacker C, et al. Characterization of the effects of the human dura on macro- and micro-electrocorticographic recordings. J Neural Eng. 2014 Feb 1;11(1):016006. doi: 10.1088/1741-2560/11/1/016006. [DOI] [PMC free article] [PubMed] [Google Scholar]
- 33.Tearney GJ, Brezinski ME, Southern JF, Bouma BE, Hee MR, Fujimoto JG. Determination of the refractive index of highly scattering human tissue by optical coherence tomography. Opt Lett. 1995;20(21):2258–2260. doi: 10.1364/ol.20.002258. [DOI] [PubMed] [Google Scholar]
Associated Data
This section collects any data citations, data availability statements, or supplementary materials included in this article.


