

Abstract
Background
The stability of the human immunodeficiency virus type 1 (HIV-1) reservoir and the contribution of cellular proliferation to the maintenance of the reservoir during treatment are uncertain. Therefore, we conducted a longitudinal analysis of HIV-1 in T-cell subsets in different tissue compartments from subjects receiving effective antiretroviral therapy (ART).
Methods
Using single-proviral sequencing, we isolated intracellular HIV-1 genomes derived from defined subsets of CD4+ T cells from peripheral blood, gut-associated lymphoid tissue and lymph node tissue specimens from 8 subjects with virologic suppression during long-term ART at 2 time points (time points 1 and 2) separated by 7–9 months.
Results
DNA integrant frequencies were stable over time (<4-fold difference) and highest in memory T cells. Phylogenetic analyses showed that subjects treated during chronic infection contained viral populations with up to 73% identical sequence expansions, only 3 of which were observed in specimens obtained before therapy. At time points 1 and 2, such clonally expanded populations were found predominantly in effector memory T cells from peripheral blood and lymph node tissue specimens.
Conclusions
Memory T cells maintained a relatively constant HIV-1 DNA integrant pool that was genetically stable during long-term effective ART. These integrants appear to be maintained by cellular proliferation and longevity of infected cells, rather than by ongoing viral replication.
Keywords: HIV-1 persistence, HIV-1 reservoir, memory T cells
The mechanism by which human immunodeficiency virus (HIV) persists during antiretroviral therapy (ART) is the focus of intense investigation. Although low-level replication of HIV might contribute to persistence in some individuals [1, 2], the remarkable stability in viral structure and lack of viral divergence over time [3] argue that HIV persists largely in a nonreplicating latent state in its preferred target cells, which include long-lived memory CD4+ T cells and perhaps other cells. The cells containing integrated HIV type 1 (HIV-1) genomes are presumably maintained by cellular proliferation [4, 5], but how this affects the size and distribution of the DNA integrant pool is not known.
To more clearly define the stability of the HIV-1 DNA integrant pool during effective ART and to explore the role of T-cell proliferation in maintaining this stable pool, we conducted a longitudinal analysis of HIV-1 in specific T-cell subsets from peripheral blood, gut-associated lymphoid tissue (GALT), and lymph node tissue specimens from patients receiving long-term suppressive therapy. We investigated the stability of the HIV-1 DNA integrant pool through the analysis of integrant frequencies over time. We also examined the distribution of clonal HIV-1 intracellular sequences in the different memory T-cell subsets to investigate the role of T-cell proliferation as a cause of persistence.
METHODS
Cohort
Paired peripheral blood and GALT samples from 8 individuals infected with HIV-1 subtype B who were receiving long-term suppressive therapy (duration, 5–13 years) were analyzed at 2 time points (time point 1 and time point 2, separated by 7–9 months). These HIV-1–infected individuals are part of the Options Cohort, an ongoing longitudinal observational cohort at University of California–San Francisco in which persons are followed beginning ≤6 months after HIV acquisition. Samples were collected from 5 subjects who initiated therapy 1–3 months after infection onset (acute/early infection group; subjects 1–5) and 3 who initiated therapy >1 year after infection onset (chronic infection group; subjects 6–8); the therapeutic regimen is available elsewhere [3]. All subjects had undetectable viremia (ie, <40–75 HIV RNA copies/mL) for at least 3 years after the initiation of therapy. At the second sample collection time point, CD4+ T-cell counts ranged from 500 to 1500 cells/µL. We recently completed and published an in-depth phylogenetic study of the HIV-1 DNA genomes derived from the cells collected during the first time point [3]. Here, we report data on the change in the pool of HIV-1–integrated memory T cells over time. In addition, we obtained lymph node tissue specimens from 2 of the subjects (subjects 4 and 8).
Informed consent was obtained from all 8 subjects. The study was approved by the institutional review boards at University of California–San Francisco, the Karolinska Institutet, and the Western Sydney Health Department for the Westmead Millennium Institute.
Single-Proviral Sequencing
To quantify and genetically characterize HIV-1 populations in the cells isolated from peripheral blood, GALT, and lymph node tissue specimens, we used the single-proviral sequencing assay [3, 6]. Cells were sorted using fluorescence-activated cell sorting. The sorting strategy was slightly modified between the 2 time points. At the first time point, we sorted 4 cell types: naive T cells, central and transitional memory T cells, effector memory T cells, and myeloid cells (details of this sorting strategy are available elsewhere [3]). At the second time point, we sorted 5 cell types, using more-specific cellular phenotypes, from peripheral blood specimens: naive T cells, central memory T cells, transitional memory T cells, effector memory T cells, and myeloid cells. For GALT specimens, 4 cell types were sorted: naive T cells, central and transitional memory T cells, effector memory T cells, and myeloid cells. We also sorted 4 T-cell types from lymph node tissue specimens: naive T cells, central memory T cells, transitional memory T cells, and effector memory T cells (subjects 4 and 8). Details about the sorting strategy for specimens from time point 2 are available in the Supplementary Materials. The sorted cells are lysed and serially diluted (1:3 to 1:729), and single HIV-1 molecules are amplified by polymerase chain reaction (PCR), using primers flanking the gag-pol region (p6 through nucleotides 1–900 of the gene encoding reverse transcriptase; 1110 base pairs) and the env region (V1–V3; 813 base pairs). PCR amplification and sequencing of the DNA in each well allowed enumeration and analysis of the genetic relationship of viral DNA molecules in each infected cell type. Intracellular HIV-1 DNA sequences were compared to plasma-derived HIV-1 RNA sequences obtained by single-genome sequencing of plasma samples collected before initiation of ART and during therapy at both time points [3, 7–9]. Sequences were submitted to GenBank (ACCN: KP065816–7089, KP113063–482, KP152533–80, and KP152658–53066).
Statistical Methods
We estimated the HIV-1 DNA integrant frequency in each cell type by using a maximum likelihood statistical analysis as previously described [3]. Detailed statistical methods and calculations are provided in the Supplementary Materials.
Phylogenetic Analyses
Intracellular and extracellular HIV-1 populations were analyzed using the same methods as in our recent study [3]. Briefly, G-A hypermutated sequences (identified by the Hypermut tool; available at: http://www.hiv.lanl.gov) and sequences with stop codons were excluded. The remaining sequences were used to construct maximum likelihood phylogenetic trees, using MEGA5.1 (available at: http://www.megasoftware.net/). The evolutionary divergence and evolutionary rate between the sample obtained before therapy initiation and the sample obtained during time point 2 and between the sample obtained at time point 1 and the sample obtained at time point 2 were estimated as previously described [3]. Briefly, the correlation of genetic divergence and time was investigated using linear regression analysis (root-to-tip analysis as implemented in Path-O-Gen [available at: http://tree.bio.ed.ac.uk/]). A strong correlation indicates that viral evolution has occurred between the 2 sample collection time points. To estimate the rate of evolutionary change, we performed a Bayesian Markov chain Monte Carlo analysis implemented in BEAST [10].
RESULTS
Similar HIV-1 DNA Integrant Frequencies and Stable HIV-1 Genetic Populations Between Time Points 1 and 2 in Cells From Subjects Receiving Long-Term ART
The stability of intracellular HIV-1 DNA in memory CD4+ T cells during effective long-term suppressive therapy is unclear. To investigate this further in peripheral blood, we sorted 640 000–18 000 000 T cells per subject on the basis of their specific CD4+ T-cell phenotype (Supplementary Materials). The sorted cells were analyzed using single-proviral sequencing and maximum likelihood statistical analyses to estimate the integrant frequency in each cell type. Integrant frequencies at time point 1 were previously published [3]. At the time point 2, we found that the mean HIV-1 integrant frequencies for central memory T cells, transitional memory T cells, and effector memory T cells were 0.001%, 0.003%, and 0.006%, respectively, in subjects treated during acute/early infection (Table 1). The combined integrant frequencies of central and transitional memory cells at time point 1, compared with the weighted average of the frequencies in central memory T cells and transitional memory T cells at time point 2, showed a 2-fold decrease (P = .27, by the likelihood ratio test; Supplementary Table 1). The integrant frequency of effector memory T cells decreased 1.6-fold between time points 1 and 2 (P = .065, by the likelihood ratio test; Supplementary Table 1).
Table 1.
Human Immunodeficiency Virus Type 1 DNA Integrant Frequencies in Peripheral Blood and Lymph Node Tissue (LNT) Samples Collected at Time Point 2, by Cellular Phenotype
| Time of Treatment Initiation, Subject, Compartment | Estimated Integrant Frequency, %a (95% CI) |
||||
|---|---|---|---|---|---|
| TNA, CD45RO−CCR7+CD27+CD57− | TCM, CD45RO+CCR7+CD27+ | TTM, CD45RO+CCR7−CD27+ | TEM, CD45RO+CCR7−CD27− | Myeloid Cells, CD3−CD14+ | |
| During acute/early infection | |||||
| Subject 1 | |||||
| Blood | 0.00073 (.00052–.00102) | 0.024 (.018–.031) | 0.028 (.021–.037) | 0.18 (.14–.23) | 0b (.000002–.000118) |
| Subject 2 | |||||
| Blood | 0.000067 (.000025–.000178) | 0.00092 (.00058–.00144) | 0.012 (.008–.016) | 0.011 (.008–.015) | 0 (0–.00005 |
| Subject 3 | |||||
| Blood | 0.000017 (.000002–.000118) | 0.0016 (.0012–.0021) | 0.0083 (.0057–.0122) | 0.0038 (.0028–.0052) | 0 (0–.00005) |
| Subject 4 | |||||
| Blood | 0.000015 (.000002–.000109) | 0.000050 (.000016–.000155) | 0.00028 (.00017–.00046) | 0.00087 (.00050–.00149) | 0 (0–.00004) |
| LNT | 0 (0–.0004) | 0 (0–.0004) | 0.00086 (.00049–.00152) | 0.00071 (.00018–.00283) | NA |
| Subject 5 | |||||
| Blood | 0.0012 (.0007–.0020) | 0.034 (.024–.047) | 0.062 (.043–.089) | 0.056 (.039–.079) | 0 (0–.00005) |
| Weighted meanc | 0.00022 (.00017–.00029) | 0.0014 (.0012–.0016) | 0.0025 (.0021–.0029) | 0.0063 (.0054–.0072) | 0d (.0000002–.000014) |
| During chronic infection | |||||
| Subject 6 | |||||
| Blood | 0.088 (.072–.108) | 0.16 (.12–.21) | 0.092 (.067–.127) | 0.040 (.027–.057) | 0 (0–.00005) |
| Subject 7 | |||||
| Blood | 0.0054 (.0037–.0077) | 0.024 (.018–.031) | 0.15 (.11–.21) | 0.13 (.10–.16) | 0 (0–.00005) |
| Subject 8 | |||||
| Blood | 0.0014 (.0010–.0019) | 0.030 (.021–.042) | 0.053 (.039–.072) | 0.089 (.065–.120) | 0e (.000002–.000118) |
| LNT | 0.0019 (.0014–.0026) | 0.025 (.019–.033) | 0.025 (.018–.035) | 0.076 (.057–.100) | NA |
| Weighted meanc | 0.0050 (.0043–.0059) | 0.036 (.030–.043) | 0.080 (.066–.096) | 0.082 (.070–.097) | 0f (.0000003–.000024) |
See “Methods” section for the definition of time point 2.
Abbreviations: CI, confidence interval; NA, not available; TCM, central memory CD4+ T cells; TEM, effector memory CD4+ T cells; TNA, naive CD4+ T cells; TTM, transitional memory CD4+ T cells.
a One cannot rule out the possibility of low but nonzero integrant rates in cases where estimates were 0, as shown by the upper confidence bounds.
b An integrant frequency of 0.000017 was found in myeloid lysate with T-cell receptors present.
c Data were calculated with weighting for each patient proportional to the effective number of cells assayed in blood specimens.
d An integrant frequency of 0.0000032 was found in myeloid lysate with T-cell receptors present.
e An integrant frequency of 0.000017 was found in myeloid lysate with T-cell receptors present.
f An integrant frequency of 0.0000056 was found in myeloid lysate with T-cell receptors present.
For subjects who initiated therapy during chronic infection, the mean HIV-1 DNA integrant frequencies at time point 2 of the 3 memory T-cell subsets (central memory T cells, transitional memory T cells, and effector memory T cells) were 0.04%, 0.08%, and 0.08%, respectively (Table 1). The integrant frequencies of these cells changed <2-fold between time points 1 and 2 (Supplementary Table 1). The integrant frequencies for naive T cells isolated from peripheral blood ranged from 0.00002% to 0.001% in subjects treated during acute/early infection and from 0.001% to 0.09% in subjects treated during chronic infection (Table 1). The comparison of the frequencies for naive T cells between time points 1 and 2 revealed a 4-fold decrease in subjects 1–5 and essentially no change in subjects 6–8 (Supplementary Table 1).
We sorted 4 cell types from GALT specimens for all subjects except subject 7. For central and transitional memory T cells, we analyzed 8000–79 000 cells and found the mean HIV-1 integrant frequencies to be 0.01% and 0.02% (Supplementary Table 2) in subjects who initiated therapy during acute/early and chronic infection, respectively. For effector memory T cells, the mean integrant frequencies were 0.03% and 0.04% (10 000–52 000 cells were analyzed) in subjects treated during acute/early and chronic infection, respectively. Comparison of the DNA integrant frequencies for central and transitional memory T cells and effector memory T cells within GALT specimens between time points 1 and 2 revealed similar integrant frequencies in subjects 1–5 and a 3-fold decrease in subjects 6 and 8 for these cell types (Supplementary Table 1).
In addition, we analyzed 6 000 000–7 000 000 myeloid cells from peripheral blood specimens and found a DNA integrant frequency of 0.00002% in subjects 1 and 8 (Table 1). From GALT specimens, we analyzed 3700–91 000 myeloid cells and detected an integrant frequency of 0.003% in subject 6 (Supplementary Table 2). However, as in our previous study [3], we identified T-cell receptors in all myeloid cell lysates and therefore cannot rule out the possibility that the HIV DNA came from infected T cells.
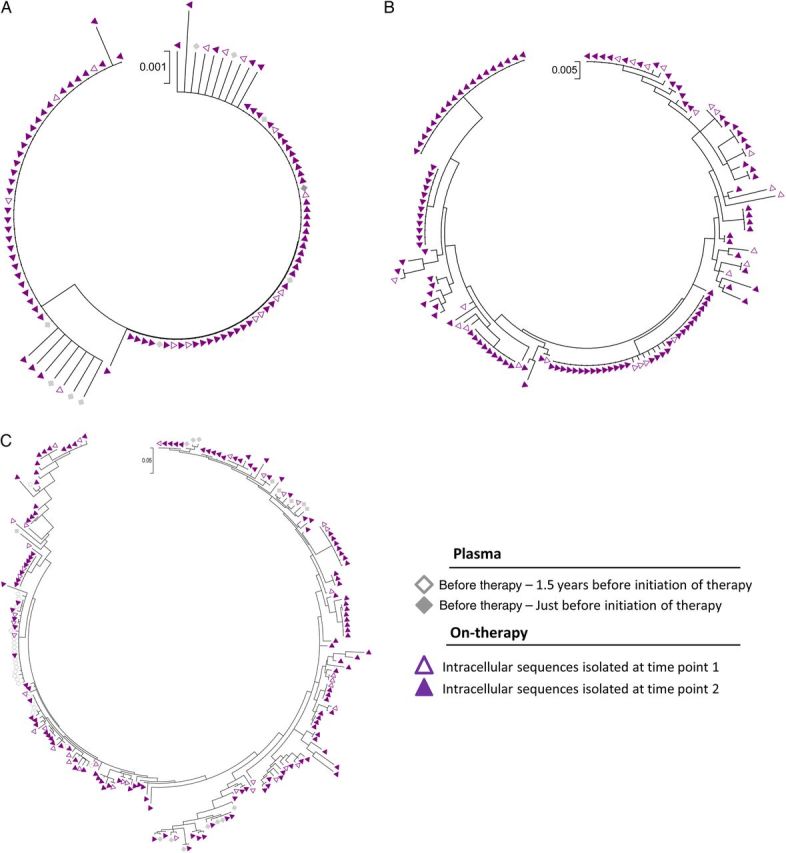
To evaluate the stability of the HIV-1 DNA integrant pool during long-term suppressive therapy, we constructed phylogenetic trees for each subject, including HIV-1 DNA sequences from the different cell types isolated at time points 1 and 2 (Figures 1 and 2). We found that for all subjects, HIV-1 sequences from time points 1 and 2 intermingled with sequences isolated from plasma specimens obtained before therapy. Regression analysis revealed no correlation between genetic divergence and time for the gag-pol and env sequences isolated from samples obtained before therapy and at time point 2 (R2 = 0.08–0.0008; Supplementary Table 3). In addition, the low evolutionary rates (estimated as the number of nucleotide substitutions per site per year, using a molecular clock approach that accommodates sampling times as calibration information in a molecular clock [10]) for the gag-pol sequences between samples obtained before therapy and those obtained at time point 2 and between samples collected at time point 1 and those collected at time point 2 were found to be similar (Supplementary Table 3).
Figure 1.

Phylogenetic analysis of viral sequences (gag-pol) from plasma specimens isolated before the initiation of antiretroviral therapy and cells isolated from time points 1 and 2. Maximum likelihood trees of sequences (gag-pol) from plasma specimens isolated 1.5 years before initiation of therapy, plasma specimens isolated just before initiation of therapy, plasma specimens obtained during therapy, intracellular sequences isolated at time point 1, and intracellular sequences isolated at time point 2 from a subset of subjects initiating antiviral therapy during acute/early human immunodeficiency virus type 1 (HIV-1) infection (subject 4 [A] and subject 5 [B]) and during chronic HIV-1 infection (subject 7 [C] and subject 8 [D]). Trees representing the sequences isolated from subjects 1, 2, 3, and 6 are not shown but are available upon request.
Figure 2.
Phylogenetic analysis of viral sequences (env) from plasma specimens isolated before the initiation of antiretroviral therapy and cells isolated at time points 1 and 2. Maximum likelihood trees of sequences (env) from plasma specimens isolated 1.5 years before initiation of therapy, plasma specimens isolated just before initiation of therapy, intracellular sequences isolated at time point 1, and intracellular sequences isolated at time point 2 from a subset of subjects initiating antiviral therapy during acute/early human immunodeficiency virus type 1 (HIV-1) infection (subject 5; A) and during chronic HIV-1 infection (subject 7 [B] and subject 8 [C]).
Similar HIV-1 DNA Integrant Frequency in Lymph Node Tissue and Peripheral Blood Specimens
Although cells traffic between the lymph node and peripheral blood, it is unknown whether the HIV-1 integrant frequencies are similar in these 2 compartments during long-term ART treatment. Therefore, we compared the HIV-1 integrant frequencies of cells from peripheral blood and lymph node tissue specimens. Lymph node tissue specimens were sorted from 1 subject treated during acute/early infection (subject 4) and 1 subject treated during chronic infection (subject 8). We sorted 283 000–3 816 600 cells from 4 T-cell subsets (naive T cells, central memory T cells, transitional memory T cells, and effector memory T cells). For subject 4, HIV-1 DNA was isolated from transitional memory T cells and effector memory T cells, and the integrant frequencies for these 2 subsets were 0.0009% and 0.0007%, respectively (Table 1). For subject 8, the integrant frequencies in central memory T cells, transitional memory T cells, and effector memory T cells were 0.03%, 0.03%, and 0.08%, respectively. When comparing the integrant frequencies from lymph node tissue specimens to their frequencies from peripheral blood specimens, all 4 cell subsets showed a ≤1.5-fold difference for both subjects.
Role of Cellular Proliferation, Differentiation, and Expansion in Maintaining Persistent HIV-1 During Long-Term ART
To evaluate the role of cellular proliferation as a cause of HIV-1 persistence, we analyzed samples obtained at time points 1 and 2 from subjects who initiated therapy during chronic infection. For subjects 7 and 8, we also analyzed the env region. Expansions of identical sequences were determined by phylogenetic analysis as ≥2 genetically identical sequences, which we refer to below as “clonal.” These were compared to plasma-derived sequences obtained before therapy. Phylogenetic analyses showed expansions of identical HIV-1 sequences in all subjects treated during chronic infection: 28%–73% of all intracellular sequences were clonal and represented 11–27 expansions of identical sequences from both time points.
For subject 6, we identified 19 identical sequence expansions (181 intracellular sequences were analyzed), 2 of which included sequences identified in plasma specimens obtained before therapy (Figure 3A). At time point 2, the percentage of clonal sequences located in effector memory T cells increased from 29% to 62% (Table 2), and the odds of a viral sequence being clonal in effector memory T cells were 11-fold (P = .001) and 20-fold (P < .001) higher than if the viral sequence came from central memory T cells and transitional memory T cells, respectively.
Figure 3.
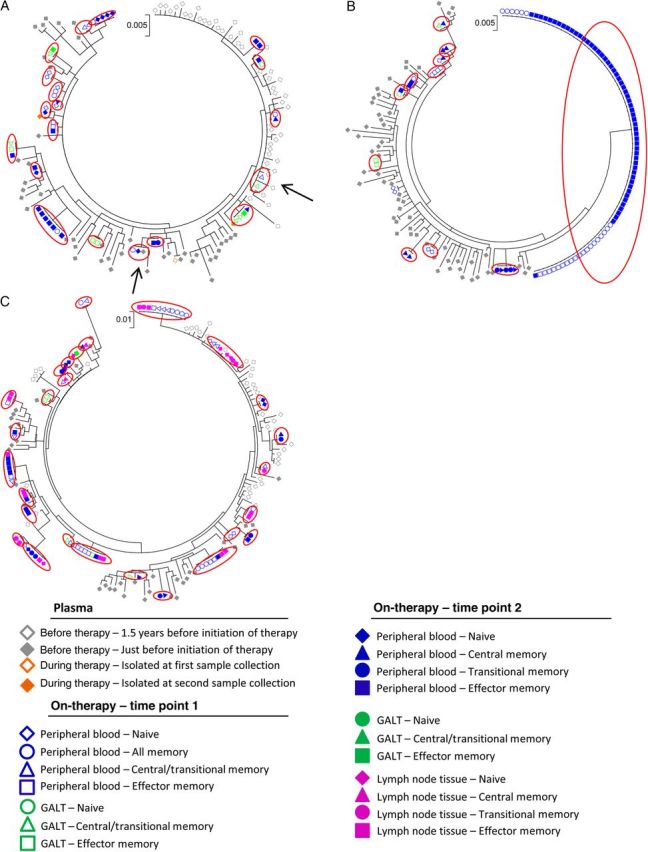
Phylogenetic analysis of identical viral sequences (gag-pol) from plasma specimens isolated before the initiation of antiretroviral therapy, plasma specimens obtained during therapy and cells isolated from time points 1 and 2 after several years of suppressive antiretroviral therapy. Maximum likelihood trees of sequences (gag-pol) from plasma specimens (isolated 1.5 years before initiation of therapy, just before initiation of therapy, and during therapy), peripheral blood specimens (all memory T cells, central/transitional memory T cells, central memory T cells, transitional memory T cells, and effector memory T cells), gut-associated lymphoid tissue (GALT) specimens (naive T cells, central/transitional memory T cells, and effector memory T cells), and lymph node tissue specimens (naive T cells, central memory T cells, transitional memory T cells, and effector memory T cells) from a subset of subjects initiating antiviral therapy during chronic human immunodeficiency virus type 1 infection (subject 6 [A], subject 7 [B], and subject 8 [C]). Red circles indicate identical sequences expansions (defined as ≥2 genetically identical sequences) isolated from different cells. Arrows indicate identical sequence expansions, which included sequences derived from plasma specimens obtained before therapy.
Table 2.
Estimated Rate of Identical Sequences In Peripheral Blood, Gut-Associated Lymphoid Tissue (GALT), and Lymph Node (LN) Tissue Specimens Obtained at Time Points 1 and 2 in Subjects Treated During Chronic Infection
| Subject, Cellular Phenotype, Region | Blood, Estimated Rate, % (95% CI) |
GALT, Estimated Rate, % (95% CI) |
LN Tissue, Estimated Rate, % (95% CI) |
||
|---|---|---|---|---|---|
| Time Point 1 | Time Point 2 | Time Point 1 | Time Point 2 | Time Point 2 | |
| Subject 6 | |||||
| TNA | |||||
| gag-pol | 31 (12–55) | 33 (16–55) | 0 (0–63) | 0 (0–95) | NA |
| TCTM | |||||
| gag-pol | 25 (8.5–49) | NA | 27 (9.2–52) | 0 (0–95) | NA |
| TCM | |||||
| gag-pol | NA | 16 (4.2–36) | NA | NA | NA |
| TTM | |||||
| gag-pol | NA | 6.3 (.4–25) | NA | NA | NA |
| TEM | |||||
| gag-pol | 29 (9.9–55) | 62 (41–80) | 15 (2.7–40) | 67 (28–94) | NA |
| Subject 7 | |||||
| TNA | |||||
| gag-pol | 36 (15–62) | 0 (0–16) | NA | NA | NA |
| TCTM | |||||
| gag-pol | 0 (0–15.3) | NA | 50 (3.8–96) | NA | NA |
| Env | 38 (11–71) | NA | NA | NA | NA |
| TCM | |||||
| gag-pol | NA | 57 (32–80) | NA | NA | NA |
| env | NA | 33 (10–66) | NA | NA | NA |
| TTM | |||||
| gag-pol | NA | 12 (3.1–28) | NA | NA | NA |
| env | NA | 64 (35–87) | NA | NA | NA |
| TEM | |||||
| gag-pol | 82 (60–95) | 92 (84–97) | 16 (4.2–36) | NA | NA |
| env | 40 (18–65) | 85 (78–92) | NA | NA | NA |
| Subject 8 | |||||
| TNA | |||||
| gag-pol | 21 (7.1–42) | 22 (8.4–41) | NA | NA | 17 (5.5–35) |
| TCTM | |||||
| gag-pol | 61 (38–81) | NA | 29 (5.4–65) | 0 (0–63) | NA |
| env | 20 (6.7–41) | NA | NA | NA | NA |
| TCM | |||||
| gag-pol | NA | 20 (6.7–41) | NA | NA | 12 (3.1–28) |
| env | NA | 23 (9.9–41) | NA | NA | 17 (4.4–38) |
| TTM | |||||
| gag-pol | NA | 35 (17–57) | NA | NA | 26 (11–46) |
| env | NA | 44 (23–67) | NA | NA | 28 (13–47) |
| TEM | |||||
| gag-pol | 67 (42–87) | 79 (53–94) | 18 (4.7–40) | 17 (1.0–55) | 61 (41–79) |
| env | 50 (29–71) | 83 (65–95) | NA | NA | 63 (42–80) |
See “Methods” section for the definitions of time points 1 and 2.
Abbreviations: CI, confidence interval; NA, not available; TCM, central memory CD4+ T cells; TCTM, central/transitional memory CD4+ T cells; TEM, effector memory CD4+ T cells; TNA, naive CD4+ T cells; TTM, transitional memory CD4+ T cells.
For subject 7, 11 identical sequence expansions were identified (213 intracellular sequences were analyzed; Figure 3B), none of which included sequences identified in plasma specimens obtained before therapy. For this subject, 52% of all intracellular sequences were clonal and were predominantly found in effector memory T cells. As previously reported [3], subject 7 had 1 unique clonal population containing a large 380–base pair deletion (base pairs 1177–2236 in the HXB2 genome) that essentially eliminated the protease gene, indicating that this population is not replication competent. The percentage of clonal sequences isolated from effector memory T cells increased from 82% to 92% (Table 2) during the 2 sample collections, and the odds of a viral sequence being a clone in effector memory T cells, compared with central memory T cells and transitional memory T cells, at time point 2 were 9-fold (P = .002) and 86-fold (P < .0001), respectively. Analyses of the env region (Figure 4A) for this subject showed that 73% of the 139 sequences analyzed were clonal populations. A total of 16 identical sequence expansions were identified, which were predominantly found in effector memory T cells and transitional memory T cells during time point 2.
Figure 4.

Phylogenetic analysis of identical viral sequences (env) from plasma specimens isolated before the initiation of antiretroviral therapy and cells isolated from time points 1 and 2 after several years of suppressive antiretroviral therapy. Maximum likelihood trees of sequences (env) from plasma specimens (isolated 1.5 years before initiation of therapy and just before initiation of therapy), peripheral blood specimens (naive T cells, all memory T cells, central/transitional memory T cells, central memory T cells, transitional memory T cells, and effector memory T cells), gut-associated lymphoid tissue (GALT) specimens (naive T cells, central/transitional memory T cells, and effector memory T cells), and lymph node tissue specimens from time point 2 (naive T cells, central memory T cells, transitional memory T cells, and effector memory T cells) from a subset of subjects initiating antiviral therapy during chronic human immunodeficiency virus type 1 infection (subject 7 [A] and subject 8 [B]). Red circles indicate identical sequences expansions (defined as ≥2 genetically identical sequences) isolated from different cells. Arrows indicate identical sequence expansions, which included sequences derived from specimens obtained before therapy.
For subject 8, 32% of the intracellular sequences analyzed (n = 278; Figure 3C) were clonal and included 27 identical sequence expansions, one of which included sequences identified in plasma specimens obtained before therapy. Consistent with our findings for subjects 6 and 7, these clonal sequences were predominantly found in effector memory T cells (67% and 79% at time points 1 and 2, respectively; Table 2). This was also true for the env region (Figure 4B), which had clonal sequences predominantly in effector memory T cells at time points 1 and (50% and 83%, respectively; Table 2). At time point 2, cells isolated from lymph node tissue were analyzed for subject 8, and 61% and 63% (Table 2) of the sequences in the gag-pol and env regions, respectively, from effector memory T cells were clonal. For peripheral blood specimens (gag-pol) obtained at time point 2, the odds of a viral sequence being a clone in effector memory T cells were 20-fold and 7-fold higher than if the viral sequence came from central memory T cells (P = .0001) and transitional memory T cells (P = .01), respectively, in subject 8. For lymph node tissue the odds of a viral sequence being a clone in effector memory T cells were 11-fold and 7-fold higher than if the viral sequence came from central memory T cells (P = .0003) and transitional memory T cells (P = .02). In addition, we estimated the percentage of each specific T-cell subset containing identical HIV-1 sequences within the HIV-1 DNA pool during long-term suppressive therapy (Table 3). We estimated that 29%–62% and 19%–55% of all viruses in blood specimens obtained at time points 1 and 2, respectively, were created by clonal expansion.
Table 3.
Percentage of the Total Viral Pool of Integrated Human Immunodeficiency Virus Type 1 DNA in T Cells Contributed by Identical Sequences (gag-pol)
| Compartment, Cellular Phenotype | Subject 6, Contribution, % (95% CI) |
Subject 7, Contribution, % (95% CI) |
Subject 8, Contribution, % (95% CI) |
|||
|---|---|---|---|---|---|---|
| Time Point 1 | Time Point 2 | Time Point 1 | Time Point 2 | Time Point 1 | Time Point 2 | |
| Blood | ||||||
| Overall | 28.5 (13.4–44.4) | 18.6 (8.2–31.2) | 62.2 (47.5–75.0) | 54.5 (43.8–65.1) | 61.0 (43.0–78.3) | 38.7 (26.9–51.1) |
| TNA | 17.2 (6.1–30.8) | 6.2 (2.6–10.7) | 6.6 (2.2–12.0) | 0 (0–.07) | 0.7 (.15–1.5) | 0.22 (.055–.46) |
| TCTM | 10.8 (2.6–21.1) | NA | 0 (0–.14) | NA | 45.9 (28.7–62.9) | NA |
| TCM | NA | 10.3 (0–22.0) | NA | 18.8 (9.7–29.0) | NA | 8.6 (1.9–17.4) |
| TTM | NA | 0.90 (0–3.0) | NA | 3.1 (0–7.1) | NA | 11.4 (4.6–19.5) |
| TEM | 0.51 (.11–1.10) | 1.2 (.65–2.0) | 55.6 (41.5–68.1) | 32.6 (25.8–39.5) | 14.4 (8.4–21.5) | 18.6 (11.4–26.7) |
| GALT | ||||||
| Overall | 21.2 (6.9–37.6) | NA | 17.1 (2.7–35.8) | NA | 20.8 (5.6–37.7) | 11.7 (0–40.0) |
| TNA | 0 (0–.88) | NA | 0 (0–4.7) | NA | 0 (0–.00045) | 0 (0–.013) |
| TCTM | 14.8 (3.5–28.6) | NA | 2.4 (0–8.0) | NA | 8.2 (0–20.6) | 0 (0–8.7) |
| TEM | 6.4 (0–16.2) | NA | 14.8 (0–30.5) | NA | 12.6 (0–26.9) | 11.7 (0–38.1) |
See “Methods” section for the definitions of time points 1 and 2.
Abbreviations: CI, confidence interval; NA, not available; TCM, central memory CD4+ T cells; TCTM, central/transitional memory CD4+ T cells; TEM, effector memory CD4+ T cells; TNA, naive CD4+ T cells; TTM, transitional memory CD4+ T cells.
DISCUSSION
To define the stability of the intracellular HIV-1 DNA pool during effective ART and the role of cell proliferation as a cause of HIV-1 persistence, we examined the HIV-1 integrant frequencies and the distribution of clonal HIV-1 intracellular sequences in different memory T-cell subsets from peripheral blood, GALT, and lymph node tissue specimens during long-term suppressive therapy. We found that HIV-1 DNA integrant frequencies within CD4+ T cells remain generally stable over time in blood and gut tissue. We also found that a large proportion of the viral population is clonal in nature, with this clonality more apparent in more-differentiated CD4+ T cells. These data collectively indicate that the pool of integrated DNA is largely maintained by cellular proliferation and differentiation of the memory CD4+ T-cell population.
To further evaluate the stability of the HIV-1 DNA integrant pool, we compared the estimated integrant frequencies of naive T cells and memory CD4+ T cells isolated from peripheral blood and GALT specimens observed in our recent study [3] to the integrant frequencies of cells isolated 7–9 months later. We estimated that the amount of HIV-1 DNA had changed by ≤4-fold between the 2 time points for all compartments, indicating that the pool of naive T cells and memory CD4+ T cells containing integrated DNA did not change dramatically over 7–9 months in these compartments. The detected fluctuations may reflect contractions and expansions of different cell types, as also revealed by analysis of identical sequences. Although most of the work investigating the cells that contribute to the HIV reservoir has largely relied on studies conducted with cells from peripheral blood, a number of findings suggest that other tissue compartments harbor persistent virus [5, 11]. In addition to peripheral blood and GALT specimens, we analyzed lymph node tissue specimens and found that integrant frequencies in naive and memory T cells were similar in peripheral blood and lymph node tissue specimens, as previously shown by Chomont et al [5].
In our recently published study, in-depth phylogenetic analyses revealed a lack of substantial genetic evolution, suggesting that ongoing cycles of viral replication are not a major contributor to the persistence of HIV-1 DNA in memory CD4+ T cells [3]. To further evaluate this issue, we conducted phylogenetic analyses of viral evolution on tissue samples and cells collected from the same subjects 7–9 months after our earlier study. This analysis allowed us to estimate how much low-level viral replication contributes to the longitudinal persistence of HIV-1 in specific cell subsets from specific tissue sources. Consistent with our earlier study, these longitudinal evolutionary analyses produced 2 important results: there was no substantial correlation between time and viral divergence for the gag-pol and env regions, and the evolutionary rates estimated (based on the region analyzed) that only 0.008–0.3 nucleotide substitutions per year occurred between the time point before therapy and time point 2 and 0.04–0.7 nucleotide substitutions occurred between time points 1 and 2. A reason why the evolutionary rates between the 2 pairs of time points are very close to but do not reach 0 is that, in the absence of measurable evolution, the rate is estimated close to the prior expectation by Bayesian analysis.
Cytokines such as interleukin 7 have been shown to enhance the survival of memory CD4+ T cells [5, 12, 13] and induce proliferation of latently infected cells without viral reactivation or genetic diversification [5, 14]. To evaluate the role of cellular proliferation as a cause for persistence during ART, we examined the distribution of identical HIV-1 intracellular sequences isolated from subjects who initiated therapy during chronic infection. Analysis of the more variable env region was conducted for subjects 7 and 8. Our results show that the env and gag-pol regions in subjects from the chronic infection group contained up to 73% identical sequence expansions and that only 3 of these sequence expansions were found in plasma sequences obtained before therapy. These results indicate that these sequence expansions were likely present because of cellular proliferation that occurred during suppressive therapy rather than because they were deposited in multiple cells prior to therapy. Our analysis is, however, limited in that we analyzed 2 specific genetic regions and were therefore unable to determine whether the identical sequence expansions could produce a replication-competent virus, but most likely these expansions result in both replication competent and incompetent virus. Furthermore, given the small sample size and modest duration of follow-up, we cannot exclude gradual declines in HIV-1 integrant levels.
We also found that effector memory T cells are more likely than transitional memory T cells and central memory T cells to contain identical sequences. The higher proportion of identical sequences detected in effector memory T cells can be explained by the different rates of cellular proliferation. Recent studies have shown that the rate of cellular proliferation is variable between the memory T-cell populations, with effector memory T cells having the highest proliferation rate and therefore a greater likelihood of harboring clonal viral genomes [5, 15, 16]. The clonal nature of HIV-1 DNA within effector memory T cells indicates that a small number of proliferating cells containing integrated HIV-1 are contributing to the persistence of HIV in effector memory T cells. The more genetically diverse HIV-1 DNA integrant pool in central memory T cells and transitional memory T cells most likely contains more replication-competent viral strains, which are maintained by a continual rate of viral reactivation and/or death of these cells.
In our earlier study, we identified the expansion of an identical sequence containing a large deletion in the gag-pol viral gene region in subject 7 [3]. When analyzing cells from peripheral blood samples collected 8 months later, we found that the sequence containing this deletion had increased from 82% to 92% among effector memory T cells, indicating that this deletion mutant expanded through cellular proliferation and/or clonal cell expansion with integrated virus and not viral replication, as this large 380–base pair deletion makes this virus replication incompetent [14, 17, 18]. Analysis of the env region did not reveal an equivalent clone. However, we found 11 identical sequence expansions in the env region from effector memory T cells, which, taken together, represented 60% of all the env sequences from effector memory T cells, indicating that several different genetic populations of env may be linked to the gag-pol region containing this deletion. Interestingly, in patients treated during chronic infection, up to 62% of all viruses in blood were estimated to be created by clonal proliferation, indicating the importance of cellular proliferation in maintaining HIV-1 DNA pool.
In conclusion, our longitudinal study provides evidence that the pool of HIV-1 integrants in memory T cells does not change dramatically over 7–9 months, revealing a relatively stable pool of integrated HIV-1 DNA in its size and its genetic variability during long-term suppressive therapy. These results support our earlier findings that viral replication is not a major contributor to persistent HIV-1 in patients receiving effective therapy. In addition, a large percentage of intracellular sequences not represented in plasma obtained before therapy are clonal in nature and enriched in more differentiated cells, suggesting that HIV persistence during effective therapy is more likely driven in large part by the proliferation, differentiation, and expansion of cell populations with sustained and durable regenerative potential, rather than by ongoing viral replication. Therefore, it appears that strategies needed to eradicate persistent HIV-1 would have to block homeostasis of the integrated HIV-1 DNA pool nonselectively and/or find strategies for purging the latent HIV-1 reservoirs at a greater efficiency than cellular proliferation. However, the difficulty of achieving this goal will be affected by whether the HIV-1 integrant is located in a proliferative gene.
Supplementary Data
Supplementary materials are available at The Journal of Infectious Diseases online (http://jid.oxfordjournals.org). Supplementary materials consist of data provided by the author that are published to benefit the reader. The posted materials are not copyedited. The contents of all supplementary data are the sole responsibility of the authors. Questions or messages regarding errors should be addressed to the author.
Notes
Acknowledgments. We thank the patients participating in this study.
Financial support. This work was supported by the Foundation for AIDS Research (amfAR Research Consortium on HIV Eradication Collaborative research grant 108074-50-RGRL), Delaney AIDS Research Enterprise (U19 AI096109), the Australian National Health and Medical Research Council (AAP1061681), the Erik and Edith Fernstrom Foundation for Medical Research (to S. v. S.), and the Karolinska Institutet (alumni funds to S. v. S.).
Potential conflicts of interest. All authors: No reported conflicts.
All authors have submitted the ICMJE Form for Disclosure of Potential Conflicts of Interest. Conflicts that the editors consider relevant to the content of the manuscript have been disclosed.
References
- 1.Buzon MJ, Massanella M, Llibre JM, et al. HIV-1 replication and immune dynamics are affected by raltegravir intensification of HAART-suppressed subjects. Nat Med 2010; 16:460–5. [DOI] [PubMed] [Google Scholar]
- 2.Yukl SA, Shergill AK, McQuaid K, et al. Effect of raltegravir-containing intensification on HIV burden and T-cell activation in multiple gut sites of HIV-positive adults on suppressive antiretroviral therapy. AIDS 2010; 24:2451–60. [DOI] [PMC free article] [PubMed] [Google Scholar]
- 3.Josefsson L, von Stockenstrom S, Faria NR, et al. The HIV-1 reservoir in eight patients on long-term suppressive antiretroviral therapy is stable with few genetic changes over time. Proc Natl Acad Sci U S A 2013; 110:E4987–96. [DOI] [PMC free article] [PubMed] [Google Scholar]
- 4.Chomont N, DaFonseca S, Vandergeeten C, Ancuta P, Sekaly RP. Maintenance of CD4+ T-cell memory and HIV persistence: keeping memory, keeping HIV. Curr Opin HIV AIDS 2011; 6:30–6. [DOI] [PubMed] [Google Scholar]
- 5.Chomont N, El-Far M, Ancuta P, et al. HIV reservoir size and persistence are driven by T cell survival and homeostatic proliferation. Nat Med 2009; 15:893–900. [DOI] [PMC free article] [PubMed] [Google Scholar]
- 6.Josefsson L, Eriksson S, Sinclair E, et al. Hematopoietic precursor cells isolated from patients on long-term suppressive HIV therapy did not contain HIV-1 DNA. J Infect Dis 2012; 206:28–34. [DOI] [PMC free article] [PubMed] [Google Scholar]
- 7.Palmer S, Kearney M, Maldarelli F, et al. Multiple, linked human immunodeficiency virus type 1 drug resistance mutations in treatment-experienced patients are missed by standard genotype analysis. J Clin Microbiol 2005; 43:406–13. [DOI] [PMC free article] [PubMed] [Google Scholar]
- 8.Kearney M, Maldarelli F, Shao W, et al. Human immunodeficiency virus type 1 population genetics and adaptation in newly infected individuals. J Virol 2009; 83:2715–27. [DOI] [PMC free article] [PubMed] [Google Scholar]
- 9.Kearney M, Palmer S, Maldarelli F, et al. Frequent polymorphism at drug resistance sites in HIV-1 protease and reverse transcriptase. AIDS 2008; 22:497–501. [DOI] [PMC free article] [PubMed] [Google Scholar]
- 10.Drummond AJ, Suchard MA, Xie D, Rambaut A. Bayesian phylogenetics with BEAUti and the BEAST 1.7. Mol Biol Evol 2012; 29:1969–73. [DOI] [PMC free article] [PubMed] [Google Scholar]
- 11.Gunthard HF, Havlir DV, Fiscus S, et al. Residual human immunodeficiency virus (HIV) Type 1 RNA and DNA in lymph nodes and HIV RNA in genital secretions and in cerebrospinal fluid after suppression of viremia for 2 years. J Infect Dis 2001; 183:1318–27. [DOI] [PubMed] [Google Scholar]
- 12.Geginat J, Sallusto F, Lanzavecchia A. Cytokine-driven proliferation and differentiation of human naive, central memory and effector memory CD4+ T cells. Pathol Biol 2003; 51:64–6. [DOI] [PubMed] [Google Scholar]
- 13.Kondrack RM, Harbertson J, Tan JT, McBreen ME, Surh CD, Bradley LM. Interleukin 7 regulates the survival and generation of memory CD4 cells. J Exp Med 2003; 198:1797–806. [DOI] [PMC free article] [PubMed] [Google Scholar]
- 14.Bosque A, Famiglietti M, Weyrich AS, Goulston C, Planelles V. Homeostatic proliferation fails to efficiently reactivate HIV-1 latently infected central memory CD4+ T cells. PLoS Pathog 2011; 7:e1002288. [DOI] [PMC free article] [PubMed] [Google Scholar]
- 15.Macallan DC, Wallace D, Zhang Y, et al. Rapid turnover of effector-memory CD4(+) T cells in healthy humans. J Exp Med 2004; 200:255–60. [DOI] [PMC free article] [PubMed] [Google Scholar]
- 16.Breton G, Chomont N, Takata H, et al. Programmed death-1 is a marker for abnormal distribution of naive/memory T cell subsets in HIV-1 infection. J Immunol 2013; 191:2194–204. [DOI] [PMC free article] [PubMed] [Google Scholar]
- 17.Maldarelli F, Wu X, Su L, et al. HIV latency. Specific HIV integration sites are linked to clonal expansion and persistence of infected cells. Science 2014; 345:179–83. [DOI] [PMC free article] [PubMed] [Google Scholar]
- 18.Wagner TA, McLaughlin S, Garg K, et al. HIV latency. Proliferation of cells with HIV integrated into cancer genes contributes to persistent infection. Science 2014; 345:570–3. [DOI] [PMC free article] [PubMed] [Google Scholar]
Associated Data
This section collects any data citations, data availability statements, or supplementary materials included in this article.