Abstract
Joint space morphology can be indicative of the risk, presence, progression, and/or treatment response of disease or trauma. We describe a novel methodology of characterizing joint space morphology in high-resolution 3D images [e.g., cone-beam CT (CBCT)] using a model based on elementary electrostatics that overcomes a variety of basic limitations of existing 2D and 3D methods. The method models each surface of a joint as a conductor at fixed electrostatic potential and characterizes the intra-articular space in terms of the electric field lines resulting from the solution of Gauss’ Law and the Laplace equation. As a test case, the method was applied to discrimination of healthy and osteoarthritic subjects (N = 39) in 3D images of the knee acquired on an extremity CBCT system. The method demonstrated improved diagnostic performance (area under the receiver operating characteristic curve, AUC > 0.98) compared to simpler methods of quantitative measurement and qualitative image-based assessment by three expert musculoskeletal radiologists (AUC = 0.87, p-value = 0.007). The method is applicable to simple (e.g., the knee or elbow) or multi-axial joints (e.g., the wrist or ankle) and may provide a useful means of quantitatively assessing a variety of joint pathologies.
1. Introduction
It is estimated that 52.5 million U.S. adults aged ≥ 18 y suffer from some form of arthritis or related rheumatic condition (Centers for Disease Control and Prevention 2013). Such prevalence places extensive demand on tools for management and monitoring of the disease. In recent years, novel therapeutic agents have also emerged to treat arthritis and alter the progression of disease in the affected joints. The promise of such disease-modifying osteoarthritic drugs (DMOADs) and antirheumatic drugs (DMARDs) motivates the development of new methodology to characterize subtle changes in joint morphology and provide reliable assessment of therapy response. Traditional semi-quantitative image-based measures include the Sharp-Larsen score (Sokka 2008), which grades the integrity of the joint space and presence or absence of erosions evident in a plain radiograph. In assessment of knee osteoarthritis, the joint space width (JSW) (i.e., distance between the femur and tibia) is a quantitative measure used by clinicians in diagnosis of degenerative disease. Accordingly, narrowing of JSW demonstrated in weight-bearing radiography can be used to assess the severity and progression of degenerative diseases of the knee. However, such measures carry a basic limitation associated with radiographic imaging (i.e., reducing 3D information to a plane) and are subject to variations in both patient setup and reader repeatability (Sharp et al 2005).
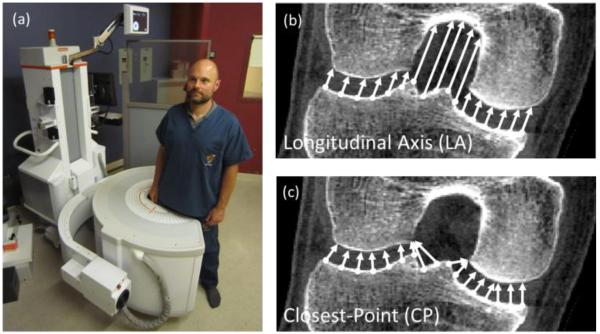
The prevalence of arthritic disease and the promise of emerging therapies have also motivated development of new 3D imaging techniques (including ultrasound, MR, CT, and tomosynthesis). These techniques enable more refined tomographic measures of joint space narrowing, such as a joint space map (JSM) (Kalinosky et al 2011), which characterizes the JSW across the articular surface. Among the imaging technologies introduced in recent years is cone-beam CT (CBCT) dedicated to imaging the extremities as detailed in previous work (Zbijewski et al 2011) and illustrated in Fig. 1. Such a system can provide sub-millimeter isotropic spatial resolution, soft-tissue imaging capability sufficient for a broad range of musculoskeletal imaging tasks, reduced radiation dose in comparison to conventional multidetector CT (MDCT), and suitability to imaging the upper and lower extremities, including weight-bearing exams of the lower extremities (Prakash et al 2011, Muhit et al 2013, Carrino et al 2014, Ludlow and Ivanovic 2014, Tuominen et al 2013).
Figure 1.
(a) Photograph of the CBCT scanner with a subject shown in a weight-bearing standing configuration as in this study. Illustration of (b) longitudinal axis and (c) closest-point measurement of joint space width.
Such high resolution systems present an opportunity for quantitative characterization of 3D joint space morphology beyond that of conventional measures and potentially more sensitive to subtle disease or treatment response. Possible methods to compute JSMs from such images include projection along a longitudinal axis (LA) of the joint (Figure 1b) or the distance between closest points (CP) on articular surfaces (Figure 1c). However, each of these methods entails a potential limitation: in the former, the definition of a LA is somewhat arbitrary (dependent on patient orientation) and is difficult to extend to multi-axis joints; in the latter, the measurement undersamples the surfaces at protrusions and concavities and is asymmetric from one articular surface to the other and vice versa. Unless otherwise stated, in the following sections, JSM refers to the electrostatic JSM resulting from the electrostatic model of section 2.1. The maps resulting from the alternative LA and CP methods are denoted LA-JSM and CP-JSM, respectively.
In this work, we describe a method for characterization of 3D joint space morphology that overcomes many of the basic limitations of the measures noted above. The method is similar to that previously proposed to measure the thickness of tissues in the brain (Yezzi and Prince 2003). As detailed below, the method envisions the joint as an electrostatic capacitor bounded by equipotential surfaces (two or more bones). Elementary electrostatics yields a unique solution to the electric field lines within the capacitor (the intra-articular space) and a robust measure of joint space morphology. As a test case, we apply the method to the task of discriminating normal and osteoarthritic (OA) subjects based on CBCT images of their weight-bearing knee.
2. Methods
2.1 An Electrostatic Model for Joint Space Analysis
In the electrostatic model, articular surfaces of a synovial joint are conceptualized as conductors with different uniform charge densities, resulting in an electric potential at each boundary, analogous to the plates of a capacitor. Rather than using the Euclidean distance defined along an axis [LA in Fig. 1(b)] or closest point pairs [CP in Fig. 1(c)], the lengths of electric field lines between the two surfaces are used as a surrogate JSW within an unambiguous, non-degenerate curvilinear space defined by the joint space morphology. This method has a number of potential advantages: (i) it does not depend on an arbitrary axis as a reference direction; (ii) it is symmetric with respect to each of the articulating surfaces; and (iii) it densely samples each point on all surfaces.
Computationally, JSMs can be obtained by first finding the electric potential distribution within a ROI containing the joint space, taking its gradient to find the electric field, and computing the line integral along the field lines. We denote the volumetric ROI about the joint space as Ω ⊂ ℝ2, ℝ3 and assume n articulating surfaces denoted ∂1Ω, …, ∂nΩ. The electric field and electric potential in Ω are and Φ, with properties defined by elementary electrostatics:
| (1) |
and Gauss’ law:
| (2) |
Conventionally, ε0 denotes the permittivity of free space and ρ the charge density. Each surface ∂0Ω, ∂1Ω, …, ∂nΩ is assigned a different charge density ρ0, ρ1, …, ρn, respectively. Alternatively, a particular surface of interest can be assigned charge density ρ1 and all others ρ0. Substitution of (1) into (2) gives the Laplace equation
| (3) |
Equation (3) can be solved subject to boundary conditions Φ(∂0Ω) = V0, … Φ(∂nΩ) = Vn, which are the electric potentials arising from the assigned charges. Finding Φ is a Dirichlet problem that has numerous well-documented solutions (Jackson 1998). Once Φ is determined on Ω, can be found from (1), and the field line lengths are analyzed by line integrals between points on the boundaries ∂0Ω ∪ … ∪ ∂nΩ.
As shown in Fig. 2(a), we assigned Φ(∂1Ω) = V1 and Φ(∂2Ω) = V2 as the potential on two articulating surfaces of the knee (femur and tibia, respectively) and introduced Φ(∂0Ω) = V0 on the boundary of the ROI so that Ω has compact support. The model is capable of handling multi-axis joints with any number of articulating surfaces, such as the wrist or ankle, by assigning a unique charge density to each surface and treating as a multi-conductor system, or by assigning one bone of interest (e.g., the scaphoid) a different charge from all other bones of the joint.
Figure 2.
(a) Illustration of the electrostatic model applied to the knee joint space Ω. The two articulating surfaces are ∂1Ω and ∂2Ω, and the region of interest boundary is ∂0Ω. (b) Field line lengths mapped to points of either surface (e.g., the tibial plateau) to form a JSM.
The electric potential Φ in the joint space Ω can be approximated using the Jacobi method over the Cartesian grid with nodes corresponding to the center of voxels. The basic formulation of the Jacobi method involves representing the partial differential equation (PDE) as a diffusion problem. In our case, the Laplace equation (3) can be solved for Φ by writing:
| (4) |
where time, t, is analogous to the number of iterations. The boundary conditions, here also used as the initial condition, are set to the respective charges on ∂1Ω and ∂2Ω. As t → ∞, the initial conditions relax to the equilibrium solution satisfying , yielding the solution Φ. According to the forward-time central-space (FTCS) scheme, equation (4) can be discretized as:
| (5) |
where n is the number of iterations and ΔΦ(x,y,z) is the discrete Laplacian:
| (6) |
The parameter ν governs the rate of relaxation, in this work set to , which is theoretically the maximum step size that yields a stable solution (Press et al 1992). The resulting discrete form for (5) is the iterative relation:
| (7) |
According to equation (7), each voxel in the next iteration is the mean of its neighboring voxels in the current iteration. This form can be conveniently implemented as a convolution of a mean filter with the entire segmented image and resetting boundary conditions after each iteration. For the knee model in figure 2, voxels on ∂1Ω and ∂2Ω were assigned to +1 V and −1 V, respectively. Since approximating (nearly) infinite boundary conditions carries a large computational load (with little effect within the ROI of the joint space), we assume that the ROI of the joint space is far from the image border (∂0Ω), so the potential field can be approximated accurately by zero padding.
From the resulting Φ, the electric field, , is solved via equation (1). The origin of each field line is arbitrary and nominally taken to be the voxels on surfaces ∂1Ω and ∂2Ω. The length of each field line is then computed using Euler’s method with linear interpolation between voxels from ∂1Ω to ∂2Ω at fixed step size d:
| (8) |
for i = 0, 1, …, N, is a vector within the space Ω along the electric field at point si, and s0 and sN are points on the articulating surfaces. The JSM is then represented as a matrix with each element corresponding to the field line length.
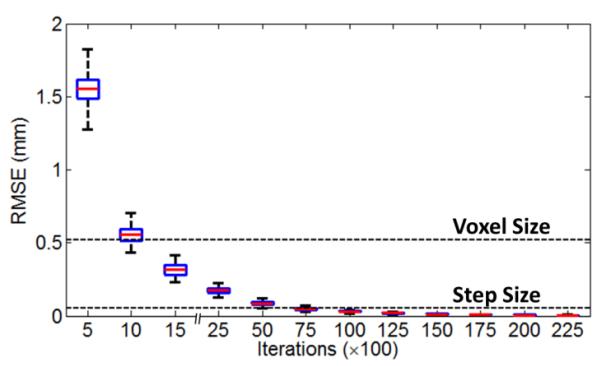
The convergence of the solution was analyzed in terms of the RMSE of the map at the kth iteration (JSMk) from the converged JSM (JSMc), where JSMc was defined as the map computed from a very large number of iterations (25,000) in which field line lengths were changing negligibly (much less than the voxel size) with further iterations The error at the kth iteration was computed as:
| (9) |
where x ∈ JSMk ∩ JSMc denotes voxels common to both the kth and cth iteration, and dim is the number of voxels in that intersecting set.
2.2. Application to Knee Joint Morphology
2.2.1 Overview
The electrostatic model was employed to study knee joint morphology in images acquired using the extremity CBCT scanner as in figure 1. As detailed below and illustrated in figure 3, the process included steps associated with cropping to a ROI about the joint space, semiautomatic bone segmentation, calculation of the electric field using the Jacobi method and Gauss’ Law, and calculation of field line lengths via Euler’s method to yield a dense 3D point cloud labeling the JSW at each point on each surface.
Figure 3.

Flowchart illustration of the process for JSM calculation from CBCT scans.
2.2.2 Segmentation
The CBCT knee images were segmented in a semi-automatic pipeline to define the cortical bone surfaces. Each image was cropped to 256×256×128 voxels roughly centered about the intercondylar notch. Soft tissue was then subtracted from the image slice-by-slice by grayscale morphological opening and closing (Sternberg 1986). Bones were then segmented by local thresholding (Chow and Kaneko 1972) based on the intensity range in a 3 × 3 neighborhood, and holes in the segmentation were filled by morphological closing. In instances of physical impingement of the femur and tibia (i.e., a “short circuit,” evident in 4/39 cases described below), the femur and tibia components were manually separated by one voxel. The femur and tibia were then identified as the two largest components in a connected component analysis.
2.2.3 Field Calculation and Map Creation
Calculation of the electric potential and field lines was performed using the method in section 2.1 carried out on GPU (NVIDIA GTX470) using the gpuArray object in MATLAB (The Mathworks, Natick MA) for improved parallelization. The electric field at the ∂0Ω boundary of the image was calculated with forward and backward differences, and the field at interior voxels was computed using the central difference. Field line lengths were computed using MATLAB’s stream3c function modified to Euler’s method as described above with a step size of d = 0.1 voxels. Field lines terminating at the image border or with length greater than 3.6 cm were discarded, since the trajectories of these field lines were well outside the region of interest and no longer relevant to the JSW. Convergence of the solution was assessed in terms of equation (9). The JSM was represented as a colormap superimposed on the tibial plateau, which presented a simpler (flatter) surface than the femur and fairly intuitive visualization of the result.
2.3. Clinical Application: Characterization of Knee Osteoarthritis
2.3.1. Clinical Study in Knee Osteoarthritis
A study was conducted under an approved IRB protocol in which a total of N=39 (24 male, 15 female; 29-78 yo, mean 47 yo) subjects were recruited under informed consent, including 21 subjects presenting with OA and 18 subjects with no known symptoms or history of OA. All images were acquired using a scan protocol of 80 kVp and 108 mA [~10 mGy absolute dose as described in (Carrino et al 2014)]. A scan of the dominant knee was acquired for each subject in the standing position (figure 1) with their weight evenly distributed between both legs. Images were reconstructed by 3D filtered backprojection with a Hann kernel and a volume encompassing a 20 × 20 × 20 cm3 field of view about the knee joint at isotropic voxel size of 0.52 mm. The OA population consisted of subjects diagnosed according to the current standard of clinical care based on symptoms, physical examination by an orthopaedic specialist, and assessment by a musculoskeletal radiologist (independent of the JSM analysis herein) of joint space narrowing, osteophytes, effusion, and other established radiographic biomarkers of OA.
2.3.2. Analysis of JSM in Osteoarthritis
JSM features were analyzed to investigate whether the method could provide quantitative characterization of joint space morphology and possible discrimination of normal and OA knees. First, each point cloud was rigidly registered, and the coordinates of corresponding points identified using the coherent-point drift (CPD) algorithm (Myronenko and Song 2010) were averaged to yield a mean shape (Chintalapani et al 2007). The registration yielded an n × p (n = 39, p = 15934) matrix where p-dimensional column vectors denote the JSW at p corresponding points in a collection of n registered JSMs.
The centered data was , where . Principal component analysis (PCA) was performed on the centered data to more fully analyze the spatial information conveyed by the JSM. The maps were decomposed into components characterizing the key features of variance between the registered maps using the pca function in MATLAB, returning a matrix Up×(n-1) with columns corresponding to eigenvectors and a matrix Sn×(n-1) with rows corresponding to the weights of the principal components in descending order of variance, where MC = SUT.
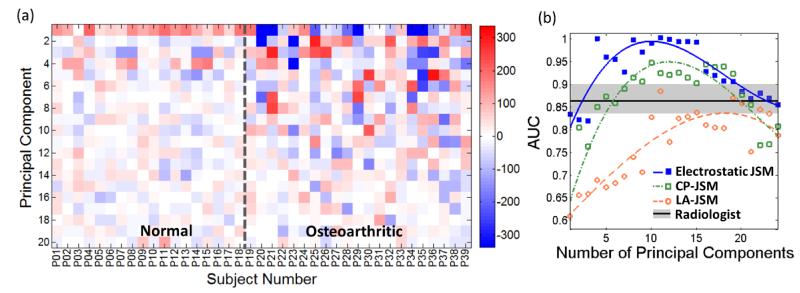
To assess how well these principal component weights could be used to correctly classify normal and OA knees, truncated vectors from matrix were chosen as input to a support vector machine (SVM) (Cortes and Vapnik 1995) following a leave-one-out scheme — treating each vector as testing data while using the others for training. A varying number of principal components [1-20, shown in figure 7(b), corresponding to different degrees of truncation] are considered. The SVM is a binary classifier that finds the hyperplane that maximizes the margin separating the training data , where yk ∈ {+1,−1} is a binary label, and is the input vector under transformation of the radial basis function (RBF) kernel . The MATLAB functions svmtrain and svmclassify were used to train input vectors and classify test data, respectively. For this study, the L1-soft margin classifier was used:
subject to the constraints and ξk > 0. The soft margin parameter, C, reflects the degree of error allowed in the training sample and reduces overfitting, empirically set to a value of C = 100. For each leave-one-out experiment conducted using a different number of input principal components, the RBF kernel σ was perturbed from 0 to 30, yielding sensitivity and specificity analogous to a receiver operating characteristic (ROC) curve. The JSMs from the electrostatic model were also compared with those derived from the LA and CP methods and analyzed with the same PCA, SVM, and leave-one-out training paradigm. For the LA method, the longitudinal axis was defined as the z-axis of the reconstruction, coinciding approximately with the long axis of the leg. For the CP method, closest points between the tibial and femoral surfaces were computed (down-sampled by a factor of 2 due to the large number of nearest-neighbor searches involved).
Figure 7.
Principal component analysis of the JSM. (a) Principal component weight for the first 24 components analyzed using the electrostatic JSM method. (b) AUC in discriminating normal and OA subjects based on PCA of the JSM, analyzed as a function of the number of principal components. Curves are a simple polynomial fit to guide the eye. The Radiologist reading performance is marked by the mean and range (in gray).
The classification accuracy resulting from these JSM features was compared to that associated with the JSW measured by three expert musculoskeletal radiologists using methods common in current diagnostic practice – specifically, the closest distance between the femur and tibia in the medial compartment as assessed visually in triplanar views and measured with a digital ruler on a VuePACS 3D workstation (Carestream Health, Rochester NY). To test the statistical significance in the difference between AUC values measured using JSMs and the radiologist JSW measurements, an unpaired heteroscedastic t-test was performed. The AUC for each radiologist was considered separately. For the various JSM methods, an ensemble of AUC measurements was formed from the 11 measurements about the peak performing number of principal components (shown in figure 7), better allowing for noise in the JSM classification results and providing a conservative estimate with respect to the optimal number of principal components. For the electrostatic JSM method, the optimal number of principal components was 10, giving an ensemble of AUC measurements resulting from 5 – 15 components; similarly for the LA-JSM and CP-JSM methods, the ensemble about the optimum included AUC measurements resulting from the first 10–20 components and 5–15 components, respectively.
Results
2.4. Algorithm Performance
The JSM calculation was fully converged for all cases by 25,000 iterations, with no change in JSM values for further iterations. Calculation of the electric potential was the most computationally intensive aspect of the method (approximately 20 iterations per second in MATLAB code on the mid-range GPU used in this work, requiring ~20 minutes per case); however, a reasonably stable solution could be obtained with fewer iterations, as shown in figure 4. For example: RMSE less than the voxel size (0.52 mm) could be obtained in the first ~1000 iterations (1 min) and RMSE less than the step size (d = 0.052 mm) at 10,000 iterations (~8 min). Accelerating the computation time was not a focus of the current work, and there are numerous hardware (faster GPU) and software (compiled C++/CUDA code) solutions to be investigated in future work. The time required for field line length analysis was small by comparison (~45 s).
Figure 4.
Convergence of the JSM calculation as a function of iterations. The box-and-whisker plots show the median, quartiles, and range in RMSE for all JSMs computed over all 39 cases in the clinical study.
2.5. Joint Space Maps
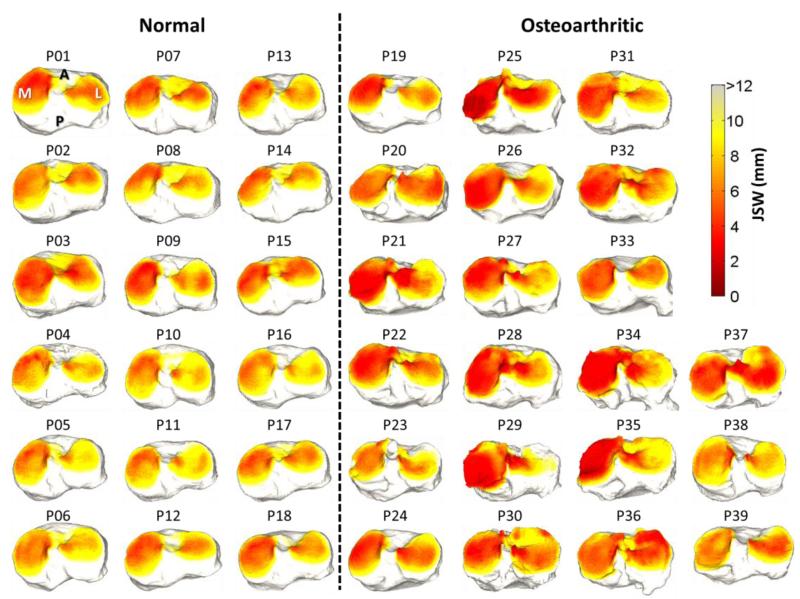
Osteoarthritis of the knee tends to present with narrowing of the joint space, with varying degrees in the medial and lateral compartment (van der Esch et al 2014)–a pattern consistent overall with the JSM results presented in figure 5 for the 39 subjects in the clinical study. Some notable exceptions are apparent, such as subjects P23 and P38, which qualitatively demonstrate JSMs similar to the normal group; however, close inspection (and feature analysis below) reveals characteristics of the joint space morphology that are distinct. For example, P23 exhibits narrowing in the anterior medial aspect, and P38 demonstrates reduction of the intercondylar notch due to osteophyte growth. Such qualitative differences are investigated quantitatively below.
Figure 5.
Joint space maps computed using the electrostatic model for 39 subjects in the clinical study, grouped as normal and OA. The JSM is displayed as a heat map projected onto surface of the tibial plateau.
2.6. Quantitative Analysis
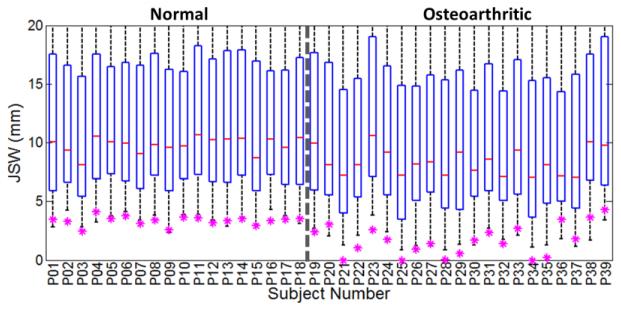
Figure 6 shows a simple analysis of the JSM in terms of the histogram of JSW values in each of the 39 subjects. Also shown are the radiologists’ measurement of minimum distance in the medial compartment as in clinical diagnosis. Overall, the radiologist readings are similar to the minimum distance in the electrostatic JSM [denoted min(JSM)], but there are notable exceptions in which min(JSM) is smaller than the radiologist reading (attributable to a minimum distance detected elsewhere than the medial compartment – e.g., in the intercondylar notch) and several in which min(JSM) is greater than the radiologist reading (attributable either to reader error or segmentation error). Of course, equivalence between the two measures is not expected, since the field lines curve according to the electric potential, typically resulting in a longer distance within the curved space of the electrostatic model. Overall, the radiologist reading in the medial compartment was a good discriminator of normal and OA knees, yielding an overall area under the ROC curve (AUC) of 0.87. The min(JSM) value exhibited slightly better performance (AUC = 0.92), but the difference was not statistically significant (p = 0.649 via paired t-test on measurement data).
Figure 6.
Distribution of JSW as measured by the electrostatic JSM method, with box-and-whisker plots showing the median, first and third quartiles, and range in JSM for each subject. Also shown (asterisk) is the minimum distance in the medial compartment as measured by 3 musculoskeletal radiologists.
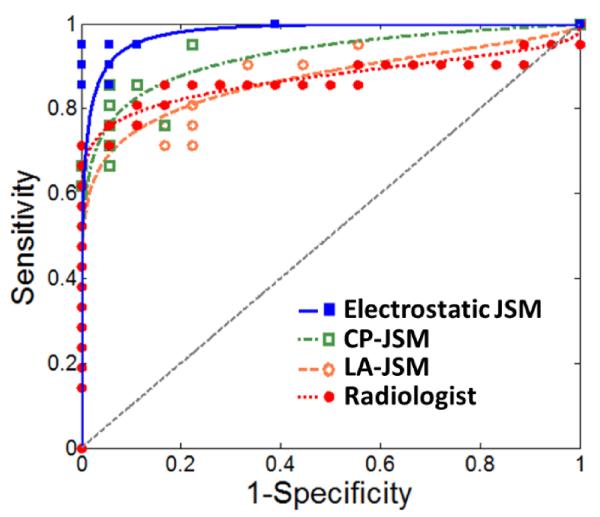
Analysis of the principal components of the spatial distribution evident in the electrostatic JSMs [illustrated in figure 7(a)] yielded improved classification performance. Overall, the electrostatic JSMs for the OA group exhibited stronger variability in principal component weights than the normal group. Figure 7(b) plots the AUC resulting from PCA of the JSMs as a function of the number of principal components included, yielding an AUC > 0.98 over a range of the first 10 to 15 principal components. The number of support vectors was in the range 10-15, which was below 50% of the sample size and is consistent with a modest fitting (i.e., not overfitting) in the SVM. Increasing the number of principal components reduced the classification accuracy in a manner attributed to noise in the JSM. Figure 8 shows the sensitivity and specificity associated with the four tests considered – Radiologist Reading of the medial compartment, electrostatic JSM (using the first 10 principal components), CP-JSM (using the first 10 principal components), and LA-JSM (using the first 15 principal components). The LA-JSM method performed least favorably, consistent with the hypothesis described above regarding the arbitrariness in definition of the longitudinal axis. The CP-JSM method performed comparably to the Radiologist Reading method, which is sensible in that each method involves assessment of the closest distance between surfaces. The electrostatic JSM method performed best (<AUC> = 0.98) and the improvement with respect to the Radiologist Reading was statistically significant (p = 0.008).
Figure 8.
Sensitivity and specificity curves comparing classification accuracy for the mean radiologist reading of the medial compartment and PCA of the electrostatic JSM, CP-JSM, and LA-JSM using the peak number of principal components from figure 7. For ease of visualization, the points were fitted with ROC curves based on the assumption of binormal distribution (Metz et al 1998).
Discussion and Conclusions
In summary, we have developed a method for morphological analysis of joints based on an abstraction of elementary electrostatics, envisioning the articular surfaces as conductors in a capacitor and characterizing the intra-articular space according to the distance along electric field lines. This method takes advantage of the isotropic 3D spatial resolution of CBCT extremity imaging and yields a unique, non-degenerate, symmetric, and dense characterization of the joint space in a manner that overcomes some of the limitations of other simple methods (e.g., distance along a longitudinal axis or distance between closest points). The method is also applicable to complex, multi-component joints and yields a rich “map” of the joint space. Simple analysis of the JSM (e.g., Min(JSM)) was comparable in knee OA classification performance to conventional clinical reading of the medial compartment, and more sophisticated PCA of the map spatial distribution provided improved performance (nearly perfect in the limited sample of 39 subjects).
The current bottlenecks in applying such analysis of the joint space are the segmentation process and the iterative algorithm for solving the electrical potential. The first relies on a semiautomatic process for delineating the bones and required manual intervention to ensure smooth, well connected segmentations and to resolve impingements. We did not investigate more sophisticated segmentation methods such as active contour (Yezzi et al 2001) or atlas-based (Schmid et al 2011) approaches that could alleviate the bottleneck and could perform well in segmenting high-contrast bone. The latter bottleneck is a product of the numerical method employed in the current work (i.e., the Jacobi approximation to the electric potential) and unoptimized implementation in MATLAB. Methods with faster convergence properties are the subject of future work as is implementation of the algorithm in C++/CUDA better optimized for calculation on GPU.
The current study involves a variety of limitations. First, with respect to the task of discriminating normal and OA subjects, the method examined only the spatial relationship between the femur and the tibia and did not include other possible morphological characteristics (e.g., association with the patella or soft tissues, such as cartilage and meniscus) or material characteristics (e.g., bone mineral density). It may therefore be beneficial to complement the JSM with other measures that can also be derived from the CBCT image [e.g., soft tissue visibility (Carrino et al 2014)] and bone mineral density (Muhit et al 2013). Secondly, it is difficult to determine whether the SVM was overfitted for the current dataset and requires cross-validation in an expanded study beyond the fairly limited sample of 39 subjects before generalizing the results presented here to a larger population. Finally, to compare the performance of CP-JSM and LA-JSM, although more sophisticated variations of these methods could be envisioned (e.g., for LA, computing the best fit to the tibial and/or femoral axis as the longitudinal axis), such is beyond the scope of this paper, which focuses on the concept of electrostatics as a model for morphological characterization. Moreover, the LA and CP methods exhibit some basic limitations even in more sophisticated forms: the former is limited to simple two-component joints (e.g., the knee), and the latter is subject to undersampling and yields a different answer depending on which surface is selected as the reference. The electrostatic method is free of these limitations and could be applied to complex joints (e.g., the wrist or ankle) and yields a unique solution.
Analysis of joint space morphology in terms of PCA of the JSMs computed from the electrostatic model appeared to yield a high level of classification accuracy in normal and OA knees. More sophisticated decomposition and classification methods can be envisioned, which might further improve the accuracy and sensitivity of morphological analysis. Future work also includes extension of the model to more complex, multi-component joints and application to other pathologies that could benefit from improved quantitative image analysis of joint morphology associated with disease progression or therapy response, including OA of the hand and wrist, rheumatoid arthritis, and the post-traumatic load-bearing ankle.
Table 1.
Comparison of diagnostic accuracy (AUC) in discriminating normal and OA subjects. Radiologist reading corresponds to classification based on their manual measurement of the minimum distance in the medial compartment. For the three JSM methods, the ensemble <AUC> is the mean AUC in the region (±5 principal components) about the optimal number of principal components. The p-value is that resulting from an unpaired heteroscedastic t-test comparing a given JSM method to the Radiologist Reading. For example, the improved <AUC> measured for the electrostatic JSM method was statistically significant (p = 0.008), but that for the CP-JSM method was not (p = 0.071).
| Input for Classification | <AUC> | p-value |
|---|---|---|
| Electrostatic JSM | 0.98 | 0.008 |
| CP-JSM | 0.90 | 0.071 |
| LA-JSM | 0.76 | 0.007 |
| Radiologist Reading | 0.87 | ~ |
Acknowledgements
This research was supported by NIH-R21-AR-062293 and collaboration with the US Army Natick Soldier Research, Development, and Engineering Center. The authors thank Dr. J. Yorkston and Dr. N. Packard (Carestream Health) for their support on this project, Yifu Ding and Bisakha Ray (Department of Biomedical Engineering, Johns Hopkins University) for early investigation of the electrostatic model, and Sureerat Reaungamornrat (Department of Computer Science, Johns Hopkins University) for valuable discussion of image segmentation methods. Clinical studies were performed with assistance provided by Dr. John Carrino (clinical expertise and image interpretation), Dr. Mahadevappa Mahesh (medical physics radiation and image quality tests), Ms. Shannon Comes, Ms. Martha DeCarlo, Ms. Paula Frank, Ms. Janet McCormack, and Mr. Anthony Petruccy (Russell H. Morgan Department of Radiology, Johns Hopkins Hospital).
References
- Carrino JA, Al Muhit A, Zbijewski W, Thawait GK, Stayman JW, Packard N, Senn R, Yang D, Foos DH, Yorkston J, Siewerdsen JH. Dedicated cone-beam CT system for extremity imaging. Radiology. 2014;270:816–24. doi: 10.1148/radiol.13130225. [DOI] [PMC free article] [PubMed] [Google Scholar]
- Centers for Disease Control and Prevention Prevalence of doctor-diagnosed arthritis and arthritisattributable activity limitation--United States, 2010-2012. Morb. Mortal. Wkly. Rep. 2013;62:869–73. [PMC free article] [PubMed] [Google Scholar]
- Chintalapani G, Ellingsen LM, Sadowsky O, Prince JL, Taylor RH. Statistical atlases of bone anatomy: construction, iterative improvement and validation. Med. Image Comput. Comput. Assist. Interv. 2007;10:499–506. doi: 10.1007/978-3-540-75757-3_61. [DOI] [PubMed] [Google Scholar]
- Chow CK, Kaneko T. Automatic Boundary from Detection of the Cineangiograms Left Ventricle. Comput. Biomed. Res. 1972;5:388–410. doi: 10.1016/0010-4809(72)90070-5. [DOI] [PubMed] [Google Scholar]
- Cortes C, Vapnik V. Support-vector networks Mach. Learn. 1995;20:273–97. [Google Scholar]
- Van der Esch M, Knol DL, Schaffers IC, Reiding DJ, van Schaardenburg D, Knoop J, Roorda LD, Lems WF, Dekker J. Osteoarthritis of the knee: multicompartmental or compartmental disease? Rheumatology (Oxford) 2014;53:540–6. doi: 10.1093/rheumatology/ket393. [DOI] [PubMed] [Google Scholar]
- Jackson JD. Classical Electrodynamics (Wiley) 1998:57–135. [Google Scholar]
- Kalinosky B, Sabol JM, Piacsek K, Heckel B, Gilat Schmidt T. Quantifying the tibiofemoral joint space using x-ray tomosynthesis. Med. Phys. 2011;38:6672–82. doi: 10.1118/1.3662891. [DOI] [PubMed] [Google Scholar]
- Ludlow JB, Ivanovic M. Weightbearing CBCT, MDCT, and 2D imaging dosimetry of the foot and ankle. Int. J. Diagnostic Imaging. 2014;1:1–9. [Google Scholar]
- Metz CE, Herman BA, Shen J. Maximum likelihood estimation of receiver operating characteristic (ROC) curves from continuously distributed data. Stat. Med. 1998;17:1033–53. doi: 10.1002/(sici)1097-0258(19980515)17:9<1033::aid-sim784>3.0.co;2-z. [DOI] [PubMed] [Google Scholar]
- Muhit AA, Arora S, Ogawa M, Ding Y, Zbijewski W, Stayman JW, Thawait G, Packard N, Senn R, Yang D, Yorkston J, Bingham CO, Means K, Carrino Ja, Siewerdsen JH. Peripheral quantitative CT (pQCT) using a dedicated extremity cone-beam CT scanner ed J B Weaver and R C Molthen. 2013;8672:867203. doi: 10.1117/12.2006939. [DOI] [PMC free article] [PubMed] [Google Scholar]
- Myronenko A, Song X. Point set registration: coherent point drift. IEEE Trans. Pattern Anal. Mach. Intell. 2010;32:2262–75. doi: 10.1109/TPAMI.2010.46. [DOI] [PubMed] [Google Scholar]
- Prakash P, Zbijewski W, Gang GJ, Ding Y, Stayman JW, Yorkston J, Carrino J a, Siewerdsen JH. Task-based modeling and optimization of a cone-beam CT scanner for musculoskeletal imaging. Med. Phys. 2011;38:5612–29. doi: 10.1118/1.3633937. [DOI] [PMC free article] [PubMed] [Google Scholar]
- Press WH, Teukolsky SA, Vetterling WT, Flannery BP. Numerical Recipes in C (Cambridge University Press) 1992:836–71. [Google Scholar]
- Schmid J, Kim J, Magnenat-Thalmann N. Robust statistical shape models for MRI bone segmentation in presence of small field of view. Med. Image Anal. 2011;15:155–68. doi: 10.1016/j.media.2010.09.001. [DOI] [PubMed] [Google Scholar]
- Sharp JT, van der Heijde D, Angwin J, Duryea J, Moens HJB, Jacobs JWG, Maillefert J-F, Strand CV. Measurement of joint space width and erosion size. J. Rheumatol. 2005;32:2456–61. [PubMed] [Google Scholar]
- Sokka T. Radiographic Scoring in Rheumatoid Arthritis Bull. NYU Hosp. Jt. Dis. 2008;66:166–8. [PubMed] [Google Scholar]
- Sternberg SR. Grayscale Morphology Comput. Vision, Graph. Image Process. 1986;35:333–55. [Google Scholar]
- Tuominen EKJ, Kankare J, Koskinen SK, Mattila KT. Weight-bearing CT imaging of the lower extremity. AJR. Am. J. Roentgenol. 2013;200:146–8. doi: 10.2214/AJR.12.8481. [DOI] [PubMed] [Google Scholar]
- Yezzi AJ, Prince JL. An Eulerian PDE approach for computing tissue thickness. IEEE Trans. Med. Imaging. 2003;22:1332–9. doi: 10.1109/TMI.2003.817775. [DOI] [PubMed] [Google Scholar]
- Yezzi A, Lilla Z, Kapur T. A variational framework for joint segmentation and registration Mathematical Methods in Biomedical Image Analysis, 2001. MMBIA 2001; IEEE Workshop on (Kauai, HI: IEEE).2001. pp. 44–51. [Google Scholar]
- Zbijewski W, De Jean P, Prakash P, Ding Y, Stayman JW, Packard N, Senn R, Yang D, Yorkston J, Machado A, Carrino J a, Siewerdsen JH. A dedicated cone-beam CT system for musculoskeletal extremities imaging: design, optimization, and initial performance characterization. Med. Phys. 2011;38:4700. doi: 10.1118/1.3611039. [DOI] [PMC free article] [PubMed] [Google Scholar]


