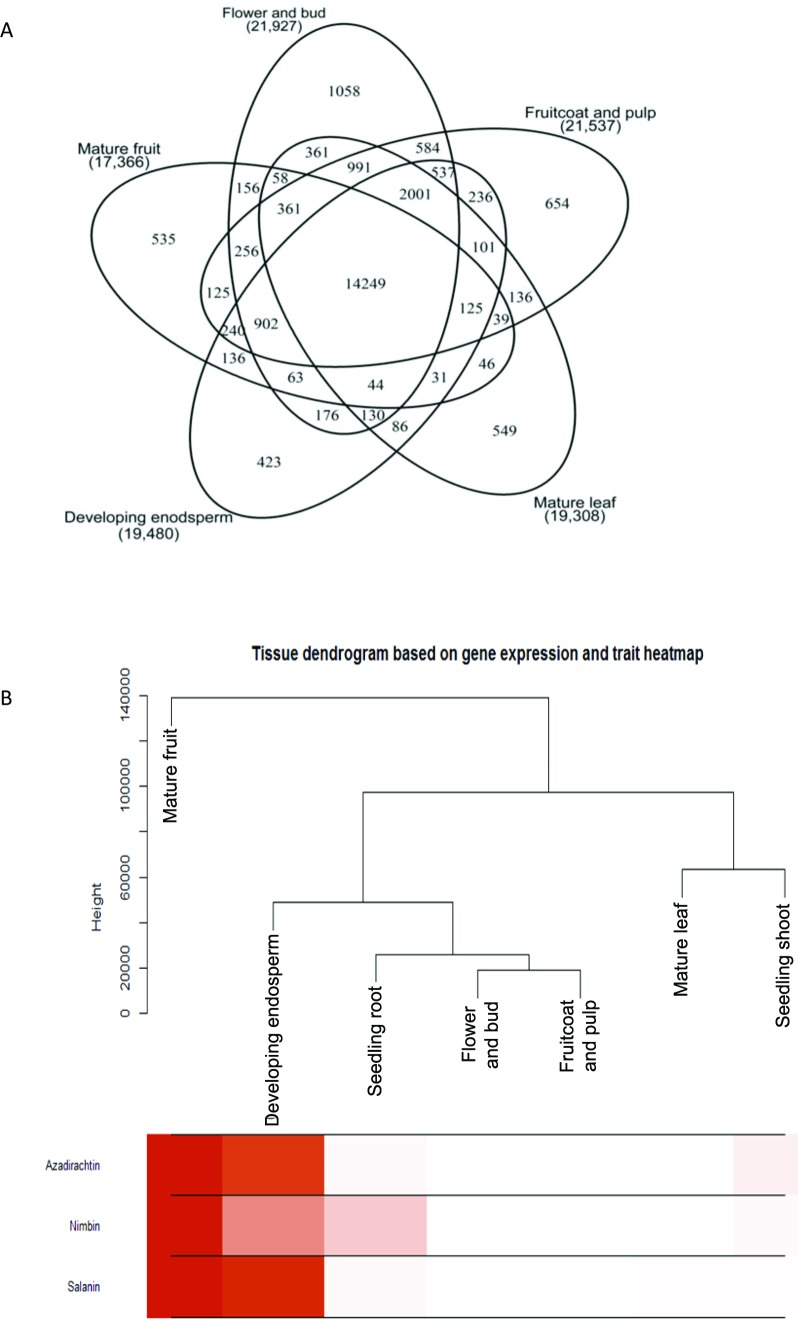
Figure 2. Gene expression and metabolite differences among different tissues of neem.
(A) Comparison of genes expressed commonly and uniquely in flower and bud, developing endosperm, mature leaf, mature fruit, fruit coat and pulp tissues. (B) Clustering dendrogram of samples based on gene expression values and corresponding metabolite concentration. The heat map shows the higher expression of the genes in specific tissue.

