

Abstract
Background:
Many lines of evidence suggest the role of serotonin transporter (SERT)-mediated reuptake of serotonin in the pathophysiology and treatment of major depressive disorder (MDD). This study aimed to examine whether the pretreatment of SERT binding potential or SERT binding ratio between terminal projection regions relative to the midbrain raphe nuclei was associated with treatment outcomes to SERT-targeted antidepressants.
Methods:
We recruited 39 antidepressant-naïve patients with MDD and 39 heathy controls. Positron emission tomography with N,N-dimethyl-2-(2-amino-4-[18F]fluorophenylthio)benzylamine (4-[18F]-ADAM) was used to measure in vivo SERT availability prior to antidepressant treatment. The 21-item Hamilton Depression Rating Scale (HDRS) was use to assess the severity of depression from baseline to week 6. All the patients with MDD had HDRS scores of 18 or more.
Results:
Pretreatment SERT binding in the thalamus and striatum positively correlated with an early reduction in HDRS scores at week 3. Nonresponders and dropout patients showed a proportionate reduction in SERT binding in the terminal projection regions and midbrain compared to healthy controls. In contrast, a disproportionate reduction in SERT binding in the terminal projection regions relative to midbrain was observed in responders.
Conclusions:
The results of this study suggested that a disproportionate reduction in SERT binding between terminal projection regions and midbrain may predict better treatment outcomes in patients with MDD.
Keywords: adherence, antidepressant response, major depressive disorder, positron emission tomography, serotonin transporter
Introduction
Many lines of evidence suggest that serotonin transporter (SERT) plays an important role in the pathophysiology of major depressive disorder (MDD) and the therapeutic actions of SERT-targeted antidepressants (Owens and Nemeroff, 1994; Mann, 2013) that exert their function by blocking the SERT, thereby increasing serotonin (5-hydroxytryptamine [5-HT]) levels in the synapses of serotonergic projection terminals. The involvement of SERT gene (solute carrier family 6 (neurotransmitter transporter), member 4 [SLC6A4]) variants such as 5-hydroxytryptamine transporter-linked polymorphic region [5-HTTLPR] and STin2 variable number tandem repeat in antidepressant efficacy has been widely investigated. However, the results are controversial and inconsistent across different ethnic populations (Ng et al., 2013). Furthermore, two meta-analysis studies reported a non-significant correlation between SLC6A4 variants and antidepressant efficacy (Kato and Serretti, 2010; Niitsu et al., 2013). Epigenetic evidence in peripheral leukocytes has shown a higher methylation rate of the SLC6A4 gene in drug-free patients with MDD, which may be associated with better therapeutic responses to antidepressants (Domschke et al., 2014; Okada et al., 2014). However, DNA methylation in peripheral blood cells may not be a reflection of that in the brain. Hence, in vivo imaging studies are necessary to examine the differences in SERT expression relative to the response to antidepressants.
The majority of SERT imaging studies have shown that patients with MDD have reduced SERT binding in a major depressive episode (MDE; Newberg et al., 2005, 2012; Parsey et al., 2006b; Reimold et al., 2008; Selvaraj et al., 2011; Ho et al., 2013; Gryglewski et al., 2014); however, there are some inconsistent reports of unaltered (Meyer et al., 2004a; Miller et al., 2013) or elevated SERT binding (Reivich et al., 2004; Cannon et al., 2007). Moreover, there are no differences in SERT binding in an euthymic state (Lehto et al., 2008; Hsieh et al., 2010) in patients with MDD compared to healthy controls. These findings suggest that a decrease in SERT binding occurs during the transition from a healthy state to a MDE, which then reverses during the transition from a MDE to the remitted (euthymic) state. Therefore, SERT binding could be a state marker for patients with MDD, and dynamic changes in SERT binding might be associated with pathophysiology of MDD and its treatment response.
Previous studies that examined the antidepressant occupancy of SERT and its relationship to treatment response have reliably shown an 80% striatal occupancy of the SERT after a 4-week treatment with selective serotonin reuptake inhibitors (SSRIs; Meyer et al., 2001, 2004b; Erlandsson et al., 2005; Klein et al., 2006; Parsey et al., 2006c). Nonetheless, these findings cannot explain the individual differences observed in antidepressant efficacy and treatment dropout rate. In addition, association studies of pretreatment brain SERT availability and treatment response have yielded diverse results (Kugaya et al., 2004; Miller et al., 2008; Lanzenberger et al., 2012), although this may be due to the difference in radioligands and treatment durations used. Moreover, these studies merely analyzed patients who had completed the treatment course; they did not compare SERT binding in patients with MDD who withdrew from treatment or in healthy controls.
Kugaya et al. (2004) first used single-photon emission computed tomography (SPECT) and the radioligand [(123)I]beta-CIT (2beta-carbomethoxy-3beta-(4-iodophenyl)tropane) ([123I]-β-CIT) to investigate the association between SERT binding and therapeutic efficacy. They found that a higher pretreatment SERT density in the diencephalon, including the thalamus and hypothalamus, correlated with a better response after a 4-week SSRI treatment. This result suggested that higher pretreatment availability and greater SSRI occupancy of the SERT might predict better treatment response. A later study that used positron emission tomography (PET) with the radioligand rel-(6R,10bS)-6-[4-(Methylsulfanyl)phenyl]-1,2,3,5,6,10b-hexahydropyrrolo[2,1-α]isoquinoline ([11C](+)McN5652; Miller et al., 2008) suggested that lower pretreatment SERT binding in depressed patients relative to healthy controls predict 1 year non-remitters. However, this finding was obtained in patients who were treated with a mixture of medications, including monoamine oxidase inhibitors, bupropion, lithium, and/or thyroid hormone supplementation, which may have consequently confounded the results (Miller et al., 2008).
The major drawback of these studies is the use of nonselective SERT radioligands, such as [123I]-β-CIT and [11C](+)McN5652. For example, [123I]-β-CIT has near equal affinity for the SERT and dopamine transporters (Meyer, 2007) and the mixed binding of the SERT and dopamine transporters may mask the true levels of SERT binding. Although [11C](+)McN5652 has higher selectivity for SERT compared with the other monoamine transporters, it has a low ratio of specific binding relative to free and nonspecific binding (Brust et al., 2006). A recent PET study that used the SERT-selective radioligand [(11C] 3-amino-4-(2-dimethylaminomethyl-phenylsulfanyl)benzonitrile ([11C]DASB) reported no association between pretreatment SERT binding levels and the 3-week SSRI treatment response in patients with MDD (Lanzenberger et al., 2012). Hence, it remained to be elucidated whether the levels of SERT in drug-naïve patients are associated with treatment response and premature withdrawal from antidepressant treatment. The SERT binding in axon-projecting areas can be modulated by the tonic firing of serotonergic neurons through 5-hydroxytryptamine (serotonin) receptor 1A [5-HT1A] autoreceptors. This has been suggested as a potential mechanism of antidepressant action (Lanzenberger et al., 2012). Therefore, a biomarker to predict SERT-targeted antidepressant efficacy should not be limited to regional SERT binding, but should also measure the interplay of SERT binding in terminal-projection regions and midbrain raphe nuclei.
In the present study, we used PET with the SERT-selective radioligand N,N-dimethyl-2-(2-amino-4-[18F]fluorophenylthio)benzylamine (4-[18F]-ADAM) to measure in vivo SERT binding in the human brain (Shiue et al., 2003; Huang et al., 2010; Huang et al., 2013). After completing the PET scan, patients with MDD were administered a SERT-targeted antidepressant and a 6-week naturalistic follow-up. The study aimed to examine whether pretreatment regional SERT binding or terminal projection region/midbrain SERT binding ratios correlated with an early reduction in depressive symptoms. Secondly, it aimed to investigate whether the pretreatment levels of regional SERT binding or SERT binding ratios predicted responders, nonresponders, and dropout patients.
Method
Participants
We used the Chinese version of the modified Schedule of Affective Disorder and the Schizophrenia-Lifetime (SADS-L) to screen psychiatric conditions in all participants (Endicott and Spitzer, 1978; Huang et al., 2004). The inclusion criteria for patients with MDD were as follows: (1) age between 20 to 65 years; (2) meeting MDD according to the Diagnostic and Statistical Manual of Mental Disorders, Fourth Edition, Text Revision (DSM-IV-TR); (3) a score of ≥18 on the 21-item Hamilton Depression Rating Scale (HDRS) as is indicative of moderate to severe MDD (Hamilton, 1960). The exclusion criteria for patients with MDD were as follows: (1) patients diagnosed with other comorbid Axis I and/or Axis II disorders, with the exception of patients with nicotine dependence; (2) HDRS score of <18, as is indicative of a mild degree of depression; (3) significant physical illness; (4) women who were pregnant or lactating; (5) previous head trauma with loss of consciousness, epilepsy, and/or thyroid disease; (6) previous exposure to psychotropic medication, such as, antidepressants, mood stabilizers, or antipsychotics.
Thirty-nine healthy volunteers were recruited from the community. They were free of past or present major or minor mental illness, as determined by the SADS-L semi-structured interview, and none of the first-degree relatives of the control subjects had a history of psychiatric disorders, substance abuse/dependence, or attempted suicide. Thirty-nine patients with MDD were recruited from Tri-Service General Hospital. PET imaging was arranged after informed consent was obtained. After completing a PET scan, patients with MDD began 6 weeks of treatment with an open-label SERT-targeted antidepressant [either paroxetine (20–40mg), venlafaxine (75–150mg), or duloxetine (30–60mg)] with a prospectively naturalistic follow-up. Some participants were recruited from a previous study (Yeh et al., 2014) and agreed to receive a naturalistic follow-up. The 21-item HDRS was used to assess the severity of depression from baseline to endpoint (week 6); these time points are often considered clinically important for treatment response (Papakostas et al., 2006; Lin et al., 2011; Lanzenberger et al., 2012). A responder was defined as a patient with a reduction ≧50% in the HDRS score between baseline and week 6, and a nonresponder was defined as a patient with a reduction <50% in the HDRS score between baseline and week 6. Adherence was defined as the act of filling a new prescription or refilling prescriptions on time, whereas nonadherence was defined as the discontinuation of filling or refilling prescriptions before the 6 week endpoint of treatment. The protocol was approved by the Institutional Review Board for the Protection of Human Subjects at the Tri-Service General Hospital in Taipei, Taiwan (Figure 1).
Figure 1.
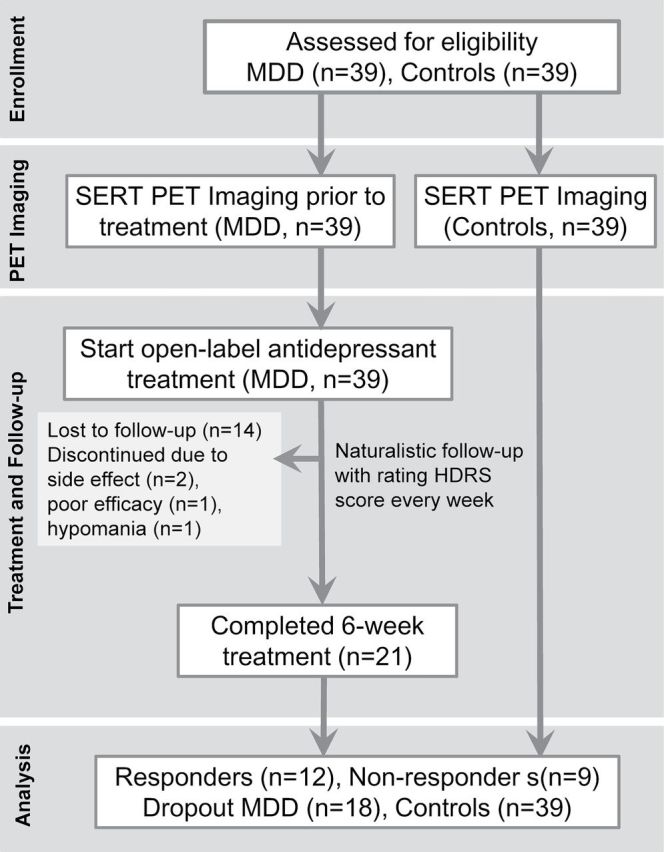
Protocol of positron emission tomography (PET) sudy in healthy controls andantidepressant-naïve subjects with major depressive disorder (MDD). HDRS, Hamilton Depression Rating Scale; SERT, serotonin transporter.
PET Procedure
The preparations for 4-[18F]-ADAM synthesis were carried out in our PET Current Good Manufacturing Practice laboratory with an automated synthesizer as previously described (Peng et al., 2008); the synthesizer was inspected by the Council of Atomic Energy and the Department of Health, Taiwan. All participants underwent a low-dose computed tomography (CT) scan (130 kVp, 50 mAs, 0.8 s tube rotation, 4mm slice collimation, and pitch 3) and then a static PET scan in three-dimensional mode using a BIOGRAPH PET/CT scanner (Biograph Duo, Siemens). Total PET imaging began at 120 to 140min (total 20min) after intravenous bolus injection of 7.94±1.13 mCi 4-[18F]-ADAM. This scanner had a transverse field-of-view of 58.5cm, an axial field-of-view of 15.5cm, and a spatial resolution of 4.8mm. PET images were reconstructed in a 512×512×64 matrix with a pixel size of 0.519×0.519×2.4mm using the ordered subset expectation maximization method (six iterations and 16 subsets) with a Gaussian filter of 3mm full-width half maximum.
PET Data Acquisition
PET images were analyzed with commercial PMOD software for Windows (version 3.0, PMOD Technologies Ltd). The PET image from each subject was automatically co-registered with the corresponding individual CT scan and was then manually adjusted by an experienced physician. The individual CT images provide an anatomical reference, and regions of interest (ROIs) were defined on reconstructed and summated PET images. The ROIs were drawn over the midbrain, striatum, thalamus, and prefrontal cortex (PFC), where loci of serotonergic cell bodies (e.g. midbrain) and the main projection regions (e.g. striatum, thalamus, PFC) could be found. We used the cerebellum as a background reference because of its low SERT concentration when compared to other brain regions. To reduce the confounding effects of SERT binding in the cerebellum, we only delineate the posterior half of the cerebellar cortex and exclude the white matter and vermis. The non-displaceable binding potential (BPND) of 4-[18F]-ADAM was quantified using a ratio method by comparing a specifically-bound radioligand to a nondisplaceable radioligand in brain tissue at equilibrium as previously described (Huang et al., 2013; Yeh et al., 2014). We applied the time period at 120–140min for the transient equilibrium ratio model. The BPND of 4-[18F]-ADAM in the target region was calculated by subtracting the tissue radioligand activity in the nondisplaceable region (CCB) from the tissue radioligand activity in the target region (CROI), and then dividing the result by the tissue radioligand activity in the nondisplaceable region. The equation was defined as follows: BPND = binding potential’ (BP’) = (CROI- CCB)/CCB (Ichise et al., 2001; Innis et al., 2007). The investigator using PMOD software to analyze images was blinded to all participant information.
Statistical Analysis
The continuous variables of the demographic data between groups were analyzed with either a Student’s t-test or one-way analysis of variance. Nominal differences in the demographic data between groups were examined with the Pearson χ2 test or Fisher’s exact test. BPND data were analyzed by a linear mixed-effects model (McCulloch et al, 2008), with brain region and diagnostic group as fixed effects and subjects as the random effect (Parsey et al., 2006a, 2006b; Miller et al., 2008; Miller et al., 2013; Yeh et al., 2014). To assess the effects of demographic data, we successively set age, sex, smoking status, and body mass index (BMI) as other fixed effects in the linear mixed-effects models. A Bonferroni correction was used for multiple comparisons in the post hoc analysis. We used Spearman’s rank correlation to analyze the relationship between pretreatment regional levels of SERT BPND and the reduction in the HDRS scores. A p-value < 0.05 was considered statistically significant (two-tailed).
A nonparametric analysis was applied in order to examine the differences in the pretreatment levels of regional SERT BPND and SERT BPND ratios in the terminal projection area/midbrain raphe nuclei among depressed subgroups and healthy controls. Due to the comparisons of SERT binding in the four ROIs and the three SERT binding ratios among the different groups (controls, responders, nonresponders, and dropouts), a conservative p-value of less than 0.05/7 = 0.007 was considered significant for multiple comparisons. We used Hedges’ g to compute the effect size between two groups. Small, medium, and large effect sizes were defined, respectively, as 0.2 ≦ Hedges’ g < 0.5, 0.5 ≦ Hedges’ g < 0.8, and Hedges’ g ≧ 0.8. Receiver operator characteristic (ROC) curves were obtained and the area under the curve (AUC) was calculated for each regression model. All data were analyzed with SPSS software for Windows (version 17, SPSS).
Results
Demographic and Clinical Characteristics
The characteristics of all of the participants are summarized in Table 1. The age of the controls ranged from 21–62 years [mean ± standard deviation (SD), 32.3±8.3 years; 21 men and 18 women) and the age of the patients with MDD ranged from 20–60 years (mean ± SD, 34.3±11.5 years; 20 men and 19 women). Twenty-one patients with MDD completed the 6-week course of antidepressant treatment, and 18 patients with MDD dropped out (Figure 1). Among the 21 patients with MDD who completed the 6-week treatment course, the response rate was 57.1%. There were no significant differences in age, onset age, sex, BMI, smoking status, education years, or baseline HDRS scores among the responders, nonresponders, and dropout patients with MDD. A higher number of MDEs were seen in the dropout group than in the completed-treatment group. There were no significant differences in the mean injection dose of 4-[18F]-ADAM among the groups. The types of antidepressants and their mean dosages used in the present study did not significantly differ among the responders, nonresponders, and dropout patients (Supplemental Table 1).
Table 1.
Clinical and demographic characteristics of the participants
| Healthy controls (n = 39) |
MDD (n =39) |
Healthy controls vs MDD | MDD (n = 39) | Responders vs nonresponders vs dropout MDD | |||||
|---|---|---|---|---|---|---|---|---|---|
| Responders (n = 12) |
Nonresponders (n = 9) |
Dropout MDD (n = 18) |
|||||||
| %, n | %, n | χ2 (df = 1) | p | %, n | %, n | %, n | χ2 (df = 2) | p a | |
| Male, % (male/female) | 38.9% (21/18) | 51.3% (20/19) | 0.05 | 0.82 | 66.7% (8/4) | 55.6% (5/4) | 38.9 % (7/11) | 2.28 | 0.33 |
| Smoker, % (smoker/nonsmoker) | 12.8% (5/34) | 41.0% (16/23) | 7.89 | 0.005** | 50.0% (6/6) | 44.4% (4/5) | 33.3% (6/12) | 0.88 | 0.70 |
| First episode, % (first/recurrent) | - | 56.4% (22/17) | - | - | 66.7% (8/4) | 77.8% (7/2) | 38.9 (7/11) | 4.22 | 0.13 |
| Antidepressant | |||||||||
| Paroxetine | - | 22 (56.4) | - | - | 9 (75.0) | 6 (66.7) | 7 (38.9) | 4.56 | 0.30 |
| Venlafaxine | - | 15 (38.5) | 3 (25.0) | 3 (33.3) | 9 (50.0) | ||||
| Duloxetine | - | 2 (5.1) | 0 | 0 | 2 (11.1) | ||||
| Mean ± SD | Mean ± SD | t (df = 1) | p | Mean ± SD | Mean ± SD | Mean ± SD | F (df = 2) | p | |
| Age (years) | 32.3±8.3 | 34.3±11.5 | -0.88 | 0.38 | 35.1±13.2 | 33.4±8.5 | 34.2±12.1 | 0.05 | 0.95 |
| Onset age (years) | - | 28.4±9.8 | - | - | 31.1±10.9 | 31.8±7.6 | 24.9±9.3 | 2.24 | 0.12 |
| Education (years) | 16.5±2.1 | 13.9±2.7 | 4.65 | <0.001*** | 14.2±1.7 | 14.6±1.8 | 13.2±3.5 | 0.85 | 0.44 |
| Body mass index (kg/m2). | 23.4±3.5 | 22.7±3.5 | 0.85 | 0.40 | 23.5±4.1 | 23.1±3.4 | 22.0±3.2 | 0.70 | 0.51 |
| Number of MDE | - | 1.7±0.9 | - | - | 1.4±0.7 | 1.2±0.4 | 2.1±1.1 | 3.72 | 0.03* |
| Number of suicide attempts | - | 0.9±1.3 | - | - | 0.4±0.9 | 1.0±1.5 | 1.1±1.5 | 1.05 | 0.36 |
| Baseline HDRS score | 0.4±1.1 | 27.8±5.4 | -30.8 | <0.001*** | 26.5±5.1 | 26.8±4.1 | 29.2±6.2 | 1.07 | 0.35 |
| Dose of 4-[18F]-ADAM (mCi) | 8.1±1.2 | 7.8±1.0 | 1.28 | 0.20 | 7.8±0.8 | 8.1±0.9 | 7.6±1.2 | 0.60 | 0.55 |
MDD, major depressive disorder; MDE, major depressive episode; HDRS, 21-item Hamilton Depression Rating Scale; SD, standard deviation; df: degree of freedom. Bold numbers indicate significance.
a Fisher’s exact test.
*p<0.05, **p<0.01, ***p<0.001 is considered as significant.
Possible Effects of Demographic Data and Current MDD on Regional SERT Binding
A scatter plot of the BPND values from the four ROIs in the healthy controls and depressed subgroups is presented in Figure 2. By using linear mixed-effects models with brain region and diagnostic group as the fixed effects and subjects as the random effect, we found a significant effect of brain region on SERT binding (F = 348.953, df = 3,231, p < 0.001). The values of BPND, in the order of highest to lowest, in the four ROIs was midbrain > thalamus > striatum > PFC. Across the four ROIs, BPND was significantly different according to the diagnosis of current MDD (F = 11.357, df = 1,76, p = 0.001). A post hoc analysis demonstrated significantly lower BPND values in the midbrain (t = -3.480, df = 1,152, uncorrected p < 0.001), thalamus (t = -4.204, df = 1,152, uncorrected p < 0.001), and striatum (t = -2.821, df = 1,152, uncorrected p = 0.005) in patients with MDD compared with healthy controls. Furthermore, the effect of current major depression on BPND remained significant in the midbrain, thalamus, and striatum after Bonferroni corrections for multiple comparisons (Bonferroni-adjusted p = 0.003, <0.001, and 0.022, respectively). To further assess the effects of the demographic data, we successively set age, sex, smoking status, and BMI as other fixed effects in the linear mixed-effects models. Across the four ROIs, there was no effect of age (F = 1.564, df = 1,75, p = 0.215) or sex (F = 1.732, df = 1,75, p = 0.192) on SERT binding in the combined depressed and control groups. BMI (F = 0.884, df = 1,75, p = 0.350) did not significantly influence SERT binding, and there was no effect of cigarette smoking on SERT binding (F = 0.129, df = 1,75, p = 0.720).
Figure 2.
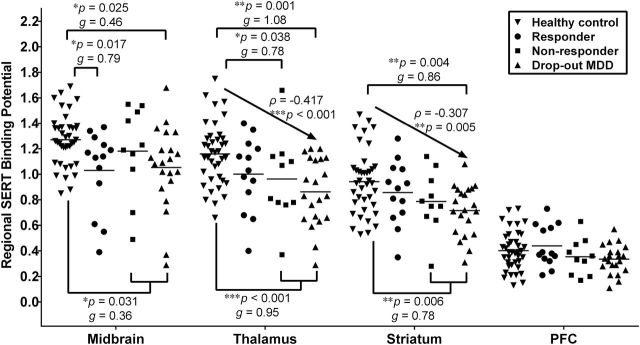
Scatter plots of pretreatment levels of serotonin transporter (SERT) binding between healthy controls (n = 39) and subjects with major depressive disorder (MDD; n = 39) that were categorized by their outcomes to 6-week antidepressant treatment: responders (n = 12), nonresponders (n = 9), and dropout subjects (n = 18). The horizontal bar indicates the mean value of SERT binding (*p < 0.05, **p < 0.01, ***p < 0.001 compared to healthy controls). Small, medium, and large effect sizes were defined respectively as 0.2 ≦ Hedges’ g < 0.5, 0.5 ≦ Hedges’ g < 0.8, and Hedges’ g ≧ 0.8. We coded healthy controls, responders, nonresponders, and dropout subjects as an ordinal variables 0, 1, 2, and 3, respectively. The Spearman’s rank correlations between the rank order and SERT binding were ρ = -0.417, p < 0.001 for thalamus; ρ = -0.307, p = 0.005 for striatum. PFC, prefrontal cortex.
Because nicotine dependence might confound the results, we further applied a stratification analysis according to cigarette smoking status. A significant effect of brain region on SERT binding in smokers (F = 52.467 df = 3,60, p < 0.001) and nonsmokers (F = 336.854, df = 3,168, p < 0.001) remained. A significant effect of the diagnosis of current MDD on SERT binding in smokers (F = 7.960, df = 1,19, p = 0.011) and nonsmokers (F = 5.422, df = 1,55, p = 0.024) remained. There was no effect of age, sex, or BMI on SERT binding across the four ROIs in smokers or in nonsmokers (all p-values > 0.05).
The Association of Regional SERT BPND or Projection Area/Midbrain SERT BPND Ratios with Early Response to Antidepressants
Within the completed treatment group (n = 21), we observed that SERT binding in the thalamus (Spearman’s ρ coefficiency = 0.518, p = 0.016) and striatum (Spearman’s ρ coefficiency = 0.438, p = 0.047) positively correlated with a reduction in HDRS scores at week 3 (Figure 3, Supplemental Table 2) but not at the other weeks. We calculated the SERT binding ratio by dividing the SERT BPND in the terminal projection area by the SERT BPND in the midbrain. The projecting areas/midbrain SERT BPND ratios did not show any correlations with reductions in HDRS scores (Supplemental Table 2).
Figure 3.
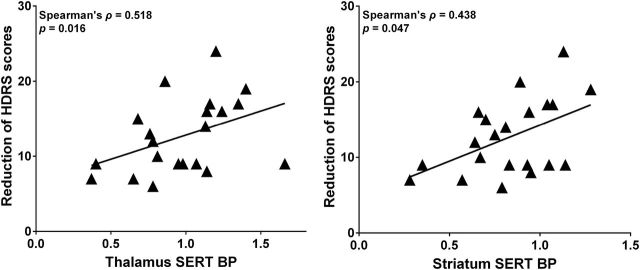
Correlation between the reduction of Hamilton Depression Rating Scale (HDRS) score at early stage (week 3) and pretreatment levels of serotonin transporter (SERT) binding potential (BP) in the thalamus and striatum (n = 21).
The Association of Regional SERT BPND or Projection Area/Midbrain SERT BPND Ratios in Association with Outcome to Antidepressants at Week 6
The SERT BPND did not differ among responders, nonresponders, and dropout patients across the four ROIs. However, SERT binding in the thalamus and striatum was significantly lower in dropout patients compared to healthy controls (z = -3.35, p = 0.001 for thalamus; z = -2.87, p = 0.004 for striatum). By coding the healthy controls, responders, nonresponders, and dropout patients as an ordinal variable in the order of 0, 1, 2, and 3, respectively, SERT binding negatively correlated with the ordinal variable in the thalamus (ρ = -0.417, p < 0.001) and striatum (ρ = -0.307, p = 0.005, Figure 2). This indicated a trend association in reduced SERT availability from healthy control to responder to nonresponders to dropout patients.
Furthermore, we compared the projecting areas/midbrain SERT BPND ratios among responders, nonresponders, and dropout patients, and found that there were significant differences in thalamus/midbrain and striatum/midbrain SERT BPND ratios (Figure 4). A post hoc test revealed that responders had a higher striatum/midbrain SERT binding ratio compared with nonresponders (z = -1.99, p = 0.047). Because SERT BPND and SERT BPND ratios did not differ between nonresponders and dropout patients, we combined these two groups into the “other” group (n = 27). In comparison with the “other” group, responders had higher thalamus/midbrain, striatum/midbrain, and PFC/midbrain binding ratios (all p-values < 0.05). After Bonferroni corrections for multiple testing, the significance remained in the thalamus/midbrain SERT binding ratio between the responder group and the “other” group. Moreover, the PFC/midbrain binding ratio was higher in the responders than in the healthy controls (z = -2.74, p = 0.006). There were no differences in the SERT BPND ratios among the healthy controls, nonresponders, and dropout patients.
Figure 4.
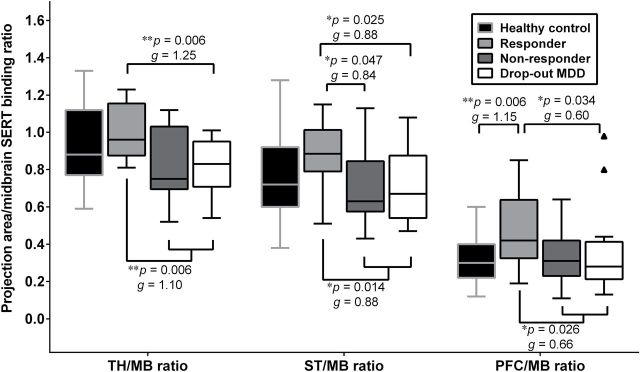
The box-and-whisker plot of pretreatment serotonin transporter (SERT) binding ratios in the terminal projection regions relative to the midbrain raphe nuclei among healthy controls (n = 39), responders (n = 12), nonresponders (n = 9), and dropout subjects (n = 18) with major depressive disorder (MDD). The short horizontal bar within the box indicates the median value of SERT binding ratios (*p < 0.05, **p < 0.01 compared to responders). The interquartile range (IQR), which is the length of the box, can be used as a measure of how spread-out the values are. There were two outliers in the PFC/MB ratio in dropout subjects. Small, medium, and large effect sizes were defined respectively as 0.2 ≦ Hedges’ g < 0.5, 0.5 ≦ Hedges’ g < 0.8, and Hedges’ g ≧ 0.8. MB, midbrain; PFC, prefrontal cortex; ST, striatum; TH, thalamus.
The Prediction of Responders Based on Projection Area/Midbrain SERT BPND Ratios
The ROC curve and the AUC are presented in Figure 5A and B. The AUC for the logistic regression models for each projection area/midbrain SERT BPND ratios is presented in Table 2. The striatum/midbrain SERT BPND ratio predicted responders versus nonresponders (AUC = 0.76, p = 0.047, Table 2, Figure 5A). We found that the thalamus/midbrain SERT BPND ratio can distinguish the responder group from the “other” group (AUC = 0.78., p = 0.006, Table 2, Figure 5B). Both the striatum/midbrain (AUC = 0.75, p = 0.014) and PFC/midbrain (AUC = 0.73, p = 0.026) SERT BPND ratios predicted the responders versus the “other” group. The predictive power of SERT BPND ratios was fair because all the AUC values were greater than 0.7.
Figure 5.
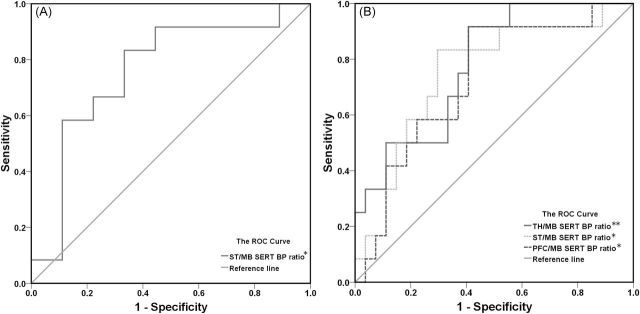
Prediction of (A) responders versus nonresponders; (B) responders versus “other” group (combined nonresponders and dropout subjects) using receiver operator characteristic (ROC) curves and the area under the curve (AUC) based on serotonin transporter (SERT) binding ratios (*p < 0.05, **p < 0.01). BP, binding potential; MB, midbrain; PFC, prefrontal cortex; ST, striatum; TH, thalamus.
Table 2.
Predictive Ability of Serotonin Transporter (SERT) Non-displaceable Binding Potential (BPND) Ratios to Distinguish Responders from Nonresponders or “Other” Group.
| Responders vs nonresponders (total n = 21) | Responders vs other group (total n = 39) | |||||||||||
|---|---|---|---|---|---|---|---|---|---|---|---|---|
| Cutoff point | Sensitivity (%) | Specificity (%) | Predictive power (%) | AUC (%) | p value | Cutoff point | Sensitivity (%) | Specificity (%) | Predictive power (%) | AUC (%) | p value | |
| TH/MB ratio | 0.78 | 100 | 56 | 78 | 73 | 0.076 | 0.86 | 92 | 59 | 75 | 78 | 0.006** |
| ST/MB ratio | 0.76 | 83 | 67 | 75 | 76 | 0.047* | 0.77 | 83 | 70 | 77 | 75 | 0.014* |
| PFC/MB ratio | 0.31 | 92 | 56 | 74 | 71 | 0.102 | 0.31 | 92 | 59 | 75 | 73 | 0.026* |
The cutoff point of SERT BP ratios as the predictor by plotting the proportion of true positive result (sensitivity) versus the proportion of false-positive results (1-specificity). The area under the curve (AUC) indicates area under the receiver operator characteristic (ROC) curves (*p < 0.05, **p < 0.01). Other group indicates combined nonresponders and dropout subjects. MB, midbrain; PFC, prefrontal cortex; ST, striatum; TH, thalamus.
Discussion
Our naturalistic cohort study of 4-[18F]-ADAM PET imaging in antidepressant-naïve patients with MDD demonstrated that greater pretreatment levels of SERT binding in the thalamus and striatum are associated with a greater reduction in HDRS scores at the 3-week stage of treatment. Our findings regarding the prediction of early improvement in depressive symptoms was in accordance with those of a previous study that used SPECT with the nonspecific SERT radioligand [123I]-β-CIT (Kugaya et al., 2004). They showed that higher levels of SERT binding in the diencephalon, including the thalamus and hypothalamus, predict a better 4-week treatment response to SSRIs. However, our findings were inconsistent with those of a study that used PET with the SERT-selective radioligand [11C]DASB (Lanzenberger et al., 2012) and that revealed no association between any regional SERT binding and reduction in HDRS scores at week 3. Although we found that the SERT BPND was lower in the midbrain, thalamus, and striatum in patients with MDD compared with healthy controls, similar to the findings of previous reports (Newberg et al., 2005, 2012; Parsey et al., 2006b; Reimold et al., 2008; Selvaraj et al., 2011; Ho et al., 2013; Nye et al., 2013; Gryglewski et al., 2014), we did not find any differences in SERT BPND across the four ROIs between responders and nonresponders. This suggested that pretreatment SERT availability might contribute to the initial change in HDRS scores in the first 3 weeks; nevertheless, the final therapeutic efficacy may be regulated by another mechanism.
As previous studies did not recruit healthy controls (Kugaya et al., 2004; Lanzenberger et al., 2012), the differences among responders, nonresponders, and healthy controls could not be investigated. To the best of our knowledge, this is the first study to explore whether regional SERT binding and SERT binding ratios differ between healthy controls and depressed subgroups that were categorized by their outcomes to antidepressant treatment, including responders, nonresponders, and dropout patients. In the present study, we observed a trend towards reduced SERT availability, in order, from healthy controls to responders to nonresponders to dropout patients. Furthermore, the SERT BPND ratios between the terminal projection regions and the midbrain in healthy controls were nearly equal to those in nonresponders and dropout patients (Figure 4). This finding indicated that both nonresponders and dropout patients demonstrated a proportionate decrease in SERT BPND in the terminal projection regions and midbrain compared with controls. In contrast, responders showed a pronounced decline in SERT BPND in the midbrain raphe nuclei and a disproportionally smaller decline in SERT BPND in serotonergic terminal projection regions compared to controls. Therefore, greater SERT BPND ratios in the projection regions (e.g. thalamus and striatum) relative to the midbrain might predict better treatment outcomes to SERT-targeted antidepressants at week 6.
This concept was partially in accordance with the findings of an earlier PET imaging study by Lanzenberger et al. (2012) that showed that higher SERT binding in the projection regions (amygdala and habenula) relative to the median raphe nuclei was beneficial for SSRI therapeutic efficacy and that these SERT binding ratios positively correlated with a reduction in HDRS scores at week 3. We found that higher SERT binding ratios (thalamus/midbrain and striatum/midbrain) might predict SERT-targeted antidepressant efficacy at week 6. The inconsistent results at the various response times (week 3 versus week 6) might be due to differences in the antidepressants used, because antidepressants have different efficacies and response times (Cipriani et al., 2009). Previous studies that defined 3 or 4 weeks as the treatment endpoints might have underestimated the number of responders (Kugaya et al., 2004; Lanzenberger et al., 2012). Therefore, our study analyzed antidepressant-naïve depressed patients and followed them for 6 weeks, which might be a more complete treatment course.
It was unclear why a disproportionate reduction of SERT BPND between the projection regions and the midbrain raphe nuclei was associated with better clinical response after 6 weeks of antidepressant therapy in drug-naïve patients with MDD. We propose three possible mechanisms to explain this finding. First, the down-regulation of SERT in the serotonergic cell bodies and axon terminals takes longer than 4–6 weeks after administration of an antidepressant (Mirza et al., 2007; Descarries and Riad, 2012). Higher pretreatment levels of SERT binding in projection regions (e.g. thalamus and striatum) may lead to greater occupancy by the antidepressant (Kugaya et al., 2004; Baldinger et al., 2014), thereby rapidly enhancing 5-HT levels in the thalamus and striatum, which could ameliorate depressive symptoms at an early stage. Lower pretreatment levels of SERT BPND in the midbrain might be a compensatory response to the fewer numbers of serotonergic axons and neurons in major depression in order to overcome the lower levels of 5-HT (Arango et al., 2002; Austin et al., 2002). The responders showed the lowest SERT binding in the midbrain and a smaller decline in SERT binding in projection regions, which suggested that responders had a superior compensatory response and neuronal plasticity in response to lower serotonin neurotransmission among patients with major depression (Celada et al., 2001; Artigas, 2013). These patients might therefore have a better response to antidepressants. Second, higher pretreatment levels of SERT BPND in the thalamus or striatum could be moderated by inhibitory gamma-aminobutyric acid or excitatory glutaminergic inputs from the cortex and suppressed by 5-HT1A autoreceptors in order to regulate the serotonergic neuron firing rate. After initiating SERT-targeted antidepressants (Artigas, 2013), the serotonergic tonic firing rate would be suppressed through 5-HT1A autoreceptors in the midbrain raphe nuclei (Celada et al., 2001), which would consequently activate serotonergic neurons and promote 5-HT neurotransmission in terminal areas (Descarries and Riad, 2012). Therefore, the unequal reduction in the SERT density in terminal projection regions relative to the midbrain might be involved in therapeutic efficacy in MDD, and could aid in predicting the treatment outcomes of patients with MDD. Third, microRNA expression are down-regulated in the terminal projection regions in patients with depression and suicide (Smalheiser et al., 2012; Serafini et al., 2014) and up-regulated after the administration of antidepressants (Baudry et al., 2010; Issler et al., 2014). These findings suggest that microRNA might modulate the level of SERT and 5-HT1A receptor in response to antidepressant treatment.
Our naturalistic follow-up study raised the issue of nonadherence to antidepressant treatment. The 53.8% complete-treatment rate in our study was in line with previous studies showing that approximately 55% of the patients with depression maintained their complete antidepressant therapy during the first month, whereas the other patients prematurely discontinued medication (Brown et al., 2005; Wu et al., 2013). Adherence to the antidepressant is essential for therapeutic efficacy in patients with MDD (Demyttenaere, 1998; Pampallona et al., 2002). However, earlier studies investigating adherence to antidepressants have focused on personal insight, education level, and concerns about the antidepressant side effects without assessing the biological factors in dropout patients (Pampallona et al., 2002; Vergouwen et al., 2003). Our results showed that SERT BPND ratios did not differ between dropout patients and nonresponders, but a trend of greater decline in regional SERT binding was noted in dropout patients compared to nonresponders. This implied that the withdrawal from antidepressant in patients with major depression might not only be due to poor insight into the illness and medication but also because of a poor response to antidepressants, similar to nonresponders. Furthermore, a significant difference in the SERT BPND ratios was observed between dropout patients and responders. Therefore, the SERT BPND ratios between the terminal projection regions and the midbrain raphe nuclei might be a potential biomarker for prediction of responders versus nonresponders and dropouts. Because the predictive power of the SERT BPND ratios was fair (75%–78%, Table 2), this biological evidence may help clinicians to more closely monitor those patients who have low thalamus/midbrain and striatum/midbrain SERT BPND ratios while they are on antidepressant therapy.
Finally, the basal ganglia, including the striatum, are strongly interconnected with the cortex, thalamus, brain stem, and other brain areas. Among these, the corticobasal ganglia pathway plays a crucial role in the neuropathology of mood disorders (Marchand et al., 2012) and reward prediction (Tanaka et al., 2004), and could contribute to the response and decision of antidepressant adherence. Serotonin levels have been suggested to modulate cerebral glucose metabolism in patients with major depression (Smith et al., 2002, 2009; Geday et al., 2005). Regional SERT density can affect 5-HT levels in order to modulate glucose uptake in the subcortical and cortical regions, thus influencing the response and adherent behaviors of patients to antidepressants (Kennedy et al., 2007; Milak et al., 2009). As we previously mentioned, the higher projection region/midbrain BPND ratios distinguished responders from nonresponders and dropout patients, and the disproportional reduction in SERT binding between terminal projection regions and the midbrain might be involved in the treatment outcome through the regulation of cerebral glucose metabolism. Although nicotine can inhibit 5-HT reuptake and stimulate 5-HT release in platelets (Rausch et al., 1989), which potentially increases SERT levels, previous imaging studies did not show a significant association between cigarette smoking and SERT availability (Staley et al., 2001; Ruhe et al., 2009; Erritzoe et al., 2010; Ho et al., 2013). Consistent with these studies, we did not find any associations between cigarette smoking and SERT binding.
A few limitations in our study should be addressed. First, we did not measure the plasma levels of the antidepressant or SERT occupancy by the antidepressant during the 6-week treatment course. The association between SERT occupancy by the antidepressant and antidepressant concentration could not be further analyzed. However, previous studies had shown that pretreatment SERT binding levels positively correlated with antidepressant occupancy (Baldinger et al., 2014). Hence, our result based on pretreatment SERT availability was able to predict the response to SERT-targeted antidepressants. Second, we recruited patients with MDD and treated them with common SERT-targeted antidepressants, including SSRIs, such as paroxetine, and serotonin-norepinephrine reuptake inhibitors (SNRIs), such as venlafaxine and duloxetine. The different antidepressants that we used in the present study may have had different affinities to norepinephrine transporter (NET). An antidepressant with a higher NET/SERT affinity ratio, such as duloxetine, might have a higher blockade of NET compared with other SNRIs and SSRIs. Thus, our prediction based on SERT binding might merely explain the SERT effect and not the NET effect. We could not rule out the effect of NET in the present study (Owens et al., 2008; Nogami et al., 2013), because pretreatment levels of NET binding and NET occupancy by the antidepressants might also contribute to therapeutic efficacy. Third, the dosage may also confound the outcome of antidepressant treatment. However, both SSRIs and SNRIs at their minimal standard therapeutic dosages show around 80% occupancy of the SERT (Meyer et al., 2001, 2004b), and higher dosages would result in a plateau effect of SERT occupancy. Even though the doses of the SERT-targeted antidepressants varied, the SERT occupancy by the antidepressants should be consistent with those in previous studies. In contrast, the occupancy of NET by SNRIs had a dose-dependent effect (Owens et al., 2008), and dosage of SNRIs may influence the therapeutic efficacy. Nevertheless, we did not observe any dosage differences among different types of antidepressants between responders and nonresponders. Fourth, our small sample size (n = 78) was insufficient to explore the association of SLC6A4 variant effects with each group’s SERT BPND. However, previous postmortem (Mann et al., 2000) and in vivo imaging studies (Parsey et al., 2006a; Ho et al., 2013) have shown no significant differences in 5-HTTLPR and STin2 variable number tandem repeat polymorphisms on SERT binding. Therefore, in vivo SERT availability might account for treatment response more than SLC6A4 variants in patients with MDD. Nevertheless, the effects of other genes or epigenetic modulations on SERT binding in the brain should be considered. Fourth, psychosocial problems and personality traits may also contribute to treatment response (Kaneda et al., 2011); however, we did not discuss this in the present study.
Conclusion
Taken together, our study provides new insight into pretreatment SERT availability and its association with treatment outcomes in patients with major depression. The disproportionate reduction in SERT binding in the projection area and in the midbrain raphe nuclei may be attributed to a response to antidepressants, whereas a proportionate reduction in SERT density may be associated with nonresponse and nonadherence to antidepressants. These findings may help clinicians to predict which patients may be nonresponsive or reluctant to adhere to SERT-targeted antidepressants treatment. For such patients, the use of other treatment strategies, including augmentation, use of antidepressants with other mechanisms of action, or psychotherapy, is recommended. Supplemental Table 1. Dosages of antidepressants used in present study. Supplemental Table 2. Correlation between the reduction of HDRS score at each week and pretreatment regional SERT binding and SERT binding ratios.
Statement of Interest
None.
Supplementary Material
For supplementary material accompanying this paper, visit http://www.ijnp.oxfordjournals.org/
Acknowledgements
This study was supported by grants from National Science Council of Taiwan (NSC97-2314-B-016-001-MY2, NSC99-2314-B-016-019-MY3) to Dr S-Y Huang (NSC100-2314-B-016-036-MY3) to Dr W-S Huang, from Tri-Service General Hospital (TSGH-C98-09-S02, TSGH-C99-008-9-S02, TSGH-C100-009-008-9-S02) to Drs Yeh and Chen, (TSGH-C101-122, TSGH-C102-120, TSGH-C103-133) to Dr S-Y Huang, and from Medical Affairs Bureau, Ministry of National Defense, Taiwan (DOD99-C04-04, DOD100-C09-03) to Drs Yeh and Chen, (MAB101-51, MAB-102–68) to Dr S-Y Huang. We would like to thank Miss Mei-Chen Shih and Yun-Hsin Lin for their assistance in the preparing this manuscript.
References
- Arango V, Underwood MD, Mann JJ. (2002). Serotonin brain circuits involved in major depression and suicide. Prog Brain Res 136:443–453. [DOI] [PubMed] [Google Scholar]
- Artigas F. (2013). Serotonin receptors involved in antidepressant effects. Pharmacol Ther 137:119–131. [DOI] [PubMed] [Google Scholar]
- Austin MC, Whitehead RE, Edgar CL, Janosky JE, Lewis DA. (2002). Localized decrease in serotonin transporter-immunoreactive axons in the prefrontal cortex of depressed subjects committing suicide. Neuroscience 114:807–815. [DOI] [PubMed] [Google Scholar]
- Baldinger P, Kranz GS, Haeusler D, Savli M, Spies M, Philippe C, Hahn A, Hoflich A, Wadsak W, Mitterhauser M, Lanzenberger R, Kasper S. (2014). Regional differences in SERT occupancy after acute and prolonged SSRI intake investigated by brain PET. Neuroimage 88:252–262. [DOI] [PubMed] [Google Scholar]
- Baudry A, Mouillet-Richard S, Schneider B, Launay JM, Kellermann O. (2010). miR-16 targets the serotonin transporter: a new facet for adaptive responses to antidepressants. Science 329:1537–1541. [DOI] [PubMed] [Google Scholar]
- Brown C, Battista DR, Bruehlman R, Sereika SS, Thase ME, Dunbar-Jacob J. (2005). Beliefs about antidepressant medications in primary care patients: relationship to self-reported adherence. Med Care 43:1203–1207. [DOI] [PubMed] [Google Scholar]
- Brust P, Hesse S, Muller U, Szabo Z. (2006). Neuroimaging of the serotonin trasporter - possibilities and pitfalls. Curr Psychiatry Rev 2:111–149. [Google Scholar]
- Cannon DM, Ichise M, Rollis D, Klaver JM, Gandhi SK, Charney DS, Manji HK, Drevets WC (2007) Elevated serotonin transporter binding in major depressive disorder assessed using positron emission tomography and [11C]DASB; comparison with bipolar disorder. Biol Psychiatry 62:870–877. [DOI] [PubMed] [Google Scholar]
- Celada P, Puig MV, Casanovas JM, Guillazo G, Artigas F. (2001). Control of dorsal raphe serotonergic neurons by the medial prefrontal cortex: Involvement of serotonin-1A, GABA(A), and glutamate receptors. J Neurosci 21:9917–9929. [DOI] [PMC free article] [PubMed] [Google Scholar]
- Cipriani A, Furukawa TA, Salanti G, Geddes JR, Higgins JP, Churchill R, Watanabe N, Nakagawa A, Omori IM, McGuire H, Tansella M, Barbui C. (2009). Comparative efficacy and acceptability of 12 new-generation antidepressants: a multiple-treatments meta-analysis. Lancet 373:746–758. [DOI] [PubMed] [Google Scholar]
- Demyttenaere K. (1998). Noncompliance with antidepressants: who’s to blame? Int Clin Psychopharmacol 13(Suppl 2):S19–25. [PubMed] [Google Scholar]
- Descarries L, Riad M. (2012). Effects of the antidepressant fluoxetine on the subcellular localization of 5-HT1A receptors and SERT. Phil Trans R Soc B 367:2416–2425. [DOI] [PMC free article] [PubMed] [Google Scholar]
- Domschke K, Tidow N, Schwarte K, Deckert J, Lesch KP, Arolt V, Zwanzger P, Baune BT. (2014). Serotonin transporter gene hypomethylation predicts impaired antidepressant treatment response. Int J Neuropsychop 17:1167–1176. [DOI] [PubMed] [Google Scholar]
- Endicott J, Spitzer RL. (1978). A diagnostic interview: the schedule for affective disorders and schizophrenia. Arch Gen Psychiatry 35:837–844. [DOI] [PubMed] [Google Scholar]
- Erlandsson K, Sivananthan T, Lui D, Spezzi A, Townsend CE, Mu S, Lucas R, Warrington S, Ell PJ. (2005). Measuring SSRI occupancy of SERT using the novel tracer [123I]ADAM: a SPECT validation study. Eur J Nucl Med Mol Imaging 32:1329–1336. [DOI] [PubMed] [Google Scholar]
- Erritzoe D, Frokjaer VG, Haahr MT, Kalbitzer J, Svarer C, Holst KK, Hansen DL, Jernigan TL, Lehel S, Knudsen GM. (2010). Cerebral serotonin transporter binding is inversely related to body mass index. Neuroimage 52:284–289. [DOI] [PubMed] [Google Scholar]
- Geday J, Hermansen F, Rosenberg R, Smith DF. (2005). Serotonin modulation of cerebral blood flow measured with positron emission tomography (PET) in humans. Synapse 55:224–229. [DOI] [PubMed] [Google Scholar]
- Gryglewski G, Lanzenberger R, Kranz GS, Cumming P. (2014). Meta-analysis of molecular imaging of serotonin transporters in major depression. J Cereb Blood Flow Metab 34:1096–1103. [DOI] [PMC free article] [PubMed] [Google Scholar]
- Hamilton M. (1960). A rating scale for depression. J Neurol Neurosurg Psychiatry 23:56–62. [DOI] [PMC free article] [PubMed] [Google Scholar]
- Ho PS, Ho KK, Huang WS, Yen CH, Shih MC, Shen LH, Ma KH, Huang SY. (2013). Association study of serotonin transporter availability and SLC6A4 gene polymorphisms in patients with major depression. Psychiatry Res 212:216–222. [DOI] [PubMed] [Google Scholar]
- Hsieh PC, Lee IH, Yeh TL, Chen KC, Huang HC, Chen PS, Yang YK, Yao WJ, Lu RB, Chiu NT. (2010). Distribution volume ratio of serotonin and dopamine transporters in euthymic patients with a history of major depression - a dual-isotope SPECT study. Psychiatry Res 184:157–161. [DOI] [PubMed] [Google Scholar]
- Huang SY, Lin WW, Ko HC, Lee JF, Wang TJ, Chou YH, Yin SJ, Lu RB. (2004). Possible interaction of alcohol dehydrogenase and aldehyde dehydrogenase genes with the dopamine D2 receptor gene in anxiety-depressive alcohol dependence. Alcohol Clin Exp Res 28:374–384. [DOI] [PubMed] [Google Scholar]
- Huang WS, Huang SY, Ho PS, Ma KH, Huang YY, Yeh CB, Liu RS, Cheng CY, Shiue CY. (2013). PET imaging of the brain serotonin transporters (SERT) with N,N-dimethyl-2-(2-amino-4-[18F]fluorophenylthio)benzylamine (4-[18F]-ADAM) in humans: a preliminary study. Eur J Nucl Med Mol Imaging 40:115–124. [DOI] [PubMed] [Google Scholar]
- Huang YY, Ma KH, Tseng TW, Chou TK, Ng H, Mirsalis JC, Fu YK, Chu TC, Huang WS, Shiue CY. (2010). Biodistribution, toxicity and radiation dosimetry studies of the serotonin transporter radioligand 4-[18F]-ADAM in rats and monkeys. Eur J Nucl Med Mol Imaging 37:545–555. [DOI] [PubMed] [Google Scholar]
- Ichise M, Meyer JH, Yonekura Y. (2001). An introduction to PET and SPECT neuroreceptor quantification models. J Nucl Med 42:755–763. [PubMed] [Google Scholar]
- Innis RB, et al. (2007). Consensus nomenclature for in vivo imaging of reversibly binding radioligands. J Cereb Blood Flow Metab 27:1533–1539. [DOI] [PubMed] [Google Scholar]
- Issler O, Haramati S, Paul ED, Maeno H, Navon I, Zwang R, Gil S, Mayberg HS, Dunlop BW, Menke A, Awatramani R, Binder EB, Deneris ES, Lowry CA, Chen A. (2014). MicroRNA 135 is essential for chronic stress resiliency, antidepressant efficacy, and intact serotonergic activity. Neuron 83:344–360. [DOI] [PubMed] [Google Scholar]
- Kaneda A, Yasui-Furukori N, Nakagami T, Sato Y, Kaneko S. (2011). The influence of personality factors on paroxetine response time in patients with major depression. J Affect Disord 135:321–325. [DOI] [PubMed] [Google Scholar]
- Kato M, Serretti A. (2010). Review and meta-analysis of antidepressant pharmacogenetic findings in major depressive disorder. Mol Psychiatry 15:473–500. [DOI] [PubMed] [Google Scholar]
- Kennedy SH, Konarski JZ, Segal ZV, Lau MA, Bieling PJ, McIntyre RS, Mayberg HS. (2007). Differences in brain glucose metabolism between responders to CBT and venlafaxine in a 16-week randomized controlled trial. Am J Psych 164:778–788. [DOI] [PubMed] [Google Scholar]
- Klein N, Sacher J, Geiss-Granadia T, Attarbaschi T, Mossaheb N, Lanzenberger R, Potzi C, Holik A, Spindelegger C, Asenbaum S, Dudczak R, Tauscher J, Kasper S. (2006). In vivo imaging of serotonin transporter occupancy by means of SPECT and [123I]ADAM in healthy subjects administered different doses of escitalopram or citalopram. Psychopharmacology (Berl) 188:263–272. [DOI] [PubMed] [Google Scholar]
- Kugaya A, Sanacora G, Staley JK, Malison RT, Bozkurt A, Khan S, Anand A, Van Dyck CH, Baldwin RM, Seibyl JP, Charney D, Innis RB. (2004). Brain serotonin transporter availability predicts treatment response to selective serotonin reuptake inhibitors. Biol Psychiatry 56:497–502. [DOI] [PubMed] [Google Scholar]
- Lanzenberger R, Kranz GS, Haeusler D, Akimova E, Savli M, Hahn A, Mitterhauser M, Spindelegger C, Philippe C, Fink M, Wadsak W, Karanikas G, Kasper S. (2012). Prediction of SSRI treatment response in major depression based on serotonin transporter interplay between median raphe nucleus and projection areas. Neuroimage 63:874–881. [DOI] [PubMed] [Google Scholar]
- Lehto SM, Tolmunen T, Joensuu M, Saarinen PI, Valkonen-Korhonen M, Vanninen R, Ahola P, Tiihonen J, Kuikka J, Lehtonen J. (2008). Changes in midbrain serotonin transporter availability in atypically depressed subjects after one year of psychotherapy. Prog Neuropsychopharmacol Biol Psychiatry 32:229–237. [DOI] [PubMed] [Google Scholar]
- Lin CH, Lane HY, Chen CC, Juo SH, Yen CF. (2011). Early prediction of fluoxetine response for Han Chinese inpatients with major depressive disorder. J Clin Psychopharmacol 31:187–193. [DOI] [PubMed] [Google Scholar]
- Mann JJ. (2013). The serotonergic system in mood disorders and suicidal behaviour. Phil Trans R Soc B 368:20120537. [DOI] [PMC free article] [PubMed] [Google Scholar]
- Mann JJ, Huang YY, Underwood MD, Kassir SA, Oppenheim S, Kelly TM, Dwork AJ, Arango V. (2000). A serotonin transporter gene promoter polymorphism (5-HTTLPR) and prefrontal cortical binding in major depression and suicide. Arch Gen Psychiatry 57:729–738. [DOI] [PubMed] [Google Scholar]
- Marchand WR, Lee JN, Johnson S, Thatcher J, Gale P, Wood N, Jeong EK. (2012). Striatal and cortical midline circuits in major depression: implications for suicide and symptom expression. Prog Neuropsychopharmacol Biol Psychiatry 36:290–299. [DOI] [PubMed] [Google Scholar]
- McCulloch EC, Searle RS, John M., Neuhaus MJ. (2008). Generalized, linear, and mixed models, 2nd Edition New York: Wiley. [Google Scholar]
- Meyer JH. (2007). Imaging the serotonin transporter during major depressive disorder and antidepressant treatment. J Psychiatry Neurosci 32:86–102. [PMC free article] [PubMed] [Google Scholar]
- Meyer JH, Houle S, Sagrati S, Carella A, Hussey DF, Ginovart N, Goulding V, Kennedy J, Wilson AA (2004a) Brain serotonin transporter binding potential measured with carbon 11-labeled DASB positron emission tomography: effects of major depressive episodes and severity of dysfunctional attitudes. Arch Gen Psychiatry 61:1271–1279. [DOI] [PubMed] [Google Scholar]
- Meyer JH, Wilson AA, Ginovart N, Goulding V, Hussey D, Hood K, Houle S. (2001). Occupancy of serotonin transporters by paroxetine and citalopram during treatment of depression: a [(11)C]DASB PET imaging study. Am J Psych 158:1843–1849. [DOI] [PubMed] [Google Scholar]
- Meyer JH, Wilson AA, Sagrati S, Hussey D, Carella A, Potter WZ, Ginovart N, Spencer EP, Cheok A, Houle S. (2004b). Serotonin transporter occupancy of five selective serotonin reuptake inhibitors at different doses: an [11C]DASB positron emission tomography study. Am J Psych 161:826–835. [DOI] [PubMed] [Google Scholar]
- Milak MS, Parsey RV, Lee L, Oquendo MA, Olvet DM, Eipper F, Malone K, Mann JJ. (2009). Pretreatment regional brain glucose uptake in the midbrain on PET may predict remission from a major depressive episode after three months of treatment. Psychiatry Res 173:63–70. [DOI] [PMC free article] [PubMed] [Google Scholar]
- Miller JM, Hesselgrave N, Ogden RT, Sullivan GM, Oquendo MA, Mann JJ, Parsey RV (2013) Positron emission tomography quantification of serotonin transporter in suicide attempters with major depressive disorder. Biol Psychiatry 74:287–295. [DOI] [PMC free article] [PubMed] [Google Scholar]
- Miller JM, Oquendo MA, Ogden RT, Mann JJ, Parsey RV. (2008). Serotonin transporter binding as a possible predictor of one-year remission in major depressive disorder. J Psychiatr Res 42:1137–1144. [DOI] [PMC free article] [PubMed] [Google Scholar]
- Mirza NR, Nielsen EO, Troelsen KB. (2007). Serotonin transporter density and anxiolytic-like effects of antidepressants in mice. Prog Neuropsychopharmacol Biol Psychiatry 31:858–866. [DOI] [PubMed] [Google Scholar]
- Newberg AB, Amsterdam JD, Wintering N, Ploessl K, Swanson RL, Shults J, Alavi A. (2005). 123I-ADAM binding to serotonin transporters in patients with major depression and healthy controls: a preliminary study. J Nucl Med 46:973–977. [PubMed] [Google Scholar]
- Newberg AB, Amsterdam JD, Wintering N, Shults J. (2012). Low brain serotonin transporter binding in major depressive disorder. Psychiatry Res 202:161–167. [DOI] [PMC free article] [PubMed] [Google Scholar]
- Ng C, Sarris J, Singh A, Bousman C, Byron K, Peh LH, Smith DJ, Tan CH, Schweitzer I. (2013). Pharmacogenetic polymorphisms and response to escitalopram and venlafaxine over 8 weeks in major depression. Hum Psychopharmacol 28:516–522. [DOI] [PubMed] [Google Scholar]
- Niitsu T, Fabbri C, Bentini F, Serretti A. (2013). Pharmacogenetics in major depression: a comprehensive meta-analysis. Prog Neuropsychopharmacol Biol Psychiatry 45:183–194. [DOI] [PubMed] [Google Scholar]
- Nogami T, Takano H, Arakawa R, Ichimiya T, Fujiwara H, Kimura Y, Kodaka F, Sasaki T, Takahata K, Suzuki M, Nagashima T, Mori T, Shimada H, Fukuda H, Sekine M, Tateno A, Takahashi H, Ito H, Okubo Y, Suhara T. (2013). Occupancy of serotonin and norepinephrine transporter by milnacipran in patients with major depressive disorder: a positron emission tomography study with [(11)C]DASB and (S,S)-[(18)F]FMeNER-D(2). Int J Neuropsychop 16:937–943. [DOI] [PubMed] [Google Scholar]
- Nye JA, Purselle D, Plisson C, Voll RJ, Stehouwer JS, Votaw JR, Kilts CD, Goodman MM, Nemeroff CB. (2013). Decreased brainstem and putamen SERT binding potential in depressed suicide attempters using [11 C]-ZIENT PET imaging. Depress Anxiety 30:902–907. [DOI] [PubMed] [Google Scholar]
- Okada S, Morinobu S, Fuchikami M, Segawa M, Yokomaku K, Kataoka T, Okamoto Y, Yamawaki S, Inoue T, Kusumi I, Koyama T, Tsuchiyama K, Terao T, Kokubo Y, Mimura M. (2014). The potential of SLC6A4 gene methylation analysis for the diagnosis and treatment of major depression. J Psychiatr Res 53:47–53. [DOI] [PubMed] [Google Scholar]
- Owens MJ, Krulewicz S, Simon JS, Sheehan DV, Thase ME, Carpenter DJ, Plott SJ, Nemeroff CB. (2008). Estimates of serotonin and norepinephrine transporter inhibition in depressed patients treated with paroxetine or venlafaxine. Neuropsychopharmacology 33:3201–3212. [DOI] [PubMed] [Google Scholar]
- Owens MJ, Nemeroff CB. (1994). Role of serotonin in the pathophysiology of depression: focus on the serotonin transporter. Clin Chem 40:288–295. [PubMed] [Google Scholar]
- Pampallona S, Bollini P, Tibaldi G, Kupelnick B, Munizza C. (2002). Patient adherence in the treatment of depression. Br J Psychiatry 180:104–109. [DOI] [PubMed] [Google Scholar]
- Papakostas GI, Perlis RH, Scalia MJ, Petersen TJ, Fava M. (2006). A meta-analysis of early sustained response rates between antidepressants and placebo for the treatment of major depressive disorder. J Clin Psychopharmacol 26:56–60. [DOI] [PubMed] [Google Scholar]
- Parsey RV, Hastings RS, Oquendo MA, Hu X, Goldman D, Huang YY, Simpson N, Arcement J, Huang Y, Ogden RT, Van Heertum RL, Arango V, Mann JJ.(2006a) Effect of a triallelic functional polymorphism of the serotonin-transporter-linked promoter region on expression of serotonin transporter in the human brain. Am J Psych 163:48–51. [DOI] [PubMed] [Google Scholar]
- Parsey RV, Hastings RS, Oquendo MA, Huang YY, Simpson N, Arcement J, Huang Y, Ogden RT, Van Heertum RL, Arango V, Mann JJ.(2006b) Lower serotonin transporter binding potential in the human brain during major depressive episodes. Am J Psych 163:52–58. [DOI] [PubMed] [Google Scholar]
- Parsey RV, Kent JM, Oquendo MA, Richards MC, Pratap M, Cooper TB, Arango V, Mann JJ.(2006c) Acute occupancy of brain serotonin transporter by sertraline as measured by [11C]DASB and positron emission tomography. Biol Psychiatry 59:821–828. [DOI] [PubMed] [Google Scholar]
- Peng CJ, Huang YY, Huang WS, Shiue CY. (2008). An automated synthesis of N,N-dimethyl-2-(2-amino-4-[18F]fluorophenylthio)benzylamine (4-[18F]-ADAM) for imaging serotonin transporters. Appl Radiat Isot 66:625–631. [DOI] [PubMed] [Google Scholar]
- Rausch JL, Fefferman M, Ladisich-Rogers DG, Menard M. (1989). Effect of nicotine on human blood platelet serotonin uptake and efflux. Prog Neuropsychopharmacol Biol Psychiatry 13:907–916. [DOI] [PubMed] [Google Scholar]
- Reimold M, Batra A, Knobel A, Smolka MN, Zimmer A, Mann K, Solbach C, Reischl G, Schwarzler F, Grunder G, Machulla HJ, Bares R, Heinz A. (2008). Anxiety is associated with reduced central serotonin transporter availability in unmedicated patients with unipolar major depression: a [11C]DASB PET study. Mol Psychiatry 13:606–613, 557. [DOI] [PubMed] [Google Scholar]
- Reivich M, Amsterdam JD, Brunswick DJ, Shiue CY (2004) PET brain imaging with [11C](+)McN5652 shows increased serotonin transporter availability in major depression. J Affect Disord 82:321–327. [DOI] [PubMed] [Google Scholar]
- Ruhe HG, Booij J, Reitsma JB, Schene AH. (2009). Serotonin transporter binding with [123I]beta-CIT SPECT in major depressive disorder versus controls: effect of season and gender. Eur J Nucl Med Mol Imaging 36:841–849. [DOI] [PubMed] [Google Scholar]
- Selvaraj S, Murthy NV, Bhagwagar Z, Bose SK, Hinz R, Grasby PM, Cowen PJ. (2011). Diminished brain 5-HT transporter binding in major depression: a positron emission tomography study with [11C]DASB. Psychopharmacology (Berl) 213:555–562. [DOI] [PubMed] [Google Scholar]
- Serafini G, Pompili M, Hansen KF, Obrietan K, Dwivedi Y, Shomron N, Girardi P. (2014). The involvement of microRNAs in major depression, suicidal behavior, and related disorders: a focus on miR-185 and miR-491-3p. Cell Mol Neurobiol 34:17–30. [DOI] [PubMed] [Google Scholar]
- Shiue GG, Choi SR, Fang P, Hou C, Acton PD, Cardi C, Saffer JR, Greenberg JH, Karp JS, Kung HF, Shiue CY. (2003). N,N-dimethyl-2-(2-amino-4-(18)F-fluorophenylthio)-benzylamine (4-(18)F-ADAM): an improved PET radioligand for serotonin transporters. J Nucl Med 44:1890–1897. [PubMed] [Google Scholar]
- Smalheiser NR, Lugli G, Rizavi HS, Torvik VI, Turecki G, Dwivedi Y. (2012). MicroRNA expression is down-regulated and reorganized in prefrontal cortex of depressed suicide subjects. PLOS ONE 7:e33201. [DOI] [PMC free article] [PubMed] [Google Scholar]
- Smith GS, Kramer E, Hermann C, Ma Y, Dhawan V, Chaly T, Eidelberg D. (2009). Serotonin modulation of cerebral glucose metabolism in depressed older adults. Biol Psychiatry 66:259–266. [DOI] [PMC free article] [PubMed] [Google Scholar]
- Smith GS, Ma Y, Dhawan V, Gunduz H, Carbon M, Kirshner M, Larson J, Chaly T, Belakhleff A, Kramer E, Greenwald B, Kane JM, Laghrissi-Thode F, Pollock BG, Eidelber D. (2002). Serotonin modulation of cerebral glucose metabolism measured with positron emission tomography (PET) in human subjects. Synapse 45:105–112. [DOI] [PubMed] [Google Scholar]
- Staley JK, Krishnan-Sarin S, Zoghbi S, Tamagnan G, Fujita M, Seibyl JP, Maciejewski PK, O’Malley S, Innis RB. (2001). Sex differences in [123I]beta-CIT SPECT measures of dopamine and serotonin transporter availability in healthy smokers and nonsmokers. Synapse 41:275–284. [DOI] [PubMed] [Google Scholar]
- Tanaka SC, Doya K, Okada G, Ueda K, Okamoto Y, Yamawaki S. (2004). Prediction of immediate and future rewards differentially recruits cortico-basal ganglia loops. Nat Neurosci 7:887–893. [DOI] [PubMed] [Google Scholar]
- Vergouwen AC, Bakker A, Katon WJ, Verheij TJ, Koerselman F. (2003). Improving adherence to antidepressants: a systematic review of interventions. J Clin Psychiatry 64:1415–1420. [DOI] [PubMed] [Google Scholar]
- Wu CS, Shau WY, Chan HY, Lai MS. (2013). Persistence of antidepressant treatment for depressive disorder in Taiwan. Gen Hosp Psychiatry 35:279–285. [DOI] [PubMed] [Google Scholar]
- Yeh YW, Ho PS, Chen CY, Kuo SC, Liang CS, Ma KH, Shiue CY, Huang WS, Cheng CY, Wang TY, Lu RB, Huang SY. (2014). Incongruent reduction of serotonin transporter associated with suicide attempts in patients with major depressive disorder: a positron emission tomography study with 4-[(18)F]-ADAM. Int J Neuropsychop. Advance online publication, in press. doi:10.1093/ijnp/pyu065. [DOI] [PMC free article] [PubMed] [Google Scholar]
Associated Data
This section collects any data citations, data availability statements, or supplementary materials included in this article.